This approach raises an obvious question: What about if someone is not a member of an average household? Averages can mislead: as we say in my part of the world, based on yearly averages, the Great Lakes never freeze. What about inflation for households that are poor or rich, older or younger, or face a specific situation? The straightforward and practical approach is to define a separate basket of goods that does represent your group of interest more accurately.
As one example, along with the Consumer Price Index for All Urban Consumers (CPI-U), which represents the spending habits for roughly 90 percent of the population of the United States, and the Consumer Price Index for Urban Wage Earners and Clerical Workers (CPI-W), which represents a smaller subset of about 30 percent of the U.S. population, the Bureau of Labor Statistics also produces an experimental Consumer Price Index-Elderly (CPI-E). The basket of goods in this index gives greater weight to health care, for example, because that category represents a larger share of spending for the elderly. There are occasional proposals that the CPI-E should be used for the annual cost-of-living adjustment applied to Social Security benefits, instead of the CPI-W used at present. Over the period from 1982-2014, annual Social Security adjustments would have been a modest 0.2% per year higher with this change.
The Federal Reserve Bank of Atlanta has set up an interesting website, myCPI, which lets you plug in some specific information about number of people in a household, income, homeowner vs. renter, and some other factors. The choices are fairly course: for example, there are only three categories for age and income, and two categories for education level. But it does show that measures of inflation will differ when taking different baskets of goods into account.
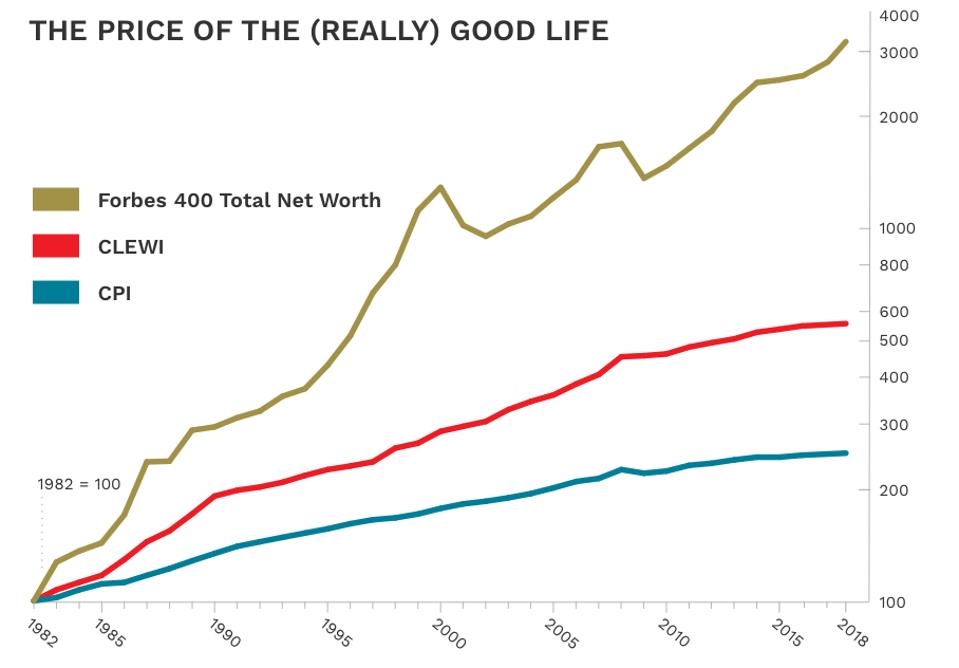
Some non-government groups have used the idea of a basket of goods as the basis for an annual article or report. For example, Forbes magazine publishes an annual Cost-of-Living-Extremely-Well Index (CLEWI). The index is based on 40 luxury items: for example, an ebonized Model D concert-grand Steinway piano in New York; a pair of 12-gauge side-by-side sporting shotguns from James Purdey & Sons in New Jersey; 12 cotton bespoke shirts from Turnbull & Asser in the UK; a Jules Audemars self-winding, 18-karat pink gold, alligator strap, Audemars Piguet Swiss watch; a case of Dom Perignon champagne; installing a Har-Tru crushed stone tennis court in Connecticut; and others. The CLEWI has been rising faster than the Consumer Price Index over time, but luckily for the very rich, the net worth of the Forbes 400 has risen faster still.
Another example is the annual American Farm Bureau estimate of the cost of Thanksgiving dinner. This year, they sent out 166 volunteer shoppers to grocery stores in 37 states, with the task of calculating what it would cost to purchase the ingredients for a representative dinner. The items include:

For an overview of some historical examples of price indexes, a useful starting point is the short article by Joseph Persky, "Retrospectives: Price Indexes and General Exchange Values," in the Winter 1998 issue of the Journal of Economic Perspectives. Perhaps my favorite historical example is the basket of goods used by the state of Massachusetts in 1780. As Persky describes it (citations omitted):
In 1780, Massachusetts enacted what may be the first documented case of formal price indexation. ... [F]acing a crisis in maintaining Revolutionary War enlistments at a time when the value of the currency was unstable and falling, they hit upon a scheme to use indexed interest-bearing notes as payment. Both principal and interest on these ‘‘depreciation notes’’ were to be paid not at their nominal values but ‘‘in the then current Money of the State, in a greater or less Sum, according as Five Bushels of Corn, Sixty-eight Pounds and four-seventh Parts of a Pound of Beef, Ten Pounds of Sheeps Wool, and Sixteen Pounds of Sole Leather shall then cost, more or less than One Hundred and Thirty Pounds of Current Money.’’ Pursuant to the Massachusetts act, county agents were named and charged with collecting average price data every month.There is apparently some historical question as to whether this price index was calculated accurately and honestly, but I love the example nonetheless. The idea of price indexes was apparently in the air around this time. Persky writes: "An Italian named G. R. Carli is often credited with having developed the first price index number. In work published about a decade before The Wealth of Nations, Carli made a serious empirical investigation of prices over time, including a simple average of the percentage changes in three commodities—grain, wine and oil—over the period 1500 to 1750."
Of course, the idea of buying a fixed basket of goods at two different points in time opens up a number of other obvious questions, too, which I haven't discussed here. What if consumers shift their pattern of consumption over time, perhaps by substituting goods that have become cheaper for goods that have become more expensive? What if the qualities of specific products change and evolve over time? What if new goods enter the market and replace older goods?
A body of economics research and several prominent commissions have looked at these issues of bias from substitution, quality change, and new goods over time. For a recent discussion of these issues, a useful starting point is the report by Brent R. Moulton, "The Measurement of Output, Prices, and Productivity: What’s Changed Since the Boskin Commission?" written for the Hutchins Center on Fiscal and Monetary Policy at Brookings (July 2018). For discussion of the Boskin Commission, see the six-paper symposium on "Measuring the CPI" in the Winter 1998 issue of the Journal of Economic Perspectives. For discussion of the Schultze commission report a few years later, see the three-paper symposium on the "Consumer Price Index" in the Winter 2003 issue of the JEP.