Emmanuel Saez has just made available his latest update on the share of income received by those at the very top of the income distribution. It's in a short working paper called "Striking it Richer:The Evolution of Top Incomes in the United States (Updated with 2015 preliminary estimates)" June 30, 2016). Saez offers a brief overview of the findings and a link to the underlying paper at the blog of the Washington Center for Equitable Growth.
Just to be clear, what's being measured here is "cash market income"--that is, income received before taxes are paid and not counting government transfer payments. As Saez writes: "We define income as the sum of all income components reported on tax returns (wages and salaries, pensions received, profits from businesses, capital income such as dividends, interest, or rents, and realized capital gains) before individual income taxes. We exclude government transfers such as Social Security retirement benefits or unemployment compensation benefits from our income definition. Non-taxable fringe benefits such as employer provided health insurance is also excluded from our income definition. Therefore, our income measure is defined as cash market income before individual income taxes."
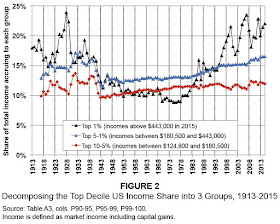
Here's a figure showing the share of cash market income going to the top 1% of the income distribution (that is above $443,000 of income in 2015), to the 95-99th percentile of the income distribution (income from $180,500 to $443,000 in income in 2015), and to the 90-95th percentile of the income distribution (that is, $124,800 to $180,500 in 2015). The overall pattern is U-shaped for all three lines. But for the bottom two lines, the U is relatively flat; for the top 1%, the U is a steeper fall and a steeper rise during the last century or so.
Here's a figure showing the share of total cash market income top .01% of the income distribution (in 2015, the 16,500 families with more than $11.3 million in income).
I won't rehearse here all of the arguments about the reasons behind this change. But I do think it's noteworthy that the share of cash market income received by the top 1% and the top 0.1% hit more-or-less the current level back in 1998, and since then has bobbed up and down around that level. This pattern suggests to me that at least some of the reason for the dramatic rise in incomes at the very top was associated with the combination of more stock options and the dot-com stock market boom of the 1990s, as I argue in "Stock Options: A Theory of Compensation and Income Inequality at the Top" (March 25, 2016).

