Pages

Monday, September 30, 2019

Trade: The Perils of Overstating Benefits and Costs

A vibrant and healthy economy will be continually in transition, as new technologies arise, leading to new production processes and new products, and consumer preferences shift. In addition, some companies will be managed better or have more motivated and skilled workers, while others will not. Some companies will build reputation and invest in organizational capabilities, and others will not.  International trade is of course one reason for the process of transition.

But international trade isn't the main driver of economic change--and especially not in a country like the United States with a huge internal market. In the world economy, exports and imports--which at the global level are equal to each other because exports from one country must be imports for another country--are both about 28% of GDP. For the US economy, imports are about 15% of GDP and exports are 12%, which is to say that they are roughly half the share of GDP that is average for other countries in the world.

However, supporters of international trade have some tendency to oversell its benefits, while opponents of international trade have some tendency to oversell its costs. This tacit agreement-to-overstate helps both sides avoid a discussion of the central role of domestic policies both in providing a basis for growth and for smoothing the ongoing process of adjustment.

Ernesto Zedillo Ponce de León makes this point in the course of a broader essay on "The Past Decade
and the Future of Globalization," which in a collection of essays called Towards a New Enlightenment? A Transcendent Decade (2018, pp. 247-265). It was published by Open Mind, which in turn is a nonprofit run by the Spanish bank BBVA. He writes (boldface type is added by me):
The crisis and its economic and political sequels have exacerbated a problem for globalization that has existed throughout: to blame it for any number of things that have gone wrong in the world and to dismiss the benefits that it has helped to bring about. The backlash against contemporary globalization seems to be approaching an all-time high in many places including, the United States.
Part of the backlash may be attributable to the simple fact that world GDP growth and nominal wage growth—even accounting for the healthier rates of 2017 and 2018—are still below what they were in most advanced and emerging market countries in the five years prior to the 2008–09 crisis. It is also nurtured by the increase in income inequality and the so-called middle-class squeeze in the rich countries, along with the anxiety caused by automation, which is bound to affect the structure of their labor markets.
Since the Stolper-Samuelson formulation of the Heckscher-Ohlin theory, the alteration of factor prices and therefore income distribution as a consequence of international trade and of labor and capital mobility has been an indispensable qualification acknowledged even by the most recalcitrant proponents of open markets. Recommendations of trade liberalization must always be accompanied by other policy prescriptions if the distributional effects of open markets deemed undesirable are to be mitigated or even fully compensated. This is the usual posture in the economics profession. Curiously, however, those members of the profession who happen to be skeptics or even outright opponents of free trade, and in general of globalization, persistently “rediscover” Stolper-Samuelson and its variants as if this body of knowledge had never been part of the toolkit provided by economics.
It has not helped that sometimes, obviously unwarrantedly, trade is proposed as an all-powerful instrument for growth and development irrespective of other conditions in the economy and politics of countries. Indeed, global trade can promote, and actually has greatly fostered, global growth. But global trade cannot promote growth for all in the absence  of other policies. 

The simultaneous exaggeration of the consequences of free trade and the understatement—or even total absence of consideration—of the critical importance of other policies that need to be in place to prevent abominable economic and social outcomes, constitute a double-edged sword. It has been an expedient used by politicians to pursue the opening of markets when this has fit their convenience or even their convictions. But it reverts, sometimes dramatically, against the case for open markets when those abominable outcomes—caused or not by globalization—become intolerable for societies. When this happens, strong supporters of free trade, conducted in a rules-based system, are charged unduly with the burden of proof about the advantages of open trade in the face of economic and social outcomes that all of us profoundly dislike, such as worsening income distribution, wage stagnation, and the marginalization of significant sectors of the populations from the benefits of globalization, all of which has certainly happened in some parts of the world, although not necessarily as a consequence of trade liberalization.
Open markets, sold in good times as a silver bullet of prosperity, become the culprit of all ills when things go sour economically and politically. Politicians of all persuasions hurry to point fingers toward external forces, first and foremost to open trade, to explain the causes of adversity, rather than engaging in contrition about the domestic policy mistakes or omissions underlying those unwanted ills. Blaming the various dimensions of globalization—trade, finance, and migration—for phenomena such as insufficient GDP growth, stagnant wages, inequality, and unemployment always seems to be preferable for governments, rather than admitting their failure to deliver on their own responsibilities.
Unfortunately, even otherwise reasonable political leaders sometimes fall into the temptation of playing with the double-edged sword, a trick that may pay off politically short term but also risks having disastrous consequences. Overselling trade and understating other challenges that convey tough political choices is not only deceitful to citizens but also politically risky as it is a posture that can easily backfire against those using it.
The most extreme cases of such a deflection of responsibility are found among populist politicians. More than any other kind, the populist politician has a marked tendency to blame others for his or her country’s problems and failings. Foreigners, who invest in, export to, or migrate to their country, are the populist’s favorite targets to explain almost every domestic problem. That is why restrictions, including draconian ones, on trade, investment, and migration are an essential part of the populist’s policy arsenal. The populist praises isolationism and avoids international engagement. The “full package” of populism frequently includes anti-market economics, xenophobic and autarkic nationalism, contempt for multilateral rules and institutions, and authoritarian politics. ... 
Crucially, for globalization to deliver to its full potential, all governments should take more seriously the essential insight provided by economics that open markets need to be accompanied by policies that make their impact less disruptive and more beneficially inclusive for the population at large.
Advocates of globalization should also be more effective in contending with the conundrum posed by the fact that it has become pervasive, even for serious academics, to postulate almost mechanically a causal relationship between open markets and many social and economic ills while addressing only lightly at best, or simply ignoring, the determinant influence of domestic policies in such outcomes.
Blaming is easy, and blaming foreigners is easiest of all. Proposing thoughtful domestic policy with a fair-minded accounting of benefits and costs is hard. 

Friday, September 27, 2019

Employment Patterns for Older Americans

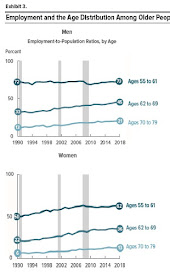
Americans are living longer, and also are more likely to be working in their 60s and 70s. The Congressional Budget Office provides an overview of some patterns in "Employment of People Ages 55 to 79" (September 2019). CBO writes:

"Between 1970 and the mid-1990s, the share of people ages 55 to 79 who were employed—that is, their employment-to-population ratio—dropped, owing particularly to men’s experiences. In contrast, the increase that began in the mid-1990s and continued until the 2007–2009 recession resulted from increases in the employment of both men and women. During that recession, the employment-to-population ratio for the age group overall fell, and the participation rate stabilized—with the gap indicating increased difficulty in finding work. The ensuing gradual convergence of the two measures reflects the slow recovery from the recession. The fall in the employment of men before the mid-1990s, research suggests, resulted partly from an increase in the generosity of Social Security benefits and pension plans, the introduction of Medicare, a decline in the opportunities for less-skilled workers, and the growth of the disability insurance system. Although those factors probably also affected women, the influence was not enough to offset the large increase in the employment of women of the baby-boom generation relative to those of the previous generation, most of whom were not employed."
Here are some underlying factors may help in understanding this pattern. If one breaks down the work of the elderly by male/female and by age groups, then it becomes clear that while men ages 55-61 are not more likely to be working, the other groups are. An underlying reason here is that women who are now ages 55 and older were more likely to be in the (paid) workforce earlier in life than women who were 55 and older back in 1990. Thus, part of the rise in work of older women just reflects more work earlier in life, carried over to later in life.  But
One possible reason for people working older in life can be linked to rising levels of education: that is, people with more education are more likely to have jobs that are better paid and involve less physical stress, and thus more likely to keep working. However, it's interesting that the rise in employment share for males ages 62-79 is about the same in percentage point terms for different levels of education; for females, the increase in employment share for this age group is substantially  higher for those with higher levels of education.

There's an interesting set of questions about whether working longer in life should be viewed a good thing. If the increase is due to those have jobs that they find interesting or rewarding and who want to continue working, then that seems positive. However, it's tempting to feel that if people who had their jobs but work longer primarily just because they need or want the money, and they would otherwise be financially insecure, then working longer in life is potentially more troublesome.

From this perspective, one might argue that it would be more troubling if the rise in employment among the elderly was concentrated in those with lower education levels --who on average may have less desirable jobs. But if the rise in employment among the elderly is either distributed evenly across education groups (males) or happens more among the more-educated (females), then it's harder to make the case that the bulk of this higher work among the elderly is happening because of low-skilled workers taking crappy jobs under financial pressure.

It's also true that the share of older people reporting that their health is "very good/excellent" has been rising in the last two decades, and the share reporting only "good" has been rising too. Conversely, the share reporting that their health is "fair/poor" has been falling for both males and females. Again, this pattern suggests that some of the additional work of the elderly is happening because a greater share of the elderly feel more able to do it.

One other change worth mentioning is that Social Security rules have evolved in a way that allows people to keep working after 65 and still receive at least some benefits. The CBO explains:
"Changes in Social Security policy that relate to the retirement earnings test (RET) have made working in one’s 60s more attractive. The RET specifies an age, an earnings threshold, and a withholding rate: If a Social Security claimant is younger than that age and has earnings higher than the specified threshold, some or all of his or her retirement benefits are temporarily withheld. Those withheld benefits are at least partially credited back in later years. Over time, the government has gradually made the RET less stringent by raising earnings thresholds, lowering withholding rates, and exempting certain age groups. For instance, in the early 1980s, the oldest age at which earnings were subject to the RET was reduced from 71 to 69, and in 2000, that age was further lowered to the FRA. (In 2000, the FRA was 65, and it rose to 66 by 2018.) Lowering the oldest age at which earnings are subject to the RET allowed more people to claim their full Social Security benefits while they continued working."
The question of how long in life life someone "should" work seems to me an intensely personal decision, but a decision that will be influenced by health, job options, pay, Social Security rules, rules about accessing retirement accounts and pensions, and more. But broadly speaking, it seems right to me that as Americans live longer and healthier, a larger share of them should be remaining in the workforce. The pattern of more elderly people working is also good news for the financial health of Social Security and the broader health of the US economy.

Thursday, September 26, 2019

The Charitable Contributions Deduction and Its Historical Evolution

Each year, the Analytical Perspectives volume produced  with the proposed US Budget includes a table of "tax expenditures," which is an estimate of how much various tax deductions, exemptions, and credits reduce federal tax revenues. For example , in 2019 the tax deduction for charitable contributions to education reduced federal tax revenue by $4.1 billion, the parallel deduction for charitable contributions to  health reduced federal tax revenue by $3.9 billion, and the deduction for all other charitable contributions reduced federal tax revenue by $36.6 billion.

But why was a deduction for charitable contributions first included in the tax code in 1917? And how has it evolved since then? Nicolas J. Duquette tells the story in  "Founders’ Fortunes and Philanthropy: A History of the U.S. Charitable-Contribution Deduction" (Business History Review, Autumn 2019,  93: 553–584, not freely available online, but many readers will have access through library subscriptions).

As Duquette points out, the notion of very rich business-people--like Rockefeller and Carnegie-- leaving their fortunes to charity was already in place when the federal income tax was enacted in 1913 and when the deduction for charitable contributions was added in 1917.  However, there was concern that as the income tax ramped up during World War I, charitable contributions might plummet, and then the government would need to take on the tasks being shouldered by charitable institutions. Duquette writes (footnotes omitted):
In the first years of the income tax, less than 1 percent of households were subject to it, and it had rates no higher than 15 percent. Quickly, however, the tax became an important  revenue instrument; in 1917 the top rate was abruptly raised to 67 percent to pay for World War I. The Congress added a deduction for gifts to charitable organizations to the bill implementing these high rates, not to encourage the wealthy to give their fortunes away (which the most influential and richest men were already doing) but to not discourage their continued giving in light of a larger tax bill. Senator Henry F. Hollis of New Hampshire—who was also a regent of the nonprofit Smithsonian Institution—proposed that filers be permitted to exclude from taxable income gifts to “corporations or associations organized and operated exclusively for religious, charitable, scientific, or educational purposes, or to societies for the prevention of cruelty to children or animals.” The senator argued for the change not because he thought it was wise public policy to change the “price” of charitable contributions via a subsidy but because of worries that reduced after-tax income of the very rich would end their philanthropy, shifting burdens the philanthropists had been carrying onto the backs of a wartime government. ... Hollis’s amendment to the War Revenue Act of 1917 was accepted unanimously and without controversy.
Notice the implication here that charitable contributions can reasonably be viewed as a one-for-one offset for government spending. The next inflection point for the charitable contributions deduction happens after World War II. The top income tax rates have risen very high. As a result, it was literally cheaper to give money to charity than to pay taxes--at least for that select group of taxpayers with very high income levels in the top tax brackets, and especially business leaders who held much of their wealth the form of corporate stock that would incur large capital gains taxes if sold. Duquette writes:
For the very rich, especially entrepreneurs like Carnegie and Rockefeller who grew their wealth through business expansion, charitable gifts of corporate stock avoided multiple taxes. Most obviously, their giving reduced their income tax, but under the deduction’s rules such gifts additionally avoided capital gains taxation. Furthermore, wealth given away was wealth not held at death, so giving during life also reduced the size of the donor’s taxable estate. When the U.S. Congress raised income tax rates to pay for the war and defense costs of the mid-twentieth century, it created a situation where many of the richest American families found that by giving their fortunes to a foundation they avoided more in taxation than they would have received in proceeds for selling shares of stock. Foundations flourished. ... [F]or several years in the middle of the twentieth century, it was quite possible for stock donations to be strictly better than sales of shares for households with high incomes and high capital gains.
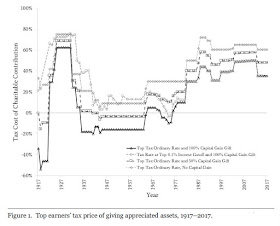
Here's an illustrative figure from Duquette. He explains:
Figure 1 plots the tax price of donating stock for various high-income tax brackets and capital gains ratios over the period 1917–2017. During World War I and for several years following World War II, wealthy industrialists with large unrealized capital gains facing the very highest  tax rates were better off donating shares than selling them, even if  they had no interest in philanthropy. Taxpayers with lower θ [a measure of the degree of capital gains available to the potential donor] or with taxable incomes not quite in the highest tax bracket may not have been literally better off making a donation in each of these years, but they nevertheless surrendered very little after-tax income by making a donation relative to selling their stock. Note, too, that this figure presents only tax savings relative to federal income and capital gains taxation; many donors quite likely received additional savings in the form of charitable-contribution deductions from state income taxation and by reducing their taxable estates.

The surge of charitable giving by the wealthy in the 1950s and into the 1960s, in response to these tax incentives, led to two counterreactions.

One was that those with high incomes began to use charitable foundations as a way of preserving family wealth and power.
Before 1969, there were few checks on the governance of family foundations or their handling of shareholder power. To entrepreneurs who had built large enterprises from scratch, the foundations presented an appealing way to have the benefit of selling shares without losing control of the business. Corporate shares sold to strangers could not be voted in line with the seller’s preferences; shares given to heirs and the heirs of heirs could lead to familial factionalism and, eventually, sales of shares by the least committed cousins; but a family foundation holding shares of stock and voting those shares as a bloc could maintain family control of a firm, however much the siblings and cousins may have squabbled at the foundation’s board meetings. Even better, family foundations could pay family members generous salaries to direct and manage the foundation, allowing them to continue to benefit from the profits redounding to the foundation’s stockholding. Although many industrialists gave directly to specific charities, the foundation vehicle had the additional benefit of being able to leave corporate control to one’s heirs through a single untaxed legal entity. Without the structure of a foundation, meeting the costs of the estate tax might force a family to sell shares below the 51 percent level of corporate control, or heirs might not coordinate their share voting as a bloc. ...
A 1982 survey found that half of the largest foundations established from 1940 to 1969 were begun with a gift of stock large enough to control a firm and that founders rated tax motivations as an important factor. This was true for few foundations established before 1939, when the wealthy would not have been better off giving than selling their shareholdings. ... Some corporate foundations were demonstrated to have made loans at below-market rates or to have made other suspicious business deals with their sponsoring firms.44 Private foundations further extended the insider control of corporations through maneuvering to conceal financial information or consolidate votes during shareholder  elections.45 Of the thirteen largest foundations that accounted for a large share of all foundation assets, twelve were controlled by a tight-knit and highly interlocked “power elite,” undermining the case that tax benefits to foundations served the public.

These use of charitable foundations became something of a scandal, and were highly restricted or outlawed by the Tax Reform Act of 1969.

The other counterreaction, related to the first, was a growing awareness that the deduction for charitable contributions was really a tax break for the rich. Taxpayers have a choice when filling out their taxes: they can take the "standard deduction," or they can itemize their deductions. The usual  pattern in recent decades has been that only about one-third of tax returns itemize deductions, and those tend to be people with higher incomes (who also have a lot of other deductions large enough to make itemizing worthwhile).  In addition, a person in the highest tax brackets saves more money from an additional $1 of tax deductions than a person in lower tax brackets.

Another important factor is that by the 1970s, the role of government in providing education, health, and support for the poor and elderly had increased quite a lot since the original introduction of the deduction for charitable contributions in 1917. Taking these factors and other together, Duquette explains:
The result was a shift from thelong-standing perspective of policymakers that the deduction protected philanthropic contributions to social goods and saved the Treasury money to a more skeptical and economistic perspective that the deduction was an implicit cost that must be justified by its benefits. ...
In particular, Martin Feldstein’s groundbreaking econometric studies of the deduction’s effectiveness, supported by Rockefeller III, reframed the deduction as  a “tax expenditure.” Instead of asking how much less the government needed to spend thanks to philanthropy, Feldstein asked how much the deduction cost the Treasury relative to the additional giving it induced. This tax price (described above) could be quantified relative to “treasury neutrality”—that is, whether it induced more dollars in giving than the federal government lost in tax revenue for having it. Feldstein’s answer was reassuring. He found that the deduction encouraged more giving than it cost in uncollected taxes. But his work elided the long-standing distinction between the philanthropy of the very rich and the mere giving of ordinary people.
In the last few decades, the role of the deduction for charitable contributions has been much diminished. Top marginal tax rates were cut in the 1980s, making the deduction less attractive. "Nevertheless, with reduced tax incentives, giving by the rich fell sharply. Households in the top 0.1 percent of the income distribution reduced the share of income they donated by half from 1980 to 1990, concurrent with the reduced value of the deduction over that period. In the aggregate, charitable giving overall fell from just over 2 percent of GDP in 1971 to its lowest postwar level, 1.66
percent of GDP, in 1996."

In addition, the 2017 Tax Cut and Jobs Act increased the standard deduction, and the forecasts are that the share of taxpayers who itemize deductions will fall from about one-third down to one-tenth. 

In short, the deduction for charitable contributions is going be be used by a smaller share of mainly high-income taxpayers, and with reduced incentives for using it. A large share of charitable giving--say, what the average person donates to community projects, charities, or their church--doesn't receive any benefit from the charitable contributions deduction. Many of the large charitable gifts no longer provide direct services, as government has taken over those tasks.

It seems to me that there is still a sense that the deduction for charitable contributions provides an incentive for big donations from those with high having incomes and wealth--an incentive that goes beyond good publicity and naming rights. There may also be some advantage in having nonprofits and charities rally support among big donors, rather than relying on the political process and government grants. But it also seems to me that the public policy case for a deduction for charitable contribution is as weak as it has ever been in the century since it was first put into place.

Wednesday, September 25, 2019

Save the Whales, Reduce Atmospheric Carbon

When it comes to holding down the concentrations of atmospheric carbon, I'm willing to consider all sorts of possibilities, but I confess I had never considered whales. Ralph Chami, Thomas Cosimano, Connel Fullenkamp, and Sena Oztosun have written "Nature’s Solution to Climate Change: A strategy to protect whales can limit greenhouse gases and global warming" (Finance & Development, September 2019, related podcast is here).

Here's how they describe the "whale pump" and the "whale conveyor belt": 
Wherever whales, the largest living things on earth, are found, so are populations of some of the smallest, phytoplankton. These microscopic creatures not only contribute at least 50 percent of all oxygen to our atmosphere, they do so by capturing about 37 billion metric tons of CO2, an estimated 40 percent of all CO produced. To put things in perspective, we calculate that this is equivalent to the amount of CO captured by 1.70 trillion trees—four Amazon forests’ worth ... More phytoplankton means more carbon capture.
In recent years, scientists have discovered that whales have a multiplier effect of increasing phytoplankton production wherever they go. How? It turns out that whales’ waste products contain exactly the substances—notably iron and nitrogen—phytoplankton need to grow. Whales bring minerals up to the ocean surface through their vertical movement, called the “whale pump,” and through their migration across oceans, called the “whale conveyor belt.” Preliminary modeling and estimates indicate that this fertilizing activity adds significantly to phytoplankton growth in the areas whales frequent. ...
What's the potential effect if whales and their environment was protected, so the total number of whales increased?
If whales were allowed to return to their pre-whaling number of 4 to 5 million—from slightly more than 1.3 million today—it could add significantly to the amount of phytoplankton in the oceans and to the carbon they capture each year. At a minimum, even a 1 percent increase in phytoplankton productivity thanks to whale activity would capture hundreds of millions of tons of additional COa year, equivalent to the sudden appearance of 2 billion mature trees. ...
We estimate the value of an average great whale by determining today’s value of the carbon sequestered by a whale over its lifetime, using scientific estimates of the amount whales contribute to carbon sequestration, the market price of carbon dioxide, and the financial technique of discounting. To this, we also add today’s value of the whale’s other economic contributions, such as fishery enhancement and ecotourism, over its lifetime. Our conservative estimates put the value of the average great whale, based on its various activities, at more than $2 million, and easily over $1 trillion for the current stock of great whales. ...
I'll leave for another day the question of what international rules or cross-country payments might be needed to help whale populations rebuild. I'll also leave for another day the nagging thought from the that cold rational section in the back of my brain that if a substantial increase in phytoplankton is a useful way to hold down atmospheric carbon, whales are surely not the only way to accomplish this goal. But it's a useful reminder that limiting the rise of carbon concentrations in the atmosphere is an issue that can be addressed from many directions.

Tuesday, September 24, 2019

A Funny Thing Happened on the Way to the Interest Rate Cut

Last week, the Federal Open Market Committee announced that it would "lower the target range for the federal funds rate to 1-3/4 to 2 percent." The previous target range had been from 2 to 2-1/4 percent.

As usual, the change raises further questions. Less than a  year ago, a common belief was that the Fed viewed "normalized" interest rates as being in the target range of 3 to 3-1/4%. Starting in 2015, the Fed had been steadily raising the target zone for the federal funds interest rate, reaching as high as a range of 2-1/4 to 2-1/2% in December 2018. But then in July 2019 there was a cut of 1/4%, now there has been another cut of 1/4% and a number of commenters are suggesting that further cuts are likely.

So should this succession of interest rate cuts  be viewed as detour on the road to the Fed's desire to reach a target range for the federal funds interest of 3 to 3-1/4%? Back in the mid-1990s, for example, Fed Chairman Alan Greenspan famously held off on raising the federal funds interest rate for some years because he believed (as it turn out, correctly) that the economic expansion of that time was not yet running into an danger of higher inflation or other macroeconomic limits. 

Or on the other hand, should the fall in interest rates be considered a  prelude to larger cuts in the next year or two. For example, President Trump has advocated via Twitter that the Fed should be pushing interest rates down to zero percent or less:
Here, I'll duck making predictions about what will happen next, and focus instead on a potentially not-so-funny thing that happened on the way to the interest rate cuts. What happened was that when the Fed wanted to reduce interest rates, one of the two main tools that the Fed now uses had its interest rate soar upward instead--and required a large infusion of funds from the Fed. Some background will be helpful here.

When the Fed decided to start raising the federal funds interest rate in 2015, it also needed to use new policy tools to do so. The old policy tools from before the Great Recession relied on the fact that the reserves that banks held with the Federal Reserve system were close to the minimum required level. For example, in mid-2008, banks were required to hold about $40 billion in reserves with the Fed, and they held roughly an extra $2 billion above that amount. But today, after years of quantitative easing, banks are required to hold about $140 billion dollars of reserves with the Fed, but instead are holding about $1.5 trillion in total reserves.

With these very high levels of bank reserves, the old-style monetary policies you may remember from a long-ago intro econ class--open market operations, changing the reserve requirement, or changing the discount rates--won't work any more. So the Fed invented two new ways of conducting monetary policy. For an overview of the change, Jane E. Ihrig, Ellen E. Meade, and Gretchen C. Weinbach discuss "Rewriting Monetary Policy 101: What’s the Fed’s Preferred Post-Crisis Approach to Raising Interest Rates?" in the Fall 2015 issue of the Journal of Economic Perspectives.

One is to change the interest rate that the Federal Reserve pays on excess reserves held by banks. To imagine how this works, say that a bank can get, say, a 2% return from the Fed for its excess reserves. Then the Fed cuts this interest rate to 1.8%. The lower return on its reserve holdings should encourage the bank to do some additional lending. 

However, the Fed in 2015 couldn't be sure if moving the interest rate on excess reserves would give it enough control over the federal funds interest rate that it wishes to target. Thus, the Fed stated that "it intended to use an overnight reverse repurchase agreement (ON RRP) facility as needed as a supplementary policy tool to help control the federal funds rate ... The Committee stated that it would use an ON RRP facility only to the extent necessary and will phase it out when it is no longer needed to help control the funds rate."

So what is a repurchase agreement, or a reverse repurchase agreement, and how is the Fed using them? A repo agreement is a way for parties that are  holding cash to lend it out, overnight, to parties that would like to borrow that cash overnight. However, the way it contractually works is that one set of firms sign an agreement to buy an asset from the other firm, like a US Treasury bond, and then the first firm agrees to repurchase that asset the next day for a slightly higher price. Here's a readable overview of the repo market from Bloomberg.

The repo market should work in tandem with the interest rate on excess reserves. Both of them involve something banks could do with their cash reserves: that is, banks could either leave the reserves with the Fed, or lend those cash reserves in the repo market. In both cases, the interest rate on excess reserves and the repo interest rate are the rates for safe, short-term lending, which is what the Fed us using to control the federal funds interest rate market for safe and short-term lending.

The story of what went wrong  last week can be told in two figures. When the Fed was announcing that it was going to reduce interest rates, the interest rates in the market for repurchase agreements suddenly soared instead. This interest rate has been hovering at a little above 2%, just about where the Fed wanted it. But when the Fed announced that it wanted a lower federal funds interest rate, the repo rate spiked.

Meanwhile, the shaded areas in this second figure show the target zone for the federal funds interest rate. You can see by the blue line that the actual or "effective" federal funds rate was in the desired zone in late 2018, then rises in December 2018 when the Fed used the interest rate on excess reserves as a tool to raise interest rates. When the Fed again adjusted the interest rate on excess rate on excess reserves to cut interest rates in June 2019, the effective federal funds rate drops. At the extreme right of the figure, you can see the tiny slice of the new, lower target zone for the federal funds interest rate that the Fed adopted last week. But notice that before the effective federal funds interest rate (blue line) falls, it first spikes upward, in the wrong direction. 
In short, the interest rate in the overnight repo market spiked, and for a day or two, the Fed was unable to keep the federal funds interest rate in the desired zone.

In one way, this is no big deal. The Fed did get the interest rate back under control. It responded to the spike in the overnight repo rate by offering to provide that market with up to $75 billion in additional lending, per day, for the next few weeks. With this spigot of cash available for borrowing, there's no reason for this interest rate to spike again.

But at a deeper level, there's some reason for concern. The Fed has been hoping to use the interest rate on excess reserves as its main monetary policy tool, but last week, that tool wasn't enough. In hindsight, financial analysts can point to this or that reason why the overnight rate suddenly spiked to 10%. A common story seems to be that there was a rie isn demand for short-term cash from companies making tax payments, but a surge in Treasury borrowing had termporarily soaked up a lot of the available cash,  and bank reserves at the Fed have been trending down for a time which also means less cash potentially available for short-run lending. But at least to me, those kinds reasons are both plausible and smell faintly of after-the-fact rationalization. Last week was the first time that the Fed  had needed to offer additional cash in the repo market in a decade.

In short, something unexpectedly and without advance warning went wrong with the Fed's preferred back-up tool for conducting monetary policy last week. If or when the Fed tries to reduce interest rates again, the functioning of its monetary policy tools will be the subject of hyperintense observation and speculation in financial markets.

Monday, September 23, 2019

Wage Trends: Tell Me How You Want to Measure, and I'll Give You an Answer

Want to prove that US wages are rising? Want to prove they are falling? Either way, you've come to the right place. Actually, the right place is a short essay, "Are wages rising, falling, or stagnating?" by Richard V. Reeves, Christopher Pulliam, and Ashley Schobert (Brookings Institution, September 10, 2019).

They point out that when discussing wage patterns, you need to make four choices: time period, measure of inflation, men or women, and average or median. Each of these choices has implications for your answer.

Time period. If you choose 1979 as a starting point, you are choosing a year right before the deep double-dip recessions in the first half of 1980 and then from mid-1981 to late 1982. Thus, long-term comparisons starting in 1979 start of with a few years of lousy wage growth, making overall wage growth look bad. On the other hand, wages are lower in 1990 than in some immediately surrounding years, so starting in 1990 tends to make wage increases over time look higher.

Measure of inflation. Any comparison of wages over time needs to adjust for inflation--but there are different measures of inflation. One commonly used measure is the Consumer Price Index for all Urban Consumers (CPI-U). Another is the Personal Consumption Expenditures Chain-Type Price Index.  I explained some differences between these approaches in a post a few years ago, but basically, they don't use the same goods, they don't weight the goods in the same way, and they don't calculate the index in the same way. The CPI is better-known, but when the Federal Reserve wants an estimate of inflation, it looks at the PCE index.

Here's a figure comparing these two measures of inflation. The figure sets both measures of inflation equal to 100 in 1970. By July 2019, the PCE says that inflation has raised prices since 1970 by a factor of 5.3, while the CPI says that prices risen during that time by a factor of 6.7. As a result, any comparison of wages that adjusts for inflation using the higher inflation rates in the CPI will tend to find a smaller increase in real wages.

Men or women? The experiences of men and women in the labor market have been quite different in recent decades. As one example, this figure shows what share of men and women have been participating in the (paid) labor force in recent decades.

In general, focusing on men tends to make wage growth patterns look worse, focusing on women tends to make them look better, and looking at the population as as whole mixes these factors together. If you would like to know more about problems of low-skilled male workers in labor markets, the Spring 2019 issue of the Journal of Economic Perspectives ran a three-paper symposium on the issue:
Average vs. Median. If you graph the distribution of wages, it  is not symmetric. There will be a long right-hand tail for those with high and very high incomes. Thus, the median of this distribution--the midpoint where 50% of people are above and 50% are below--will be lower than the average. To understand this, think about a situation where wages for the top 20% keep rising over time, but wages for the bottom 80% don't move. The average wage, which includes the rise at the top, will keep going up. But the median wage--the level with 50% above and below--won't move. At at time when inequality is rising, the average wage will be rising more than the median. One might also be interested in other points in the wage distribution, like whether wages are rising at the poverty line, or at the 20th percentile of the income distribution.

In short, every statement about wage trends over time implies some choices as to time period, measure of inflation, men/women, and average/median. Reeves, Pulliam, and Schobert do some illustrative calculations:
"If we begin in 1990, use PCE, include women and men, and look at the 20th percentile of wages, we can report that wages grew at a cumulative rate of 23 percent—corresponding to an annual increase of less than one percent. In contrast, if we begin in 1979, use CPI-U-RS, focus on men, and look at the 20th percentile of wages, we see wages decline by 13 percent."
Finally, although the discussion here is focused on wages, a number of the points apply more broadly. After all, any comparisons of economic values over time involve choices of time  period and a measure of inflation, often along with other factors relevant to each specific question.

Friday, September 20, 2019

Is the US Dollar Fading as the World's Dominant Currency?

When I'm talking to a public group, it's surprisingly common for me to get questions about when or whether the US dollar will fade as the world's dominant currency. Eswar Prasad offers some evidence on this question in "Has the dollar lost ground as thedominant internationalcurrency?" (Brookings Institution, September 2019). Prasad writes: 
Currencies that are prominent in international financial markets play several related but distinct roles—as mediums of exchange, units of account, and stores of value. Oil and other commodity contracts are mostly denominated in U.S. dollars, making it an important unit of account. The dollar is the dominant invoicing currency in international trade transactions, especially if one excludes trade within Europe and European countries’ trade with the rest of the world, a significant fraction of which is invoiced in euros. The dollar and euro together account for about three-quarters of international payments made to settle cross-border trade and financial transactions, making them the leading mediums of exchange.
The store-of-value function is related to reserve currency status. Reserve currencies are typically hard currencies, which are easily available and can be traded freely in global currency markets, that are seen as safe stores of value. A key aspect of the configuration of global reserve currencies is the composition of global foreign exchange (FX) reserves, which are the foreign currency asset holdings of national central banks. The dollar has been the main global reserve currency since it usurped the
British pound sterling’s place after World War II.
Prasad digs into the data about the share of US dollar holdings in foreign exchange reserves of central banks. The IMF collects this data. In the last few years, the US dollar share of "allocated" foreign reserves has fallen from 66% to 62%, which seems like a relatively big drop in a short time--depending on what that word "allocated" means.

As Prasad explains, countries don't always report the currencies in which they are holding foreign exchange reserves, because they don't have to do so and the information might feel sensitive. The  IMF promises that it will keep the country-level information confidential, and only report, the aggregate numbers--as in the figure. If a central bank does reveal what currency that it is holding for foreign exchange reserves, this amount is "allocated." Thus, the blue line in the figure shows that central banks have become much more willing to tell the IMF, confidentially, what currencies they are  holding.

Prasad argues: "The recent seemingly precipitous four-percentage-point decline in the dollar’s share of global FX reserves, from 66 percent in 2015 to 62 percent in 2018, is probably a statistical artifact related to changes in the reporting of reserves. This shift in the dollar’s share was likely affected by how China and other previous non-reporters chose to report the currency composition of their reserves, which they did gradually over the 2014-2018 period."

Another measure of the use of the US dollar in international markets comes from how it is used in global foreign exchange markets. The gold standard for this date is the triennial survey of over-the-counter foreign exchange markets done by the Bank of International Settlements, and data for the 2019 survey is just becoming available from BIS.  Their results show:
  • Trading in FX markets reached $6.6 trillion per day in April 2019, up from $5.1 trillion three years earlier. Growth of FX derivatives trading, especially in FX swaps, outpaced that of spot trading.
  • The US dollar retained its dominant currency status, being on one side of 88% of all trades. The share of trades with the euro on one side expanded somewhat, to 32%. By contrast, the share of trades involving the Japanese yen fell some 5 percentage points, although the yen remained the third most actively traded currency (on one side of 17% of all trades).
  • As in previous surveys, currencies of emerging market economies (EMEs) again gained market share, reaching 25% of overall global turnover. Turnover in the renminbi, however, grew only slightly faster than the aggregate market, and the renminbi did not climb further in the global rankings. It remained the eighth most traded currency, with a share of 4.3%, ranking just after the Swiss franc.

Yet another measure of the US dollar as a global currency is its use in international payments made through the SWIFT system (which stands for Society for Worldwide Interbank Financial Telecommunication). Prasad offers some evidence here: "For instance, from 2012 to 2019, the dollar’s share of cross-border payments intermediated through the SWIFT messaging network has risen by 10 percentage points to 40 percent, while the euro’s share has declined by 10 percentage points to 34 percent. The renminbi’s share of global payments has fallen back to under 2 percent."

In short, the US dollar has been maintaining its dominance as the world's dominant currency in recent years. There is some movement back and forth between the rest of the currencies in the world--the EU euro, China's renminbi yuan, Japanese yen, British pound, Swiss franc, and others--but the international leadership of the US dollar has not been significantly challenged. As Prasad writes:
[G]iven the ongoing economic difficulties and political tensions in the eurozone, it is difficult to envision the euro posing much of a challenge to the dollar’s dominance as a reserve currency or even as an international payment currency.

Does the renminbi pose a realistic challenge to the dollar in the long run? China’s large and rising weight in global GDP and trade will no doubt stimulate greater use of the renminbi in the denomination and settlement of cross-border trade and financial transactions. The renminbi’s role as an international payment currency will, however, be constrained by the Chinese government’s unwillingness to free up the capital account and to allow the currency’s value to be determined by market forces.  ...
While change might eventually come, the recent strengthening of certain aspects of the dollar’s dominance in global finance suggests that such change could be far off into the future. It would require substantial changes in the economic and, in some cases, financial and institutional structures of major economies accompanied by significant modifications to the system of global governance. For now and into the foreseeable future—and given the lack of viable alternatives—the dollar reigns supreme.

Wednesday, September 18, 2019

A Road Stop on the Development Journey

Economic development is a journey that has no final destination, at least not this side of utopia. But it can still be useful to take a road stop along the journey, see where we've been, and contemplate what comes next. Nancy H. Chau and Ravi Kanbur offer such an overview in their essay "The Past, Present, and Future of Economic Development," which appears in a collection of essays called
Towards a New Enlightenment? A Transcendent Decade (2018, pp. 311-325). It was published by Open Mind, which in turn is a nonprofit run by the Spanish bank BBVA (although it does have a US presence, mainly in the south and west).

(In the shade of this parenthesis, I'll add that if even or especially if your interests run beyond economics, the book may be worth checking out. It includes essays on the status of physics, anthropology, fintech, nanotechnology, robotics, artificial intelligence, gene editing, social media, cybersecurity, and more.)

It's worth remembering and even marveling at some of the extraordinary gains in the standard of living for so much of the globe in the last three or four decades. Chau and Kanbur write:
The six decades after the end of World War II, until the crisis of 2008, were a golden age in terms of the narrow measure of economic development, real per capita income (or gross domestic product, GDP). This multiplied by a factor of four for the world as a whole between 1950 and 2008. For comparison, before this period it took a thousand years for world per capita GDP to multiply by a factor of fifteen. Between the year 1000 and 1978, China’s income per capita GDP increased by a factor of two; but it multiplied six-fold in the next thirty years. India’s per capita income increased five-fold since independence in 1947, having increased a mere twenty percent in the previous millennium. Of course, the crisis of 2008 caused a major dent in the long-term trend, but it was just that. Even allowing for the sharp decreases in output as the result of the crisis, postwar economic growth is spectacular compared to what was achieved in the previous thousand years. ...
But, World Bank calculations, using their global poverty line of $1.90 (in purchasing power parity) per person per day, the fraction of world population in poverty in 2013 was almost a quarter of what it was in 1981—forty-two percent compared to eleven percent. The large countries of the world—China, India, but also Vietnam, Bangladesh, and so on—have contributed to this unprecedented global poverty decline. Indeed, China’s performance in reducing poverty, with hundreds of millions being lifted above the poverty line in three decades, has been called the most spectacular poverty reduction in all of human history. ...
Global averages of social indicators have improved dramatically as well. Primary school completion rates have risen from just over seventy percent in 1970 to ninety percent. now as we approach the end of the second decade of the 2000s. Maternal mortality has halved, from 400 to 200 per 100,000 live births over the last quarter century. Infant mortality is now a quarter of what it was half a century ago (30 compared to 120, per 1,000 live births). These improvements in mortality have contributed to improving life expectancy, up from fifty years in 1960 to seventy years in 2010.

It used to be that the world's poorest people were heavily clustered in the world's poorest countries. But as the economies of countries like China and India have grown, this is no longer true: "[F]orty years ago ninety percent of the world’s poor lived in low-income countries. Today, three quarters of the world’s poor live in middle-income countries." In this way, the task of thinking about how to help the world's poorest has changed its nature. 

Of course, Chau and Kanbur also note remaining problems in the world's development journey. A number of countries still lag behind. There are environmental concerns over air quality, availability of clean water, and climate change. I was especially struck by their comments about the evolution of labor markets in emerging economies. 
[L]abor market institutions in emerging markets have also seen significant developments. Present-day labor contracts no longer resemble the textbook single employer single worker setting that forms the basis for many policy prescriptions. Instead, workers often confront wage bargains constrained by fixed-term, or temporary contracts. Alternatively, labor contracts are increasingly mired in the ambiguities created in multi-employer relationships, where workers must answer to their factory supervisors in addition to layers of middleman subcontractors. These developments have created wage inequities within establishments, where fixed-term and subcontracted workers face a significant wage discount relative to regular workers, with little access to non-wage benefits. Strikingly, rising employment opportunities can now generate little or even negative wage gains, as the contractual composition of workers changes with employment growth. ...
[A]nother prominent challenge that has arisen since the 1980s is the global decline in the labor share. The labor share refers to payment to workers as a share of gross national product at the national level, or as a share of total revenue at the firm level. Its downward trend globally is evident using observations from macroeconomic data (Karababounis and Neiman, 2013; Grossman et al., 2017) as well as from firm-level data (Autor et al., 2017). A decline in the labor share is symptomatic of overall economic growth outstripping total labor income. Between the late 1970s and the 2000s the labor share has declined by nearly five percentage points from 54.7% to 49.9% in advanced economies. By 2015, the figure rebounded slightly and stood at 50.9%. In emerging markets, the labor share likewise declined from 39.2% to 37.3% between 1993 and 2015 (IMF, 2017).
A running theme in work on economic development is that there is a substantial gap in low- and middle-income countries between those who have a steady formal job with a steady paycheck, and those who are scrambling between multiple informal jobs. Thinking about how to encourage an economic environment where employers provide steady and secure jobs is just one of the ways in which issues in modern development economics often have interesting overlaps with the economic policy issues of high-income countries. 

Monday, September 16, 2019

When the University of Chicago Dropped Football

There was a time when football was king at the University of Chicago. Their famous coach, Amos Alonzo Stagg, ran the program from 1892 to 1932. His teams were (unofficial, but widely recognized) national champions in 1905 and 1913. His teams won 314 games, which means that even after all these years he ranks 10th for most wins among college football coachesStagg is credited with fundamental innovations to the way we think about football: the "tackling dummy, the huddle, the reverse and man in motion plays, the lateral pass, uniform numbers."

But in 1939, in a step that seems to me almost inconceivable for any current university with a big-time football program, the President of the University of Chicago, Robert Maynard Hutchins, shut down the University of Chicago football team.

For a sense of how shocking this was, I'll quote from Milton Mayer's 1993 biography, Robert Maynard Hutchins: A Memoir (pp. 139- 140).  Mayer describes the role of Amos Alonzo Stagg, the Grand Old Man, at the University of Chicago.
The Old Man was Chicago's oldest—and only indigenous—collegiate tradition except for the campus carillon rendition of the Alma Mater at 10:06 every night because the Old Man wanted his players to start for bed at 10:00 and to get there when the Alma Mater was finished at 10:06:45. The most reverent moment of the year was the moment at the Interfraternity Sing when the old grads of Psi Upsilon marched down the steps to the fountain in Hutchison Court with the Old Man at their head. If ever there was a granite figure that bespoke the granite virtues, it was his.
In 1892 ... Amos Alonzo Stagg was appointed as an associate professor (at $2,500 a year) with lifetime tenure—the first (and very probably the last) such appointment in history. His job would never depend upon his winning games. But he won them; in his heyday, all of them. As a stern middle-aged, and then old, man he continued to believe in the literalism of the Bible and the amateurism of sports. If (as untrackable rumor had it) some of his latter-day players were slipped a little something—even so much as priority in getting campus jobs—he never knew it. If their fraternity brothers selected their courses (with professors who liked football) and wrote their papers for them, if, in a word, they were intellectually needy, he never recognized it; apart from coaching football, he was not intellectually affluent himself.
The Old Man was sacred, sacred to a relatively small but ardent segment of the alumni, sacred to some of the old professors who had come with him in 1892, sacred to some of the trustees who, in their time, had had their picture taken on the Yale Fence, sacred to the students, who had nothing else to hold sacred, sacred to the local barbers and their customers, sacred, above all, to the local sports writers who, with the Cubs and the White Sox where they were, had nothing much else to write about. The first Marshall Field had given Harper a great tract adjoining the original campus for the student games that Harper spoke of. It was called, of course, Marshall Field, but it had long since become Stagg Field. The Old Man was untouchable—and so, therefore, was football.
But by the 1930s, University of Chicago football had been in decline for some time. As Mayer describes it, the 57,000-seat stadium was about one-tenth full. Part of the reason was that enrollments had grown much more at other schools, and the University of Chicago at that time was attracting large numbers of self-supporting transfer students who rode the streetcars to the school and had little interest in big-time football. In addition, U-Chicago had not bent to accommodate the then-common patterns of big-time college football. About half of all Big Ten college football players at that time majored in physical education, which Chicago did not offer as a major. In addition, it was standard practice at the time for college alumni to subsidize the players, a practice that--by the 1930s--was not encouraged at U-Chicago.  

Hutchins was clearly considering an end to University of Chicago football for several years. In one anecdote, he was asked by a college trustee: "Football is what unifies a university—what will take its place?" Hutchins answered: "Education." Hutchins nudged Stagg out the door after 40 years. By 1938, Hutchins was ready to go public in an essay in the Saturday Evening Post called "Gate Receipts and Glory" (December 3, 1938). It was full of comments like this:
Money is the cause of athleticism in the American colleges. Athleticism is not athletics. Athletics is physical education, a proper function of the college if carried on or the welfare of the students. Athleticism is not physical education but sports promotion, and it is carried on for the monetary profit of the colleges through the entertainment of the public. ... 
Since the primary task of colleges and universities is the development of the mind, young people who are more interested in their bodies than in their minds should not go to college. Institutions devoted to the development of the body are numerous and inexpensive. They do not pretend to be institutions of learning, and there is no faculty of learned men to consume their assets or interfere with their objectives. Athleticism attracts boys and girls to college who do not want and cannot use a college education. They come to college for "fun." They would be just as happy in the grandstand at the Yankee Stadium, and at less expense to their parents. They drop out of college after awhile, but they nre a sizable fraction of many freshman classes, and, while they last, they make it harder for the college to educate the rest. Even the earnest boys and girls who come to college for an education find it difficult, around the middle of November, to concentrate on the physiology of the frog or the mechanics of the price structure. ...
Most athletes will admit that the combination of weariness and nervousness after a hard practice is not conducive to study. We can thus understand why athleticism does not contribute to the production of well-rounded men destined for leadership after graduation. In many American colleges it is possible for a boy to win twelve letters without learning how to write one.
When teaching a college class, I've had the experience of a scholarship athlete coming up to me to apologize and to explain that, while they enjoyed my class, the pressures of early-morning weightlifting, frequent travel, or recovering from injury made it hard for them to study and to perform well. As a teacher, it's a helpless feeling. You can't reasonably tell a student to give up their athletic scholarship. The university was paying these very young adults for their athletic performance, which has for them become a ball-and-chain on their academic performance. 
 
Hutchins points out that the revenues available from big-time football led schools to an arms race in which they feel compelled to spend ever-more on coaches, practice facilities, and support of teams. It also led to pressure to expand the season (which was then often eight or nine games) to bring in additional revenues. But the overall balance of high spending in the quest for high revenues was that college athletics were a money-losing proposition. That's still true today, when the typical university with big-time athletics loses money on its athletics program: that is, revenue-producing sports like football, basketball, and some places hockey or volleyball are not enough to cover the expenses of the athletic department.

Hutchins offered a few proposals that he surely knew to be doomed. How about nearly free admission to all college athletic events? Hutchins suggested 10 cents. With this change, athletics would become part of the overall university budget, and could make its case for support vs. other possible uses of university funds. A likely outcome might be that an emphasis on intramurals with broad participation across the student body, in activities that people will be to do all their lives (unlike football), will get priority.  How about lifetime tenure for athletic directors and coaches? After all, if they are being hired for their character and knowledge and past record, why should their future employment depend on whether they have a few seasons with a poor won-loss record?  

Hutchins announced the end of football in a relatively short address to the University of Chicago students on January 12, 1940 ("Football and College Life" (Address to undergraduates, Mandel Hall, University of Chicago, January 12, 1940, available in 1940 Essay Annual: A Yearly Collection of Significant Essays Personal, Critical, Controversial, and Humorous, edited by Erich A. Walter, and published by Scott Foresman). A few snippets: 
I think it is a good thing for the country to have one important university discontinue football. There is no doubt that on the whole the game has been a major handicap to education in the United States. ... The greatest obstacle to the development of' a university in this country is the popular misconceptions of what a university is. The two most popular of these are that it is a kindergarten and that it is' a country club. Football has done as much as any single thing to originate, disseminate, and confirm these misconceptions. By getting rid of football, by presenting the spectacle of a university
that can be great without football, the University of Chicago may perform a signal service to higher education throughout the land. ... 
I hope that it is not necessary for me or anyone else to tell you that this is an educational institution, that education is primarily concerned with the training of the mind, and that athletics and social life, though they may contribute to it, are not the heart of it and cannot be permitted to interfere with it. ...  The question is a question of emphasis. I do not say that a university must be all study and no athletics and social life. I say that a university must emphasize education and not athletics and social life. The policy of this university is to co-operate with its students in sponsoring any healthy activity that does not interfere too seriously with their education.
In 1954, Hutchins wrote an article for Sports Illustrated looking back at his decision, called "College Football is an Infernal Nuisance" (October 18). He wrote: 
"But we Americans are the only people in human history who ever got sport mixed up with higher education. No other country looks to its universities as a prime source of athletic entertainment. In some other countries university athletic teams are unheard of; in others; like England, the teams are there, but their activities are valued chiefly as affording the opportunity for them and their adherents to assemble in the open air. Anybody who has watched, as I have, 12 university presidents spend half a day solemnly discussing the Rose Bowl agreement, or anybody who has read—as who has not?—portentous discussions of the "decline" of Harvard, Yale, Stanford, or Chicago because of the recurring defeats of its football team must realize that we in America are in a different world.
Maybe it is a better one. But I doubt it. I believe that one of the reasons why we attach such importance to the results of football games is that we have no clear idea of what a college or university is. We can't understand these institutions, even if we have graduated from one; but we can grasp the figures on the scoreboard. ...
To anybody seriously interested in education intercollegiate football presents itself as an infernal nuisance. ... When Minnesota was at the height of its football power, the president offered me the team and the stadium if I would take them away: his team was so successful that he could not interest the people of the state in anything else. ... Are there any conditions under which intercollegiate football can be an asset to a college or university? I think not.
One comment from that 1954 essay made me laugh out loud. Hutchins thought that the rise of professional football would lead to the demise of college football.
The real hope lies in the slow but steady progress of professional football. If the colleges and universities had had the courage to take the money out of football by admitting all comers free, they could have made it a game instead of a business and removed the temptations that the money has made inevitable and irresistible. Professional football is destined to perform this service to higher education. Not enough people will pay enough money to support big-time intercollegiate football in the style to which it has become accustomed when for the same price they can see real professionals, their minds unconfused by thoughts of education, play the game with true professional polish.
I should add that I'm a long-standing fan of all kinds of sports, both collegiate and professional. College athletes and their competitions can be marvelous. But the emphasis that so many American universities and colleges place on their intercollegiate athletics teams seems to me hard to defend. 

Saturday, September 14, 2019

Classroom vs. Smartphone: One Instructor Surrenders


It's of course possible both to teach and to learn via a video or a book. But there's an implicit vision many of us share about what happens in a college classroom between a professor and students. It involves how a classroom comes together as a shared experience, as the participants develop both a closeness and an openness with each other. There is an underlying belief that the process of learning through an interwoven reaction and counterreaction, sustained in this shared atmosphere, is part of what matters for an education, not just a a score on a test of pre-specified learning objectives. 

There's a strong case to be made for the gains from using various forms of information technology to learn (more on that in a moment). But the tradeoff of IT-enabled learning is that this vision of shared classroom space is changed beyond recognition. Tim Parks offers a personal lamentation for what is lost in "The Dying Art of Instruction in the Digital Classroom," at the New York Review of Books "Daily" website (July 31, 2019). He writes: 
The combination of computer use, Internet, and smart phone, I would argue, has changed the cognitive skills required of individuals. Learning is more and more a matter of mastering various arbitrary software procedures that then allow information to be accessed and complex operations to be performed without our needing to understand what is entailed in those operations. This activity is then carried on in an environment where it is quite normal to perform two, three, or even four operations at the same time, with a general and constant confusion of the social, the academic, and the occupational.

The idea of a relationship between teacher and class, professor and students, is consequently eroded. The student can rapidly check on his or her smartphone whether the professor is right, or indeed whether there isn’t some other authority offering an entirely different approach. With the erosion of that relationship goes the environment that nurtured it: the segregated space of the classroom where, for an hour or so, all attention was focused on a single person who brought all of his or her experience to the service of the group. 
As Parks acknowledges, a crappy teacher will fail to build such a relationship. He writes: "I can think of no moments of my life more utterly squandered than my last high school year of math lessons with a pleasant enough man whose only aim seemed to be to get out of the classroom unscathed." But his theme is has become harder to build the classic college teaching relationship. He writes: 
Last year, the university told me they could no longer give me a traditional classroom for my lesson. So I have thirty students behind computer screens attached to the Internet. If I sit behind my desk at the front of the class, or even stand, I cannot see their faces. In their pockets, in their hands, or simply open in front of them, they have their smartphones, their ongoing conversations with their boyfriends, girlfriends, mothers, fathers, or other friends very likely in other classrooms. There is now a near total interpenetration of every aspect of their lives through the same electronic device.
To keep some kind of purpose and momentum, I walked back and forth here and there, constantly seeking to remind them of my physical presence. But all the time the students have their instruments in front of them that compel their attention. While in the past they would frequently ask questions when there was something they didn’t understand—real interactivity, in fact—now they are mostly silent, or they ask their computers. Any chance of entering into that “passion of instruction” is gone. I decided it was time for me to go with it. 
Parks notes that IT-enabled learning has definite and real advantages.
My youngest daughter recently signed on for a higher-level degree in which all the teaching is accessed through the Internet. Lectures are prepared and recorded once and for all as videos that can be accessed by class after class of students any number of times. You have far more control, my daughter observes: if there’s something that’s hard to understand, you can simply go back to it. You don’t have to hear your friends chattering. You don’t have to worry about what to wear for lessons. You don’t miss a day through illness. And the teachers, she thinks, make more of an effort to perfect the lesson, since they only have to do it once.
But many colleges and universities are moving to combination of courses that are explicitly online with courses where the students are there in body, but their spirits are online. Perhaps the gains from this shift outweigh the losses, and in any event, the pressures of cost constraints and cultural expectations mean that there's little to done to stem the tide. As faculty and students have less experience with the old pedagogical model, they will all become less well-equipped to participate in it, and it will look even less attractive. Parks is offering a reminder of what is being lost:
[I]t’s also clear that this is the end of a culture in which learning was a collective social experience implying a certain positive hierarchy that invited both teacher and student to grow into the new relationship that every class occasions, the special dynamic that forms with each new group of students. This was one of the things I enjoyed most with teaching: the awareness that each different class—I would teach them every week for two years—was creating a different, though always developing, atmosphere, to which I responded by teaching in a different way, revisiting old material for a new situation, seeing new possibilities, new ideas, and spotting weaknesses I hadn’t seen before.  It was a situation alive with possibility, unpredictability, growth. But I can see that the computer classroom and smartphone intrusion are putting an end to that, if only because there’s a limit to how much energy one can commit to distracting students from their distractions.

Friday, September 13, 2019

Is the US Economy Having an Engels' Pause?

Consider a time period of several decades when there is a high level of technological progress, but typical wage levels remain stagnant while profits soar, driving a sharp rise in inequality. In broad-brush terms, this description fits the US economy for the last few decades. But it also fits the economy of the United Kingdom during the first wave of the Industrial Revolution in the first half of the 19th century.

Economic historian Robert C. Allen calls this the "Engels' pause," because Friedrich Engels, writing in books like The Condition of the Working Class in England in 1844, described this confluence of economic patterns. Allen laid out the argument about 10 years ago in "Engels’ pause: Technical change, capital accumulation, and inequality in the British industrial revolution," published in Explorations in Economic History (2009, 46: pp. 418–435).

Allen summarizes his argument about the arrival and then the departure of the Engels' pause in this way: 
According to the Crafts-Harley estimates of British GDP, output per worker rose by 46% between 1780 and 1840. Over the same period, Feinstein’s real wage index rose by only 12%. It was only a slight exaggeration to say that the average real wage was constant, and it certainly rose much less than output per worker. This was the period, and the circumstances, described by Engels in The Condition of the Working Class. In the next 60 years, however, the situation changed. Between 1840 and 1900, output per worker increased by 90% and the real wage by 123%. This was the ‘modern’ pattern in which labour productivity and wages advance at roughly the same rate, and it emerged in
Britain around the time Engels wrote his famous book.
The key question is: why did the British economy go through this two phase trajectory of development? ... Between 1760 and 1800, the real wage grew slowly (0.39% per annum) but so did output per worker (0.26%), capital per worker, and total factor productivity (0.19%). Between 1800 and 1830, the famous inventions of the industrial revolution came on stream and raised aggregate TFP growth to 0.69% per year. This technology shock pushed up growth in output per worker to 0.63% pa but had little impact on capital accumulation or the real wage, which remained constant. This was the heart of Engels’ Pause ... In the next 30 years 1830–1860, TFP growth increased to almost one percent per annum, capital per worker began to grow, and the growth in output per worker
rose to 1.12% pa. The real wage finally began to grow (0.86% pa) but still lagged behind output per worker with most of the shortfall in the beginning of the period. From 1860 to 1900, productivity, capital per worker, and output per worker continued  to grow as they had in 1830–1860. In this period, the  real wage grew slightly faster than output per worker (1.61% pa versus 1.03%). The ‘modern’ pattern was established.
In short, technological growth first led to a period where wages did not keep up with economic growth, and then to a period where wages rose faster than economic growth. 
Of course, historical parallels are never perfect. The prominent inventions of the first half of the late 18th and early 19th century--mechanical spinning, coke smelting, iron puddling, the power loom, the railroad, and the application of steam power--did not have an identical interaction with labor markets and workers as the rise of modern technologies like information technology, materials science, genetics research, and others. 

In addition, historical parallels do not dictate what the appropriate policy response should be. 
As one example, the kinds of active labor market policies available to governments in the 21st century (for discussion, see here, here, and here) are quite different from the United Kingdom in the 19th century. The problems of modern middle-income workers in high-income countries are obviously not the same as the problems of UK workers in 1840. 

Also, modern economic historians argue over whether UK wages were really not rising much in the early 1900s, and current economist argue over the extent to which increases technology and variety suggest that the standard of living of typical modern workers is growing by more than their paychecks might suggest. 

But historical parallels are nonetheless interesting. But it's interesting that the original Engels' pause led to calls for socialism, and that socialism as a broad idea, if not necessarily a well-defined policy program, has re-entered the public discussion today. Historical parallels offer a reminder that when sustained shifts in an economy occur over several decades--a rise in inequality, wages rising more slowly than output, sustained high profit levels--the causes are more likely to involve shifts in economic output and organization driven by underlying factors like technology or demographics, not by factors like selfishness, conspiracies, or malevolence (whose prevalence does not shift as much, and are always with us). Finally, the theory of the Engels' pause suggests that underlying economic forces can drive patterns rising inequality, high profits, and stagnant wages can persist for decades, but nonetheless can have a momentum that leads to their eventual reversal, although my crystal ball is not telling me when or  how that will happen. 

Wednesday, September 11, 2019

Latin America: Missing Firms, Slow Growth, and Inequality

The economies of Latin America have gone through a series of different periods in the half-century or so. There was an "import substitution" period back in the 1960s and 1970s, where the idea was that government would direct industrial development in a way that would remove the need for imports from high-income countries. This was followed by the "lost decade" of the 1980s, a period of very high inflation, slow growth, and defaults on government debt. The 1990s was sometimes labeled as at time of economic liberalization or the so-called "Washington consensus." Starting around 2000, there was a "commodity supercycle" when first a global rise in commodity prices led to faster growth across much of Latin America, but then more recently a drop in commodity prices slowed down that growth.

Many pixels have been spent arguing over these changes. But as these different periods have come and gone, you know what hasn't much changed? The region of Latin America has been slowly falling farther behind the high-income countries countries of the world in economic terms, while remaining the region with the most unequal distribution of income. The McKinsey Global Institute lays out these patterns and offers some analysis in "Latin America’s missing middle: Rebooting inclusive growth" (May 2019).

Her's a figure showing per capita GDP in Latin America since 1960, relative to high income countries. Over that period, the region has been falling behind, not converging. Moreover, the middle income "benchmark" countries--which in this figure refers to a weighted average of to China, Indonesia, Malaysia, Philippines, Poland, Russia, South Africa, Thailand, and Turkey--has gone from less than one-third of the Latin American level to above it.

Inequality in the Latin American region has remained high as well throughout this time period. This figure shows that if you look at the share of income received by the bottom 50%, or by the bottom 90%, it's lower in Latin America than in any other region.
How can these dual problems of slow productivity growth and high levels of inequality be addressed? the MGI report argues that the underlying problem is a business climate in Latin America which appears to be strangling medium-sized and larger firms. As a result, a large share of the population is trapped in small, low-productivity, informal employment, with no prospect for change. The report notes:
The business landscape in Latin America is polarized. The region has some powerful companies, including some with very high productivity that have successfully expanded from their strong local base to become global companies or “multilatinas”—regional powerhouses operating across Latin America. They include AB InBev, America Movil, Arcor, Bimbo, CEMEX, Embraer, FEMSA, Techint Group, among others. By comparison with large firms in other regions, such companies are fewer in number and less diversified beyond energy, materials, and utilities. At the same time, Latin America has a long tail of small, often informal companies that collectively provide large-scale employment, but whose low productivity and stagnant growth hold back the economy.
Missing is a cohort of vibrant midsize companies that could bring dynamism and competitive pressure to expand the number of productive and well-paying jobs in Latin America, much as these firms do in many high-performing emerging regions. ...
The causes of this firm distribution and dynamics are rooted in common legacies of import substitution that favored a few private licenses or large state-run firms in many sectors. Other reasons are differing ways in which state companies were privatized and, especially in Brazil’s case, tax and compliance-heavy regulation that favors either large scale or informality. Unequal access to finance, weak infrastructure, and high input costs also squeeze the middle. The result is a weak level of innovation and specialization needed for future growth. ... Much of Latin America’s labor force is trapped in a long tail of small, unproductive, and
often informal firms ...
The MGI report suggests how a focus on digital technologies might help, making it "easier for companies to open businesses, register property, and file taxes over the internet, reducing the cost of red tape. Digital can facilitate more efficient markets from land and jobs to local services. Digital platforms make it possible for small and midsize companies to become `micromultinationals' able to compete with much larger competitors by offering their goods and services through online marketplaces regionally or globally."

That's not a bad suggestion, but my sense is that Latin America's failure to provide a business climate that fosters middle-sized and larger firms runs deeper.  For example, an earlier post on  "Mexico Misallocated" (January 24, 2019) describes how many government rules about companies and employment are based on the size of the firm. Taken together, these rules in combination have led to a bias in favor of new firms, but against the growth of existing firms. Moreover, the existing laws and regulations in Mexico have led to a common pattern of high-productivity firms exiting markets, while low-productivity firms enter them.

Throughout the world, the success stories of economic development have been led by the growth of private-sector firms of medium- and large-scale. The governments and people of Latin America need to think more deeply about public policy is hindering the growth of such firms.