Friday, November 29, 2019

Production, Use and Fate of All Plastics Ever Made

Back in 2005, the American Film Institute released a list of the 100 most memorable and lasting bits of film dialogue of all time. The first two, for example, were ""Frankly, my dear, I don't give a damn"
and "I'm gonna make him an offer he can't refuse." Number 41 on the list was "Plastics." from the 1967  film The Graduate, which won Oscars for Best Picture, Best Director, Best Actor (Dustin Hoffman) and Best Actress (Anne Bancroft).

In that movie, the dazed-and-confused soon-to-be college graduate Benjamin Braddock, played by Dustin Hoffman, is drifting through a dinner party full of his parents' friends. One of his father's well-meaning and clueless friends named Mr. Maguire, played by Walter Brooke, traps Benjamin into this conversation:
Mr. McGuire: I want to say one word to you. Just one word.
Benjamin: Yes, sir.
Mr. McGuire: Are you listening?
Benjamin: Yes, I am.
Mr. McGuire: Plastics.
Benjamin: Exactly how do you mean?
Mr. McGuire: There's a great future in plastics. Think about it. Will you think about it?
For those who are thinking about it, Roland Geyer, Jenna R. Jambeck, and Kara Lavender Law have written ""Production, use, and fate of all plastics ever made" (Science Advances, July 19, 2017,  3:7, e1700782). They write:
Although the first synthetic plastics, such as Bakelite, appeared in the early 20th century, widespread use of plastics outside of the military did not occur until after World War II. ... plastics’ largest market is packaging, an application whose growth was accelerated by a global shift from reusable to single-use containers. As a result, the share of plastics in municipal solid waste (by mass) increased from less than 1% in 1960 to more than 10% by 2005 in middle- and high-income countries. ... By identifying and synthesizing dispersed data on production, use, and end-of-life management of polymer resins, synthetic fibers, and additives, we present the first global analysis of all mass-produced plastics ever manufactured. 
They look at all the purposes for which plastic is used, and then the periods of time these products are in use, from short-term uses like packaging to long-term uses like construction. They write: 
Global production of resins and fibers increased from 2 Mt in 1950 to 380 Mt in 2015, a compound annual growth rate (CAGR) of 8.4% (table S1), roughly 2.5 times the CAGR [compound annual growth rate] of the global gross domestic product during that period. The total amount of resins and fibers manufactured from 1950 through 2015 is 7800 Mt. Half of this—3900 Mt—was produced in just the past 13 years. Today, China alone accounts for 28% of global resin and 68% of global PP&A [polyester, polyamide, and acrylic] fiber production ...  
We estimate that 2500 Mt of plastics—or 30% of all plastics ever produced—are currently in use. Between 1950 and 2015, cumulative waste generation of primary and secondary (recycled) plastic waste amounted to 6300 Mt. Of this, approximately 800 Mt (12%) of plastics have been incinerated and 600 Mt (9%) have been recycled, only 10% of which have been recycled more than once. Around 4900 Mt—60% of all plastics ever produced—were discarded and are accumulating in landfills or in the natural environment
Here's a figure showing some their estimates of plastic waste generation and disposal since 1950 and projected up through 2050. The calculations suggest that even with a substantial rise in incineration and recycling of plastic, the cumulative amount of plastic discarded will rise substantially in the next few decades,

As the authors note, we are essentially carrying out an uncontrolled global experiment on how plastic waste may affect the environment:
Plastic waste is now so ubiquitous in the environment that it has been suggested as a geological indicator of the proposed Anthropocene era ... None of the mass-produced plastics biodegrade in any meaningful way; however, sunlight weakens the materials, causing fragmentation into particles known to reach millimeters or micrometers in size. Research into the environmental impacts of these “microplastics” in marine and freshwater environments has accelerated in recent years, but little is known about the impacts of plastic waste in land-based ecosystems. ...
The growth of plastics production in the past 65 years has substantially outpaced any other manufactured material. The same properties that make plastics so versatile in innumerable applications—durability and resistance to degradation—make these materials difficult or impossible for nature to assimilate. Thus, without a well-designed and tailor-made management strategy for end-of-life plastics, humans are conducting a singular uncontrolled experiment on a global scale, in which billions of metric tons of material will accumulate across all major terrestrial and aquatic ecosystems on the planet. The relative advantages and disadvantages of dematerialization, substitution, reuse, material recycling, waste-to-energy, and conversion technologies must be carefully considered to design the best solutions to the environmental challenges posed by the enormous and sustained global growth in plastics production and use.

Thursday, November 28, 2019

Thanksgiving Origins: Sarah Josepha Hale Writes to Abraham Lincoln

Thanksgiving is a day for a traditional menu, and part of my holiday is to reprint this annual column on the origins of the day:

The first presidential proclamation of Thanksgiving as a national holiday was issued by George Washington on October 3, 1789. But it was a one-time event. Individual states (especially those in New England) continued to issue Thanksgiving proclamations on various days in the decades to come. But it wasn't until 1863 when a magazine editor named Sarah Josepha Hale, after 15 years of letter-writing, prompted Abraham Lincoln in 1863 to designate the last Thursday in November as a national holiday--a pattern which then continued into the future.

An original and thus hard-to-read version of George Washington's Thanksgiving proclamation can be viewed through the Library of Congress website. The economist in me was intrigued to notice that some of the causes for giving of thanks included "the means we have of acquiring and diffusing useful knowledge ... the encrease of science among them and us—and generally to grant unto all Mankind such a degree of temporal prosperity as he alone knows to be best."

Also, the original Thankgiving proclamation was not without some controversy and dissent in the House of Representatives, as an example of unwanted and inappropriate federal government interventionism. As reported by the Papers of George Washington website at the University of Virginia.
The House was not unanimous in its determination to give thanks. Aedanus Burke of South Carolina objected that he “did not like this mimicking of European customs, where they made a mere mockery of thanksgivings.” Thomas Tudor Tucker “thought the House had no business to interfere in a matter which did not concern them. Why should the President direct the people to do what, perhaps, they have no mind to do? They may not be inclined to return thanks for a Constitution until they have experienced that it promotes their safety and happiness. We do not yet know but they may have reason to be dissatisfied with the effects it has already produced; but whether this be so or not, it is a business with which Congress have nothing to do; it is a religious matter, and, as such, is proscribed to us. If a day of thanksgiving must take place, let it be done by the authority of the several States.”
Here's the transcript of George Washington's Thanksgiving proclamation from the National Archives.
Thanksgiving Proclamation
By the President of the United States of America. a Proclamation.
Whereas it is the duty of all Nations to acknowledge the providence of Almighty God, to obey his will, to be grateful for his benefits, and humbly to implore his protection and favor—and whereas both Houses of Congress have by their joint Committee requested me “to recommend to the People of the United States a day of public thanksgiving and prayer to be observed by acknowledging with grateful hearts the many signal favors of Almighty God especially by affording them an opportunity peaceably to establish a form of government for their safety and happiness.”
Now therefore I do recommend and assign Thursday the 26th day of November next to be devoted by the People of these States to the service of that great and glorious Being, who is the beneficent Author of all the good that was, that is, or that will be—That we may then all unite in rendering unto him our sincere and humble thanks—for his kind care and protection of the People of this Country previous to their becoming a Nation—for the signal and manifold mercies, and the favorable interpositions of his Providence which we experienced in the course and conclusion of the late war—for the great degree of tranquillity, union, and plenty, which we have since enjoyed—for the peaceable and rational manner, in which we have been enabled to establish constitutions of government for our safety and happiness, and particularly the national One now lately instituted—for the civil and religious liberty with which we are blessed; and the means we have of acquiring and diffusing useful knowledge; and in general for all the great and various favors which he hath been pleased to confer upon us.
and also that we may then unite in most humbly offering our prayers and supplications to the great Lord and Ruler of Nations and beseech him to pardon our national and other transgressions—to enable us all, whether in public or private stations, to perform our several and relative duties properly and punctually—to render our national government a blessing to all the people, by constantly being a Government of wise, just, and constitutional laws, discreetly and faithfully executed and obeyed—to protect and guide all Sovereigns and Nations (especially such as have shewn kindness unto us) and to bless them with good government, peace, and concord—To promote the knowledge and practice of true religion and virtue, and the encrease of science among them and us—and generally to grant unto all Mankind such a degree of temporal prosperity as he alone knows to be best.
Given under my hand at the City of New-York the third day of October in the year of our Lord 1789.
Go: Washington
Sarah Josepha Hale was editor of a magazine first called Ladies' Magazine and later called Ladies' Book from 1828 to 1877. It was among the most widely-known and influential magazines for women of its time. Hale wrote to Abraham Lincoln on September 28, 1863, suggesting that he set a national date for a Thankgiving holiday. From the Library of Congress, here's a PDF file of the Hale's actual letter to Lincoln, along with a typed transcript for 21st-century eyes. Here are a few sentences from Hale's letter to Lincoln:
"You may have observed that, for some years past, there has been an increasing interest felt in our land to have the Thanksgiving held on the same day, in all the States; it now needs National recognition and authoritive fixation, only, to become permanently, an American custom and institution. ... For the last fifteen years I have set forth this idea in the "Lady's Book", and placed the papers before the Governors of all the States and Territories -- also I have sent these to our Ministers abroad, and our Missionaries to the heathen -- and commanders in the Navy. From the recipients I have received, uniformly the most kind approval. ... But I find there are obstacles not possible to be overcome without legislative aid -- that each State should, by statute, make it obligatory on the Governor to appoint the last Thursday of November, annually, as Thanksgiving Day; -- or, as this way would require years to be realized, it has ocurred to me that a proclamation from the President of the United States would be the best, surest and most fitting method of National appointment. I have written to my friend, Hon. Wm. H. Seward, and requested him to confer with President Lincoln on this subject ..."
William Seward was Lincoln's Secretary of State. In a remarkable example of rapid government decision-making, Lincoln responded to Hale's September 28 letter by issuing a proclamation on October 3. It seems likely that Seward actually wrote the proclamation, and then Lincoln signed off. Here's the text of Lincoln's Thanksgiving proclamation, which characteristically mixed themes of thankfulness, mercy, and penitence:
Washington, D.C.
October 3, 1863
By the President of the United States of America.
A Proclamation.
The year that is drawing towards its close, has been filled with the blessings of fruitful fields and healthful skies. To these bounties, which are so constantly enjoyed that we are prone to forget the source from which they come, others have been added, which are of so extraordinary a nature, that they cannot fail to penetrate and soften even the heart which is habitually insensible to the ever watchful providence of Almighty God. In the midst of a civil war of unequaled magnitude and severity, which has sometimes seemed to foreign States to invite and to provoke their aggression, peace has been preserved with all nations, order has been maintained, the laws have been respected and obeyed, and harmony has prevailed everywhere except in the theatre of military conflict; while that theatre has been greatly contracted by the advancing armies and navies of the Union. Needful diversions of wealth and of strength from the fields of peaceful industry to the national defence, have not arrested the plough, the shuttle or the ship; the axe has enlarged the borders of our settlements, and the mines, as well of iron and coal as of the precious metals, have yielded even more abundantly than heretofore. Population has steadily increased, notwithstanding the waste that has been made in the camp, the siege and the battle-field; and the country, rejoicing in the consiousness of augmented strength and vigor, is permitted to expect continuance of years with large increase of freedom. No human counsel hath devised nor hath any mortal hand worked out these great things. They are the gracious gifts of the Most High God, who, while dealing with us in anger for our sins, hath nevertheless remembered mercy. It has seemed to me fit and proper that they should be solemnly, reverently and gratefully acknowledged as with one heart and one voice by the whole American People. I do therefore invite my fellow citizens in every part of the United States, and also those who are at sea and those who are sojourning in foreign lands, to set apart and observe the last Thursday of November next, as a day of Thanksgiving and Praise to our beneficent Father who dwelleth in the Heavens. And I recommend to them that while offering up the ascriptions justly due to Him for such singular deliverances and blessings, they do also, with humble penitence for our national perverseness and disobedience, commend to His tender care all those who have become widows, orphans, mourners or sufferers in the lamentable civil strife in which we are unavoidably engaged, and fervently implore the interposition of the Almighty Hand to heal the wounds of the nation and to restore it as soon as may be consistent with the Divine purposes to the full enjoyment of peace, harmony, tranquillity and Union.
In testimony whereof, I have hereunto set my hand and caused the Seal of the United States to be affixed.
Done at the City of Washington, this Third day of October, in the year of our Lord one thousand eight hundred and sixty-three, and of the Independence of the United States the Eighty-eighth.
By the President: Abraham Lincoln
William H. Seward,
Secretary of State

The Dominance of Peoria in the Processed Pumpkin Market

As I prepare for a season of pumpkin pie, pumpkin bread (made with cornmeal and pecans), pumpkin soup (especially nice wish a decent champagne) and perhaps a pumpkin ice cream pie (graham cracker crust, of course),  I have been mulling over why the area around Peoria, Illinois, so dominates the production of processed pumpkin.

[In honor of pumpkin pie, I'm repeating this blog published in 2017.]

The facts are clear enough. As the US Department of Agriculture points out (citations omitted):
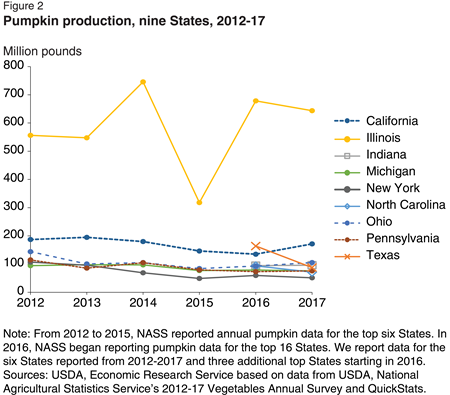
In 2016, farmers in the top 16 pumpkin-producing States harvested 1.1 billion pounds of pumpkins, implying about 1.4 billion pounds harvested altogether in the United States. Production increased 45 percent from 2015 largely due to a rebound in Illinois production. Illinois production, though highly variable, is six times the average of the other top eight pumpkin-producing States (Figure 2).
Production increased 45 percent from 2015 largely due to a rebound in Illinois production. Illinois production, though highly variable, is six times the average of the other top eight pumpkin-producing States.

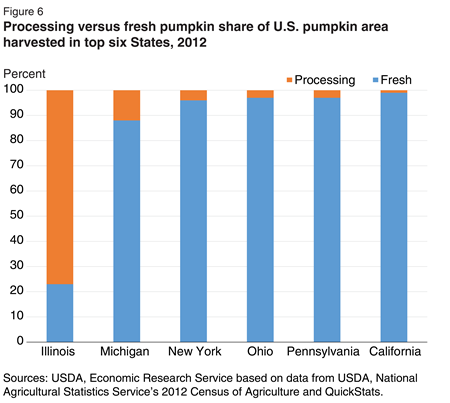
Not only does Illinois produce more pumpkins, but a much larger share of pumpkins from this state end up being processed, rather than used fresh. The USDA reports:
Illinois harvests the largest share of processing pumpkin acres among all States—almost 80 percent. Michigan is next with a little over 10 percent. Other States harvest less than 5 percent processing pumpkins.

It's not really the entire state of Illinois, either, but mainly an area right around Peoria. The University of Illinois extension service writes: "Eighty percent of all the pumpkins produced commercially in the
U.S. are produced within a 90-mile radius of Peoria, Illinois. Most of those pumpkins are grown for processing into canned pumpkins. Ninety-five percent of the pumpkins processed in the United States are grown in Illinois. Morton, Illinois just 10 miles southeast of Peoria calls itself the `Pumpkin Capital of the World.'"

Why does this area have such dominance? Weather and soil are part of the advantage, but it seems unlikely that the area around Peoria is dramatically distinctive for those reasons alone. This also seems to be a case where an area got a head-start in a certain industry, established economies of scale and expertise, and has thus continued to keep a lead. The Illinois Farm Bureau writes: "Illinois earns the top rank for several reasons. Pumpkins grow well in its climate and in certain soil types. And in the 1920s, a pumpkin processing industry was established in Illinois, Babadoost [a professor at the University of Illinois] says. Decades of experience and dedicated research help Illinois maintain its edge in pumpkin production." According to one report, Libby’s Pumpkin is "the supplier of more than 85 percent of the world’s canned pumpkin."

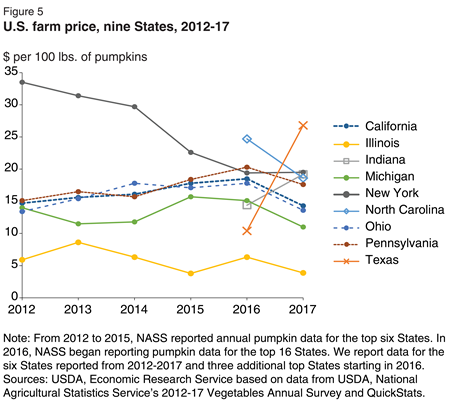
The farm price of pumpkins varies considerably across states, which suggests that it is costly to ship substantial quantities of pumpkin across moderate distances. For example, the price of pumpkins is lowest in Illinois, where supply is highest, and the Illinois price is consistently below the price for other nearby Midwestern states. This pattern suggests that the processing plants for pumpkins are most cost-effective when located near the actual production.

While all States see year-to-year changes in price, New York stands out because prices have declined every year since 2011. Illinois growers consistently receive the lowest price because the majority of their pumpkins are sold for processing.

Finally, although my knowledge of recipes for pumpkin is considerably more extensive than my knowledge of supply chain for processed pumpkin, it seems plausible that pumpkin is neither the most lucrative of farm products, nor is demand for pumpkin it growing quickly, so it hasn't been worthwhile for potential competitors in the processed pumpkin market to try to establish an alternative pumpkin-producing hub somewhere else.

An Economist Chews Over Thanksgiving

As Thanksgiving preparations arrive, I naturally find my thoughts veering to the evolution of demand for turkey, technological change in turkey production, market concentration in the turkey industry, and price indexes for a classic Thanksgiving dinner. Not that there's anything wrong with that. [This is an updated, amended, elongated, and cobbled-together version of a post that was first published on Thanksgiving Day 2011.]

The last time the U.S. Department of Agriculture did a detailed "Overview of the U.S. Turkey Industry" appears to be back in 2007, although an update was published in April 2014  Some themes about the turkey market waddle out from those reports on both the demand and supply sides.

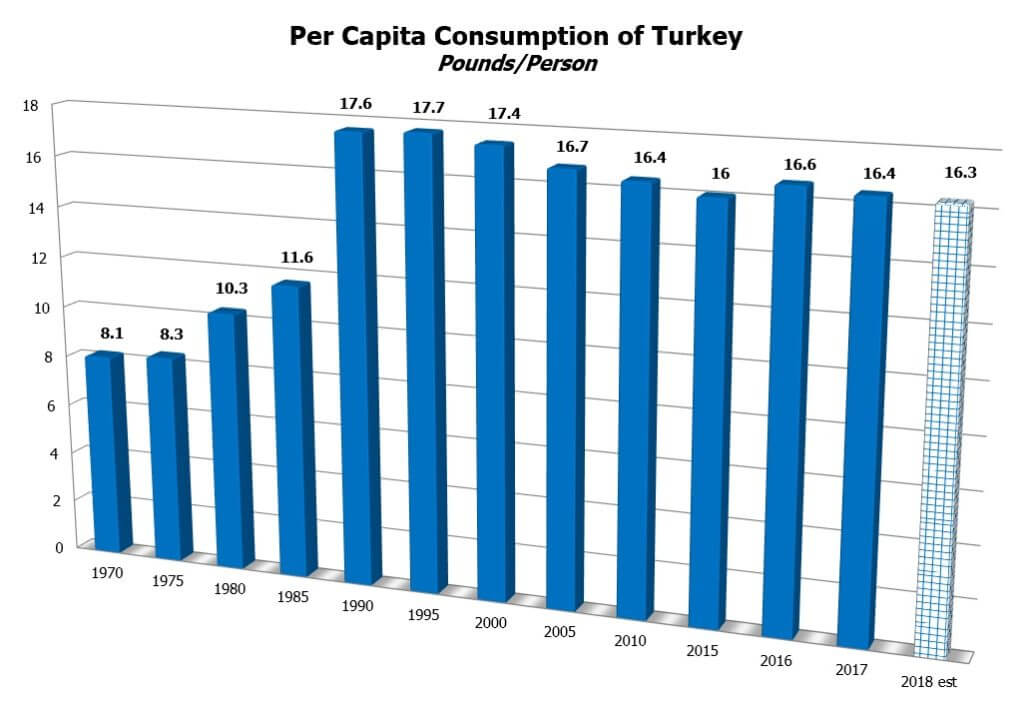
On the demand side, the quantity of turkey per person consumed rose dramatically from the mid-1970s up to about 1990, but then declined somewhat, but appears to have made a modest recovery in the last few years The figure below is from the Eatturkey.com website run by the National Turkey Federation.


On the production side, the National Turkey Federation explains: "Turkey companies are vertically integrated, meaning they control or contract for all phases of production and processing - from breeding through delivery to retail." However, production of turkeys has shifted substantially, away from a model in which turkeys were hatched and raised all in one place, and toward a model in which the steps of turkey production have become separated and specialized--with some of these steps happening at much larger scale. The result has been an efficiency gain in the production of turkeys. Here is some commentary from the 2007 USDA report, with references to charts omitted for readability:
"In 1975, there were 180 turkey hatcheries in the United States compared with 55 operations in 2007, or 31 percent of the 1975 hatcheries. Incubator capacity in 1975 was 41.9 million eggs, compared with 38.7 million eggs in 2007. Hatchery intensity increased from an average 33 thousand egg capacity per hatchery in 1975 to 704 thousand egg capacity per hatchery in 2007.
Some decades ago, turkeys were historically hatched and raised on the same operation and either slaughtered on or close to where they were raised. Historically, operations owned the parent stock of the turkeys they raised while supplying their own eggs. The increase in technology and mastery of turkey breeding has led to highly specialized operations. Each production process of the turkey industry is now mainly represented by various specialized operations.
Eggs are produced at laying facilities, some of which have had the same genetic turkey breed for more than a century. Eggs are immediately shipped to hatcheries and set in incubators. Once the poults are hatched, they are then typically shipped to a brooder barn. As poults mature, they are moved to growout facilities until they reach slaughter weight. Some operations use the same building for the entire growout process of turkeys. Once the turkeys reach slaughter weight, they are shipped to slaughter facilities and processed for meat products or sold as whole birds.
Turkeys have been carefully bred to become the efficient meat producers they are today. In 1986, a turkey weighed an average of 20.0 pounds. This average has increased to 28.2 pounds per bird in 2006. The increase in bird weight reflects an efficiency gain for growers of about 41 percent."
The 2014 report points out that the capacity of eggs per hatchery has continued to rise (again, references to charts omitted):
"For several decades, the number of turkey hatcheries has declined steadily. During the last six years, however, this decrease began to slow down. As of 2013, there are 54 turkey hatcheries in the United States, down from 58 in 2008, but up from the historical low of 49 reached in 2012. The total capacity of these facilities remained steady during this period at approximately 39.4 million eggs. The average capacity per hatchery reached a record high in 2012. During 2013, average capacity per hatchery was 730 thousand (data records are available from 1965 to present)."
U.S. agriculture is full of examples of remarkable increases in yields over perionds of a few decades, but they always drop my jaw. I tend to think of a "turkey" as a product that doesn't have a lot of opportunity for technological development, but clearly I'm wrong. Here's a graph showing the rise in size of turkeys over time from the 2007 report.


The production of turkey remains an industry that is not very concentrated, with three relatively large producers and then more than a dozen mid-sized producers. Here's a list of top turkey producers in 2017  from the National Turkey Federation, as measured by millions of pounds of liveweight processed.


Given this reasonably competitive environment, it's interesting to note that the price markups for turkey--that is, the margin between the wholesale and the retail price--have in the past tended to decline around Thanksgiving, which obviously helps to keep the price lower for consumers. However, this pattern may be weakening over time, as margins have been higher in the last couple of Thanksgivings  Kim Ha of the US Department of Agriculture spells this out in the "Livestock, Dairy, and Poultry Outlook" report of November 2018. The vertical lines in the figure show Thanksgiving. She writes: "In the past, Thanksgiving holiday season retail turkey prices were commonly near annual low points, while wholesale prices rose. ... The data indicate that the past Thanksgiving season relationship between retail and wholesale turkey prices may be lessening."

In the past, the US turkey industry has at some times suffers from outbreaks of HPAI
(Highly Pathogenic Avian Influenza): for discussion of the 2015 outbreak, see the November 17, 2015 issue of the "Livestock, Dairy, and Poultry Outlook" from the US Department of Agriculture, where Kenneth Mathews and Mildred Haley offer some details. But for Thanksgiving 2019, supply seems to have remained strong and wholesale turkey prices have stayed low.

For some reason, this entire post is reminding me of the old line that if you want to have free-flowing and cordial conversation at dinner party, never seat two economists beside each other. Did I mention that I make an excellent chestnut stuffing?

Anyway, the starting point for measuring inflation is to define a relevant "basket" or group of goods, and then to track how the price of this basket of goods changes over time. When the Bureau of Labor Statistics measures the Consumer Price Index, the basket of goods is defined as what a typical U.S. household buys. But one can also define a more specific basket of goods if desired, and since 1986, the American Farm Bureau Federation has been using more than 100 shoppers in states across the country to estimate the cost of purchasing a Thanksgiving dinner. The basket of goods for their Classic Thanksgiving Dinner Price Index looks like this:

The cost of buying the Classic Thanksgiving Dinner was essentially unchanged from 2018 to 2019, rising by a penny from $48.90 in 2018 to $48.91 in 2019. The top line of the graph that follows shows the nominal price of purchasing the basket of goods for the Classic Thanksgiving Dinner. The lower line on the graph shows the price of the Classic Thanksgiving Dinner adjusted for the overall inflation rate in the economy. The lower line is relatively flat, which means that inflation in the Classic Thanksgiving Dinner has actually been a pretty good measure of the overall inflation rate.


Thanksgiving is a distinctively American holiday, and it's my favorite. Good food, good company, no presents--and all these good topics for conversation. What's not to like?

Tuesday, November 26, 2019

Advice on Writing from Amitabh Chandra, Editor of the Review of Economics and Statistics

The academic economics journal where I work as Managing Editor, the Journal of Economic Perspectives, is not intended as a destination for someone's latest research paper. Instead,  we ask authors to write an essay about an economic question which draws both on their own research and the work of others. We emphasize verbal explanations about the intuition underlying an argument. JEP articles are thus different in tone and focus from standard economics research journals.

Thus, it's interesting to me that the advice to authors from the editor of a top research journal, the Review of Economics and Statistics, is in some ways quite similar to the advice I would give.  David Slusky presents "An Interview with Amitabh Chandra, Editor of the Review of Economics and Statistics," in the Newsletter of American Society of Health Economists (2019: 4).  Here are a couple of samples:
What surprised you the most about being an editor of a major general interest economics journal?
I never thought that the single best predictor of getting a paper accepted, would be clear and accessible writing, including an explanation of where the paper breaks down, instead of putting the onus of this discovery on the reader.
It’s my sense that a paper where the reviewer has to figure out what the author did, will not get accepted. Reviewers are happy to suggest improvements, provided they understand what is happening and that makes them appreciate clear writing and explaining. They become grumpy and unreasonable when they believe that the author is making them work extra to understand a paper and most aren’t willing to help such an author. They may not say all this in their review, but they do share these frustrations in the letter to the editor. This is one reason that I encouraged a move towards 60-70% desk-rejections at RESTAT—if an editor can spot obvious problems with clarity or identification within 15 minutes, then why send it out for review?
Of course, all of this results in the unfortunate view that “this accepted paper is so simple, but my substantially more complicated paper is much better,” when the reality is that simplicity and clarity are heavily rewarded. We don’t teach good writing in economics—and routinely confuse LaTeX equations with good writing—but as my little rant highlights, we actually value better-writing. So this is something to work on.
Related, most reviewers want short papers (so do editors). The world has also changed, and economics is more empirical, so adding a 3-5 page “theory section” that produces uncertain comparative-statics is a waste of three pages, that has also annoyed and tired the reader. Theory is great if it can clear up clutter. But if it can’t, or worse, if it adds to clutter, then this is not being empathic about a reader’s needs. ...
What do you wish more authors did before submission?
What a great question: authors of empirical papers should do two related things. First, make sure that their abstracts are jargon free and literature free. So never include something like “Chandra and Slusky (2020)…” in an abstract for the makes the paper seem narrow and unimportant, even when it’s broad and important.
Second, make sure that the introduction of the paper clearly summarizes the question, intuition for the answer, the approach, and the findings in a way that a first-year graduate student in economics would understand. Don’t put a giant literature review into the introduction and put your reader to sleep during the first 5 minutes that you have their attention. Do not think that accessibility is a bad thing. Do not assume that math is a good thing.
Homage: I found this interview via Tyler Cowen at the always-absorbing Marginal Revolution website.

Monday, November 25, 2019

Workplace Wellness Policies: Disappointing Evidence

The idea behind workplace wellness policies is straightforward. Many workers could use a nudge toward adopting healthier lives, including diet and exercise. Employer are paying for health insurance anyway, and also experiencing costs of lower productivity and sick days for their employees. If a workplace wellness program can improve health, it could be a win for both workers and employers. However, a couple of recent studies from this year suggest that such programs don't pay off.

One study was published by Damon Jones, David Molitor, and Julian Reif, "What Do Workplace Wellness Programs Do? Evidence from the Illinois Workplace Wellness Study," in the Quarterly Journal of Economics (November 2019, 134:4, pp. 1747-1791). As background, they write (citations omitted):
The 2010 Affordable Care Act (ACA) encourages firms to adopt wellness programs by letting them offer participation incentives up to 30% of the total cost of health insurance coverage, and 18 states currently include some form of wellness incentives as a part of their Medicaid program. Workplace wellness industry revenue has more than tripled in size to $8 billion since 2010, and wellness programs now cover over 50 million U.S. workers.
This study was carried out among employees at the University of Illinois at Urbana-Champaign campus. Here's a capsule description of the process:
We developed a comprehensive workplace wellness program, iThrive, which ran for two years and included three main components: an annual on-site biometric health screening, an annual online health risk assessment (HRA), and weekly wellness activities. We invited 12,459 benefits-eligible university employees to participate in our study and successfully recruited 4,834 participants, 3,300 of whom were assigned to the treatment group and were invited to take paid time off to participate in the wellness program.3 The remaining 1,534 subjects were assigned to a control group, which was not permitted to participate. Those in the treatment group who successfully completed the entire two-year program earned rewards ranging from $50 to $650, with the amounts randomly assigned and communicated at the start of each program year.
The researchers had access to lots of background information as well, because they could look at past employment records and health care spending for those who wanted to participate They write:
From our analysis, we find evidence of significant advantageous selection into our program based on medical spending and health behaviors. At baseline, average annual medical spending among participants was $1,384 less than among nonparticipants. This estimate is statistically (p = .027) and economically significant: all else equal, it implies that increasing the share of participating (low-spending) workers employed at the university by 4.3 percentage points or more would offset the entire costs of our intervention. Participants were also more likely to have visited campus recreational facilities and to have participated in running events prior to our study. We find evidence of adverse selection when examining productivity: at baseline, participants were more likely to have taken sick leave and were less likely to have worked more than 50 hours a week than were nonparticipants.
The results? Disappointing.
Despite strong program participation, we do not find significant effects of our intervention on 40 out of the 42 outcomes we examine in the first year following random assignment. These 40 outcomes include all our measures of medical spending, productivity, health behaviors, and self-reported health. We fail to find significant treatment effects on average medical spending, on different quantiles of the spending distribution, or on any major subcategory of medical utilization (pharmaceutical drugs, office, or hospital). We find no effects on productivity, whether measured using administrative variables (sick leave, salary, promotion), survey variables (hours worked, job satisfaction, job search), or an index that combines all available measures. We also do not find effects on visits to campus gym facilities or on participation in a popular annual community running event, two health behaviors a motivated employee might change within one year. These null effects persist when we estimate longer-run effects of the two-year intervention using outcomes measured up to 30 months after the initial randomization. ...

Our intervention had two positive treatment effects in the first year, based on responses to follow-up surveys. First, employees in the treatment group were more likely than those in the control group to report ever receiving a health screening. This result indicates that the health screening component of our program did not merely crowd out health screenings that would have otherwise occurred without our intervention. Second, treatment group employees were more likely to report that management prioritizes worker health and safety, although this effect disappears after the first year.
As another example, Zirui Song and Katherine Baicker published "Effect of a Workplace Wellness Program on Employee Health and Economic Outcomes; A Randomized Clinical Trial" in the Journal of the American Medical Association (April 16, 2019, 321:15, pp. 1491-1501). The study involved "32, 974 employees at a large US warehouse retail company." Over 160 separate locations for this company, 20 were randomly selected to receive a workplace wellness program. "The program comprised 8 modules focused on nutrition, physical activity, stress reduction, and related topics implemented by registered dietitians at the treatment worksites. ... Self-reported health and behaviors via surveys (29 outcomes) and clinical measures of health via screenings (10 outcomes) were compared among 20 intervention and 20 primary control sites; health care spending and utilization (38 outcomes) and employment outcomes (3 outcomes) from administrative data were compared among 20 intervention and 140 control sites."

The results? Again, disappointing.
After 18 months, the rates for 2 self-reported outcomes were higher in the intervention group than in the control group: for engaging in regular exercise (69.8% vs 61.9% ...) and for actively managing weight (69.2% vs 54.7% ...). The program had no significant effects on other prespecified outcomes: 27 self-reported health outcomes and behaviors (including self-reported health, sleep quality, and food choices), 10 clinical markers of health (including cholesterol, blood pressure, and body mass index), 38 medical and pharmaceutical spending and utilization measures, and 3 employment outcomes (absenteeism, job tenure, and job performance). ... [T]here were no significant differences in clinical measures of health, health care spending and utilization, and employment outcomes after 18 months. Although limited by incomplete data on some outcomes, these findings may temper expectations about the financial return on investment that wellness programs can deliver in the short term.

A couple of takeaways here. First, both of these studies were done with randomized methods (albeit the randomization was of a different kind across the two studies). No social science methodology is flawless, but this is a highly respected approach; indeed, applying randomized experimental methods to issues in development economics won the most recent Nobel prize in economics. In other words, these similarly disappointing results from two different datasets deserve some weight in your thinking on this subject.

Second, the results are perhaps not surprising upon due consideration. People's habits about exercise and diet are deeply rooted. Many people say that they would like to change their patterns, or would like to have changed their patterns in the past. But it's hard to do so. Workplace wellness policies, at least as they exist at many locations, apparently don't offer enough of a shock to change people's behavior. 

Friday, November 22, 2019

The Return of the Patent Thicket

Back in the early 1970s, Xerox had figured out a strategy to block competitors in the photocopying business. It took out lots of patents, more than 1,000 of them, on every aspect of the photocopy machine. As old patents expired, new ones kicked in at a rate of several hundred new patents each year. Some of the patents were actually used by Xerox in producing the photocopy machine; some were not. There was no serious complaint about the validity of any individual patent. But taken as a whole, Xerox seemed to be using the patent system to lock up its monopoly position in perpetuity.  Under antitrust pressure from the Federal Trade Commission, Xerox in 1975 signed a consent decree which, along with a number of other steps, required  licensing its 1,700 photocopier patents to other firms.  (Here's a later retrospective on the case, including some of the other issues, the 1975 FTC consent decree, and what happened with follow-up litigation.)

The long-ago Xerox strategy for blocking competition has become known as the "patent thicket." Any patent blocks competition for a time, of course; the whole idea of a patent it to reward inventors with a temporary monopoly. But patent thicket arises when one or a few companies have a large cluster of closely related patents, which are continually expiring and being replaced in overlapping ways. Big companies cut deals with each other, so that they have access to each other's patents. Small But smaller entrepreneurs are shut out.

Ufuk Akcigit and Sina T. Ates offer some exploratory evidence that a modern version of the patent thicket may be at the root of some interlocking problems of the US economy in "What Happened to U.S. Business Dynamism?" (University of Chicago Becker Friedman Institute, working paper 2019-56, April 2019).

As a starting point, they show that the share of patents going to the top 1% of firm ranked by how many patents they already have is rising: "While in the early 1980s about 35 percent of patents were registered by the top 1 percent of firms sitting on the largest patent stocks, this ratio reached almost 50 percent in three decades.In addition, the share of patents registered by new entrants (firms that patent for the first time) exhibits the opposite trend: Notwithstanding the small pickup in the early 1980s, there has been a dramatic secular decline in the entrants’ share since then, with the ratio falling more than 50 percent in 25 years..."
Next, look at who is buying and selling patents. They find "that while 30 percent of the transacted patents were reassigned to the firms with the largest patent stocks in the 1980s, the share went up to 55 percent by 2010. This drastic increase has crowded out small players in the market ... In the past two decades, the fraction of transacted patents that are reassigned to small firms has dropped dramatically from 75 percent to almost 50 percent, implying a shift of ownership from the hands of small firms to large ones." (For a discussion of how batches of patents are bought and sold, see Andrei Hagiu and David B. Yoffie. 2013. "The New Patent Intermediaries: Platforms, Defensive Aggregators, and Super-Aggregators." Journal of Economic Perspectives, 27 (1): 45-66.)
Is there some additional evidence to suggest that this greater concentration of patents among firms that already have the greatest share of patents is being used strategically to block competition, in true "patent thicket" style? They write:
In this part, we investigate whether firms produce strategic patents, which help the firm build thickets around its core business to ensure that technologies are not easily copied and challenged by others. ... If a firm’s aim is mostly protecting its core technology, the new internal patent will cite many patents from the firm’s existing portfolio. In contrast, if a firm’s aim is expanding into new fields, more citations will be made in that case to patents that are not in the firm’s portfolio. In this regard, the fraction of self-citations is informative about how internal a patent is and how likely it is that a patent serves to build a thicket. ... The striking observation is that while until 2000 patents were becoming more explorative in nature based on our earlier interpretation, this trend reverses completely around 2000, and patents become more exploitative and internal since then.

The main focus of the Akcigit and Ates paper is to present an economic model suggesting that many of the problems of the US economy can be explained by a fall in the diffusion of knowledge across firms--which is what one would expect if firms that already have the largest share of patents are steadily increasing their share. They write:
With knowledge diffusion slowing down, the direct effect is that market leaders are protected from being imitated. As a result, the technology gaps start widening, presenting market leaders a stronger market power. Market concentration and markups rise on average. Profit share of GDP increases, and labor share decreases. Larger gaps also discourage the followers, causing the productivity gap between them and the leaders to open up. The strengthening of leaders also discourages forward-looking entrants; hence, firm entry and the employment share of young firms go down. Discouraged followers and entrants exert smaller competitive pressure on market leaders; as a result, market leaders relax, and they experiment less. Hence, overall dynamism and experimentation decrease in the economy. To sum up, our quantitative investigation in this section underscores the importance of potential distortions in knowledge diffusion in explaining the declining U.S. business dynamism.
Of course, the fact that you can build a model which produces these results doesn't prove the model is the best or only explanation. And while the patent evidence is suggestive, it doesn't prove that a resurgence of patent thickets are the best or only explanation of a reduction in the diffusion of knowledge across the economy, either. But

I've written from time to time about other pieces of evidence along these lines, like this study from the OECD which argues that the gap between market leaders and other firms is rising around the world; or this study from the US Bureau of Labor Statistics about how the productivity gap between firms is rising in US industries; or this description of how US antitrust authorities used to much more commonly order compulsory licensing of patents to improve competition; or this essay about how the greater separation between market-leading firms and the rest across many industries is driving inequality of wages. Thinking about how to facilitate a faster and broader dispersion of knowledge and productivity gains seems like a potentially important part of explaining the current economic picture and suggesting a policy agenda.

Thursday, November 21, 2019

Why Has China's Trade Surplus (Just About) Gone Away?

China's trade surpluses exploded in size after 2001, when China joined the World Trade Organization and its exports soared. But those trade surpluses peaked back before the Great Recession and have dwindled since then to near-zero. Indeed, the IMF predicts that China is likely to have small trade deficits in the next few years. What happened? Pragyan Deb, Albe Gjonbalaj, and Swarnali A.  Hannan tell the story in "The Drivers, Implications and Outlook for China’s Shrinking Current Account Surplus" (IMF Working Paper WP/19/244, November 8, 2019).

As a starting point, here's a graph showing China's overall trade balance (the "current account" line) falling to zero. The green line shows China's trade balance in services. The blue line shows China's trade balance in goods.
Clearly, one big change is that China has started running a trade deficit in services (an area where the US economy runs a trade surplus). The main reason seems to be a large increase in outbound Chinese tourism, because in trade statistics, international tourists are in effect "importing" goods produced in other countries. The IMF economists write: "China’s tourism balance, mostly on account of outbound tourism, has swung from a small surplus of around 5bn USD in 2008 to a deficit of nearly 250bn USD in 2018, driven by the increasing purchasing power of the middle class and an appreciating currency. ... [T]he trend is undeniable. It is also borne out by an almost fourfold increase in the number of Chinese outbound visitors – from 46mn in 2008 to 162mn in 2018."

China's trade surplus in goods has also dropped substantially, especially from about 2007-2010, and has plateaued since then. Several major changes are behind this shift. One is that after China's dramatic expansion of exports, there wasn't a lot of room for additional increases. As the IMF economists put it,
In 2001, when China joined the WTO, the share of Chinese exports to total world exports was around 4 percent. This more than tripled to 13 percent in 2017. In the case of manufacturing, the corresponding figures are 5 and 17 percent respectively ...  China is now the largest goods exporter in the world and its share of world exports declined in 2016 and 2017. ... [D]ividends from joining the World Trade Organization in 2001 have diminished and China already occupies a dominant position in many markets. ... 
Another shift is "rebalancing," which refers to China's gradual move toward being an economy that produces more for domestic consumption and relies less on exports.  In thinking about this shift, it's useful to flash back to China's extraordinary surge of exports after 2001 and up to about 2007. In a flexible economy, this dramatic rise in export sales should have also led to equally dramatic rise in incomes--and thus to rise in consumption. But while China's wages did rise substantially during this time, it wasn't nearly enough to keep up with the export boom. Thus, China's export surge turned into a surge of national saving as well. This figure shows how China's national savings rate went from an extraordinarily high 35% of GDP back in 2000 to an unbelievably high level of more than 50% of GDP at the peak of the export surge around 2007.


However, China's savings rate has now come back down to merely extraordinary levels again. More specifically, the rates of corporate and government saving in China are close to world averages, but China's rate of household saving remains quite high. A common reason given is demography: China is still trying to build up its pension  and social security system, and after four decades of the one-child policy, people don't have enough children to rely on them for old-age support, either. Thus, people saved at very high rates. But as China ages, and older people begin to spend rather than save, the household savings rate should drop, too.

Instead of producing to sell abroad, the share of China's output that is being consumed in China is rising, as the pie charts show. The graph below that focuses on imports of "intermediate" products, which are then used in a production process. Back at the peak of China's trade surpluses around 2007, 43% of China's intermediate imports were being used for products that would be re-exported out of China; now, that share is down to about 30% as a greater share imports of intermediate goods are being used to produce goods consumed inside China.

The IMF economists make the point that looking forward, a common pattern is that a country's imports often grow more-or-less in line with the growth of the domestic economy, while a country's exports often grow more-or-less in line with the growth of the economies of trading partners. If one assumes that even with a modest slowdown in China's growth rate, it will continue to grow faster than the world average, then China's imports in the future are likely to grow faster than its exports.

Finally, one last part of the overall trade picture is called the "income balance," which looks at how much the economy of a country is receiving from its financial investments abroad, and hos much the economy is paying foreign investors for their investments within the country. With China's very large surpluses, it built up very large investments in foreign financial assets. However, it turns out that China's economy earns relatively little from those holdings of foreign assets, because a large share is invested in financial assets like US Treasury bonds that are paying a very low rate of return. Meanwhile, foreign investors in China  are much more likely to own a chunk of a Chinese company or Chinese real estate, and thus have been receiving a much higher rate of return. Thus, even though China holds much more in foreign assets than foreign investors hold in Chinese assets, China's "income balance" is negative. The IMF economists write:
Despite sizeable foreign assets, China’s income account remains in deficit. This is because less than 30 percent of China’s external assets consist of higher yielding risky assets such as direct and equity portfolio investment. Most assets comprise of lower-yielding investments such as international reserve assets, trade credit, and foreign currency deposits. In contrast, 70 percent of China’s external liabilities comprise of riskier and therefore higher (expected) return instruments such as direct and portfolio equity investments.
Putting all these factors together and projecting China's trade balance in the future, the IMF economists write:
Going forward, the [China's] small current account surplus recorded in 2018 is expected to turn into a small deficit in the medium term as the structural factors outlined above continue to drive up imports and moderate exports.
China's shift to a trade balance of zero, or a small deficit, will cause a different set of echoes and consequences in the global economy. For example, there has been talk for some years now of a "global savings glut," driven in substantial part by the very high savings rates in China. n the last 20 years or so, this global savings glut from China is one reason that the US government has been able to sell its Treasury bonds at such a low rate of interest was because of how the global savings glut kept buying those bonds. The global saving glut is often given as a main reason why interest rates around the world are so low. But China's contribution to the global savings glut has been fading away.

Wednesday, November 20, 2019

Enhancing Federal Tax Collections by $100 Billion Annually

Maybe instead of arguing over whether or how much to raise tax rates on those with high incomes, we could start by making more of an effort to enforce the actual existing tax laws? Natasha Sarin and Lawrence H. Summers explore what's possible in  "Shrinking the Tax Gap: Approaches and Revenue Potential" (Tax Notes, November 18, 2019).

In the lingo, the "tax gap" is the amount of tax that is owed under existing law, but that for one reason or another goes uncollected. Sarin and Summer estimate that "in 2020 the IRS will fail to collect more than $630 billion, or nearly 15 percent of total tax liabilities. ... Our estimates suggest that it’s reasonable to anticipate that with feasible changes in policy, the IRS could aspire to shrink the tax gap by around 15 percent."

Moreover, this extra tax revenue would come mainly from those with high incomes, in part because that's where much of the underreported income is, and in part because Sarin and Summers would focus their additional enforcement on those with higher incomes.

Sarin and Summers point out that IRS enforcement efforts have been declining. "[T]oday the IRS has fewer auditors than it had at any point since World War II. ... [S]ince 2011 the share of returns audited (across all filing categories) fell by 45 percent, and the additional taxes collected from audits fell by nearly 50 percent. The same is true for audits of high-income individual returns ... Audit rates for individuals making $1 million or more annually peaked in 2011 at 12.5 percent. Since then, they have fallen: In 2018 only 3.2 percent of returns of these high-income individuals were audited. Consequently, the additional revenue generated from examination of millionaires’ individual income tax filings declined by a similar amount (70 percent) over that period. These patterns suggest that it is unlikely that there would be diminishing returns to a substantial increase in IRS examination resources."

They suggest returning to the audit rates that were common all the way back in  2011, with a particular focus on those with more than $1 million in annual income and on corporations. The fact that the decline in audits has been tracked pretty much 1:1 with a corresponding fall in the taxes collected from audits strongly suggests that more audit would be matched with as similar rise in taxes collected. 

Sarin and Summers note that the IRS not only underinvests in human auditors, but also in technology. "Indeed, in 2018 the IRS spent only $2.5 billion on IT investments. By comparison, Bank of America spent around $16 billion but serves only a quarter of Americans. ... By the end of 2017, nearly 60 percent of IRS hardware was past its useable life, and 26 percent of software was two or more releases behind the most up-to-date version. According to the GAO, the IRS Individual Master File and Business Master File systems date back to 1960 and are the two oldest IT systems in the federal government. The national taxpayer advocate has warned that outdated technology is a threat to the stability of the tax system: `By analogy, the IRS has erected a 50-story office building on top of a creaky, 60-year-old foundation, and it is adding a few more floors each year. There are inherent limitations on the functionality of a 60-year-old infrastructure, and at some point, the entire edifice is likely to collapse.”

They write: "Extrapolating from the CBO and Treasury data suggest that $1 of investment in the IRS leads to $11 of additional revenue ..." In other words, their proposed increase in IRS enforcement spending of about $10 billion per year would plausibly bring in about $100 billion per year.  As Sarin and Summers readily admit, their calculations about increase revenue should be regarded as rough and back-of-the-envelope approximations. But the totals also seem to me well within the plausible range. And again, this additional revenue isn't from changing any part of the US tax code, but just from enforcement of what is already written into law.

Tuesday, November 19, 2019

interview with Cass Sunstein: On Abrupt and Unpredictable Social Change

Consider some examples of social movements that led to rapid change: the French Revolution, Russian revolution/ collapse of Soviet Union, the Iranian revolution, the civil rights movements of the 1960s, the rise of environmentalist movement in the 1960s, Brexit, #MeToo, gay marriage, and others.  Robert Wiblin and Keiran Harris at the "80,000 Hours" website have a podcast interview: "Prof. Cass Sunstein on how social change happens, and why it’s so often abrupt & unpredictable" (June 17, 2019). A transcript is also available. 

Sunstein develops a theory based on "preference falsification, diverse thresholds and interdependencies." The basic notion is that many people might disagree with the status quo and be willing to change from the status quo, but they aren't willing to come out in public and say so ("preference falsification"). However, some people are willing to speak up if a few other people do so, and others are willing to speak up if many other people do so ("diverse thresholds"). Thus, a situation may arise where a few people speak up, which leads to others speaking up ("interdependencencies"), which trigger a social change.

Here's Sunstein on preference falsification:  
[W]ith respect to preference falsification, people might say they like an existing status quo when they really don’t or they might change the subject when the status quo is raised, or they might hear a little voice in their head which they turn off. Here’s some words from the best book I’ve ever read on Nazism. It’s the best book because it’s not only revealing, it’s also cheerful. You can read it without crying. It’s written by a journalist who went back to Germany in the 1950s and spoke to former Nazis and found that to his at least mild surprise, he liked everyone.
They were all good people. One of them said this when asked about opposition: the former Nazi named Karl said, “Opposition? How would anybody know? How would anybody know what somebody else opposes or doesn’t oppose? That a man says he opposes or doesn’t oppose depends on the circumstances, where and when, and to whom, and just how he says it and even then, you must still guess why he says what he says.” Now, that’s offhand remarks by someone who wasn’t a social theorist, but who lived under Nazism. Its profound. He’s suggesting that the existence or absence of opposition is contingent on what’s permissible, what social norms are. To that extent, Karl is referring to the fact that in Germany, as in every society, people live in a state of pluralistic ignorance, which means we don’t know what is in other people’s heads. People might seem content with the status quo, or miserable about it, when in fact what they’re thinking inside, if you could see a thought bubble, would be very different. If they’re silent, it’s very hard to know what they’re thinking. ...
On diverse thresholds:
Some people require no support at all before they will say what they think or join a movement. They might be courageous, foolhardy or just deeply committed. We can call them, and this isn’t pejorative, the ‘zeros’ in the sense that they need nothing to join a movement of one or another kind. It could be white nationalism. It could be Nazism. It could be a liberation movement. If no one joins them, they’re going to be marginalized. They’ll look foolhardy, extreme, or possibly nuts. That’s the technical term. ...  Other people are going to require some social support ... I supported my friend, but I needed him to go first. People like this won’t move unless someone else does. If someone else does, they’ll prefer to join, too. Call them the ‘ones.’ Others require more than a little; they need two people ... 
 The ‘twos’ are followed by people who, not shockingly, have numbers assigned to them all the way up to ‘hundreds’ and ‘thousands’, including, eventually, the ‘infinites’ defined as people who, for one or another reason, won’t challenge the status quo no matter what. Okay, here’s the kicker. It’s extremely difficult to observe people’s internal preferences in light of preference falsification. It’s even harder to get at people’s thresholds and we ourselves probably don’t know what our thresholds are. In the Iranian Revolution, people who participated in the revolt were amazed that they did. Some of them turned out to be ‘fours’ and they had no idea. Others turned out to be ‘seventies’ and they might have thought that they were ‘infinites’. 
On interdependencies:
Everything depends on who is seen to have what… done what and exactly when. Diverse thresholds are one thing; whether people are going to move depends on whether the zeros go first and are seen to have told that father to stop hitting his kid, whether the ones are seen to have joined a movement, let’s say, for #MeToo; and then the twos and the threes, and the fours. If that’s what happens, we’re going to see a movement and it’s going to succeed. Everything depends on the distribution of action and the thresholds. If there are no zeros or if no one sees any of them, no rebellion’s going to occur. If there are a few ones, the status quo is going to be safe. If most people are tens, or hundreds or thousands, the same is true even if there are plenty of twos and threes, and fours. Okay, those are my three moving parts.
Perhaps the most obvious examples of these kinds of changes are fairly extreme cases like the fall of the Soviet Union. But does this framework about change also apply in fairly free societies, like the United States or nations of western Europe, where the official constraints on disagreeing with the status quo are quite constrained? Sunstein argues:
Yes. I think a lot, even in the United States and the United Kingdom, and France, and Canada, countries that do have either formal freedom or formal freedom plus cultures of, let’s say, welcoming dissent, I think still a lot. I’ll give a few examples; the movement for same-sex marriage, clearly, it’s the case that the closet was a devastation for the movement for that. As the closet started to open up, then something started to move. It’s much bigger than that, though, that heterosexuals who were fine with same-sex marriage or who were fine with equality or even wanted it, they were closeted, too. The existence of a shifting norm unleashed people like my mother, heterosexual, but my mother talked as if she was homophobic until at a certain point, she said, “That’s ridiculous.” She always had a voice in her head saying, “That’s ridiculous.” That happened to many millions of people in free countries. I think John Stuart Mill was on this point, that we often underestimate the extent to which conformity pressures are squelching behavior even in quite free nations. ...

Yeah, so one big part of the movement for gay marriage is the unleashing through the softening of social norms of gays and lesbians to say, “I love this person. I want to marry him. You’re not allowing me?” The other thing that happened was that many heterosexuals who went around laughing in a homophobic way or thinking, “Same-sex marriage? That’s ridiculous,” but while in their head, they didn’t really think that. They shifted. As you say, you’re quite right that a number of people didn’t think about it much or thought of the ban on same-sex marriage as just part of life’s furniture and as the possibility opened up, they started considering it. What I want to focus on, because I think it’s particularly intriguing for extremely rapid social change, is when a dam breaks and many social movements, large and small, are exercises in dam breaking, where a social norm operated as a tax on behavior, so that you couldn’t do it without facing something like a fine. Then the tax diminishes, or what was once a tax becomes a subsidy, so you’re better off if you say what you think.
Along a different line, I was interested in Sunstein's comments about his time spent in goverment, and about the differing skills and mindsets of what succeeds in academia and what succeeds in government: 
I think academics often do best if they let their minds go to all sorts of places. I had a good friend in government who told me after two years, this is a very good academic and a very good public servant who said, “Get out.” And he said, “Government ruined me. I can’t think academically anymore, and it’s going to ruin you, get out.” I stayed a little while longer than he wanted, but I never forgot his words. ...
Many academics I saw go into the Obama government, who were terrible at it, because they were really good at coming up with creative ideas, but the idea either couldn’t or shouldn’t be implemented, and they weren’t good at doing the solid work of turning a good policy into reality. I tried early on to have my ears big and my mouth small so that I would just learn from people who knew how to do government. The people in government often whom I greatly admired, they wouldn’t be good academics. They’re not writers, and they’re not ‘idea’ people. They’re amazing at figuring out how to pull levers to do something which actually is helpful. It’s a really different skill set.

Monday, November 18, 2019

China's Belt and Road Initiative: Could It All Come Crashing Down?

Brad Parks at the Center for Global Development managed to find a nice way of boiling down the ways that China's Belt and Road Initiative could possibly become a failure and a burden in a short thought experiment ("Chinese Leadership and the Future of BRI: What Key Decisions Lie Ahead?" July 24, 2019). Here's how he describes one possible future a decade from now (I added a couple of paragraph breaks):
It’s 2028. The Belt and Road Initiative (BRI) has been underway for 15 years, but the initial enthusiasm and momentum behind BRI has vanished. Many of the governments that initially joined the initiative have publicly withdrawn or quietly wound down their participation. China’s staunchest allies remain engaged but even they have reservations about the wisdom of the initiative. They are saddled with unproductive public investment projects and struggling to service their debts. Domestic public sentiment towards China has soured, and they have come to view their participation in BRI as more of a political liability than an asset. But they worry about the consequences of alienating their most important patron and creditor. China has also assumed a defensive posture. Lacking the goodwill that it possessed at the beginning of BRI, it is now using inducements and threats to prevent its remaining clients from abandoning the initiative. 
Western donors and lenders watch from the sidelines with a sense of bemusement. They encouraged China to “multilateralize” BRI by establishing a common set of project appraisal standards, procurement guidelines, fiduciary controls, and social and environmental safeguards that other aid agencies and development banks could support. But Beijing chose to go it alone. It opted not to embrace the use of economic rate-of-return analysis to vet project proposals; resisted efforts to harmonize its environmental, social, and fiduciary safeguards with those used by aid agencies and development banks outside of China; and pushed back on the “Western” suggestion that it modernize its monitoring and evaluation practices. China bet that its fast and flexible approach to infrastructure finance would prove to be so compelling that traditional donors and lenders would eventually jump on the bandwagon and co-finance BRI projects. But it miscalculated. Its model was insufficiently attractive on its merits to enlist the participation and support of the other major players in the bilateral and multilateral development finance market. Nor was it sufficiently appealing to sustain elite and public support in partner countries.
China is now substantially weaker at home than it was during the early days of BRI. Its policy banks and state-owned commercial banks faced top-down and bottom-up pressure—from the State Council and cash-poor BRI participants—to fast-track big-ticket infrastructure projects with as little “red tape” as possible. But many of these projects were poorly designed, so the banks are now dealing with unsustainable stock of non-performing loans, leaving them with two equally unattractive choices: restructure the debts of the least creditworthy countries or throw good money after bad by offering new loans to help borrowers repay old loans. 
With lower-than-expected reflows entering the coffers of China Development Bank, China Eximbank, and the “big 4” state-owned commercial banks, the People’s Bank of China sees the writing on the wall and decides to intervene. It recapitalizes the banks once, and then again, and again. As the country’s foreign exchange reserves dwindle, fiscally conservative voices within China grow louder. They call upon the banks to rein in their overseas lending activities and find common cause with the Chinese public, which sees ample evidence of waste and corruption in BRI projects and has a declining appetite for overseas entanglements. As populist and isolationist pressures mount, China’s political leadership concludes that it no longer enjoys domestic support for its international leadership ambitions. 
Just to be clear, Parks isn't predicting that this scenario will definitely happen, only that it could happen. In my own mind, the central issue here is about the nature of debt. When debt is used to finance a successful project or investment, then the loan can be repaid on time and all parties are pleased. But if debt is used to finance a project that fails in narrow economic terms, and is also accompanied by a cavalcade of concerns over waste, political corruption, environmental dangers, and social harms, then the loan isn't going to be repaid on time (or perhaps at all) and all parties will be unhappy. When one country is both lending the money and often taking the lead in planning, building, and managing how the loaned funds are spend, while another country is repaying a loan that brought unwanted side-effects rather than promised benefits, the possibility for conflict and lasting bad feeling is very high.

With any project as enormous as the Belt and Road Initiative, it's safe to predict that there will be both successes and failures. But in many cases, other international lenders had already considered or were in the process of considering the infrastructure projects that China is supporting. The other international lenders had concerns about economic viability, or wanted to put in place certain conditions to reduce risks of corruption, environmental damage, or other unwanted side effects. China's lenders were willing to brush aside these concerns. The future of the Belt and Road Initiative may thus rest on whether other international lenders have been too timid about lending to projects that were good risks, or whether China's lenders have been too aggressive lending to projects that were poor risks.

I've tried to capture some of this dynamic in previous posts on the subject (although not as crisply as in Parks's thought experiment):

For additional follow-up, I'd recommend the article by Parks quoted above, and two other recent essays: "Belt and Road Economics: Opportunities and Risks of Transport Corridors," a report released a couple of months ago by the World Bank; and "Catching the Dragon: Responding to China’s Trillion Dollar Charm Offensive in Developing Countries," by Staci Warden, in the Milken Institute Review (Third Quarter 2019).

Friday, November 15, 2019

Is Opposition to Immigration Primarily Economic or Cultural?

It's clear that there is a considerable hostility to immigration, both in the United States and across much of Europe. Is that opposition rooted primarily in economic factors or in cultural factors? What kind of evidence could help answer the question?

One approach is to look at whether anti-immigrant attitudes are more common among occupations more threatened by immigrant competition or in local areas that have received more immigrants.  If so, this would support an economic explanation for anti-immigrant sentiment. Another approach is the "survey experiment," which involves doing a survey with several different versions that differ in  what questions are asked, and thus seeing what factors are shaping people's attitudes. Both approaches suggest that that cultural factors than economic factors in anti-immigrant sentiment.

For a sampling of the evidence on this point, I'll draw upon some comments in a couple of papers in the Fall 2019 issue of the Journal of Economic Perspectives: "The Surge of Economic Nationalism in Western Europe," by Italo Colantone and Piero Stanig (pp. 128-51) and "Economic Insecurity and the Causes of Populism, Reconsidered, by Yotam Margalit (pp. 152-70). 

For example, Colantone and Stanig looked at areas that had received more immigrants and found: 
Public opinion research consistently finds that direct competition with immigrants on the labor market is not an important predictor of anti-immigration sentiments. Instead, anti-immigrant views are mostly driven by generalized fears of potential economic or social harm caused by immigration, perceived as a threat to national culture (Hainmueller and Hopkins 2014). ... 
Empirical evidence suggests that economic hardship of different origin may be a more important predictor of anti-immigration sentiments than the actual presence of immigrants in a region. As one vivid example, immigration was one of the single most important issues motivating Leave voters in the Brexit referendum of 2016 (Ashcroft 2016; Ipsos MORI 2016). Yet there is no robust evidence of higher Leave vote shares in regions where a larger fraction of the population is foreign born, or where relatively more immigrants arrived in the years prior to the referendum (Colantone and Stanig 2018a). Consistently, our own empirical evidence shows that negative attitudes about immigration at the individual level are driven not by the share of foreign-born population in the region of residence, nor by the recent arrival rates of immigrants. Rather, what seems to explain nativist attitudes is contextual economic distress—for instance, driven by the exposure to the Chinese import shock (Colantone and Stanig 2018a). Economic distress also seems to drive more cultural concerns about immigration, such as the belief that immigrants do not make a positive contribution to the national cultural life (Colantone and Stanig 2018a, b). In a situation of poor economic performance, it can be easy and politically rewarding to blame immigrants, even when the underlying economic grievances have very different origins, as in the case of globalization. 
Margolit found that opposition to immigration doesn't seem linked with whether one works in an occupation more likely to be disrupted by immigrant labor:
Furthermore, my collaborators and I find that workers employed in very different segments of the labor market, such as meat-packing, education, and finance—differing in terms of skill specificity, penetration by foreign labor, and value added per worker—share remarkably similar preferences in terms of the skill profile of the immigrants they are willing (or not) to accept (Hainmueller, Hiscox, and Margalit 2015). This finding does not sit well with a prediction that natives will be more opposed to immigrants with skill levels similar their own, or indeed with any model that predicts that different segments of native workers will have different preferences regarding the desired type of immigrants.
Margolit also describes "survey experiments," where several slightly different surveys are given, and then the results can be compared to get a sense of what is affecting people's beliefs--especially about issues like bias against immigrants of different ethnic or cultural background. Here's an example: 
For example, a survey experiment in the United Kingdom varied the information it provided to participants about the skill mix of immigrants coming into the country, their region of origin, and the impact of immigration numbers on the long-term share of white Britons. The study finds that even when controlling for the information about skill mix and region of origin, the very mention of the immigrants’ impact on the share of white Britons almost halves support for current immigration levels (reducing it by 17–22 percentage points to about 20 percent of the public) (Kaufmann 2018). Experiments conducted in the United States find a similar effect, in which prompting (or reminding) white Americans about the impending racial shift and future loss of their majority status magnifies their racial bias, particularly toward Hispanics, and increases support for restrictive immigration policies (Craig and Richeson 2014; Major, Blodorn, and Blascovich 2018).
Another kind of survey experiment is a "list experiment," which Margolit describes in this way: 
In a study using this method, Janus (2010) randomly divided a national sample of US non-Hispanic whites into two groups and asked them to read a list of several statements. After reading the list, respondents in both groups were asked to report the total number of statements they “oppose or are against,” without having to report their view on each specific statement. For the control group, the list included three statements on issues on which concerns with social desirability are unlikely to be a problem, such as whether or not they oppose “Professional athletes making millions of dollars per year.” For the treatment group, the list contained the same three nonsensitive statements, but with an addition of a fourth statement: “Cutting off immigration to the United States.” In this experiment, the difference in the mean number of statements reported by participants in the control group (1.77) and the mean number reported by participants in the treatment group (2.16) is attributable only to the additional sensitive item and to sampling error.
In doing surveys about attitudes concerning immigration, one of the strongest results is that those with less education are much more likely to be opposed to immigration, while those with more education are likely to favor immigration.  The key point here is that those with high education levels favor more immigration of those with both high and low skill levels, which presumably includes support for immigration of those who would be competing with them for jobs. Conversely, those with low education levels tend to oppose immigration of those with both high and low skill levels, which means they oppose immigration both of those who might be competing with them for jobs and also those who are unlikely to be competing with them. This pattern suggests cultural attitudes about immigration correlated with higher and lower levels of education are driving the results.
The message that current hostility to immigration is primarily cultural is consistent with recent research on US opposition to immigration a century ago. Marco Tabellini published "Gifts of the Immigrants, Woes of the Natives: Lessons from the Age of Mass Migration," in the Review of Economic Studies, which is waiting in line in the form of corrected proof pages to be published (as of May 6, 2019).  Here's the abstract of Tabellini's article:
In this article, I jointly investigate the political and the economic effects of immigration, and study the causes of anti-immigrant sentiments. I exploit exogenous variation in European immigration to U.S. cities between 1910 and 1930 induced by World War I and the Immigration Acts of the 1920s, and instrument immigrants’ location decision relying on pre-existing settlement patterns. I find that immigration triggered hostile political reactions, such as the election of more conservative legislators, higher support for anti-immigration legislation, and lower redistribution. Exploring the causes of natives’ backlash, I document that immigration increased natives’ employment, spurred industrial production, and did not generate losses even among natives working in highly exposed sectors. These findings suggest that opposition to immigration was unlikely to have economic roots. Instead, I provide evidence that natives’ political discontent was increasing in the cultural differences between immigrants and natives. Results in this article indicate that, even when diversity is economically beneficial, it may nonetheless be socially hard to manage.
In the United States, as in many other countries, immigration is a relatively small factor in its effect on either levels of wages or inequality of wages. (For discussion of the US situation in particular. see  Giovanni Peri, "Immigrants, Productivity, and Labor Markets," Journal of Economic Perspectives, Fall 2016, 30:4, pp. 3-30.) The enormous political energy surrounding immigration issues grows from non-economic roots.