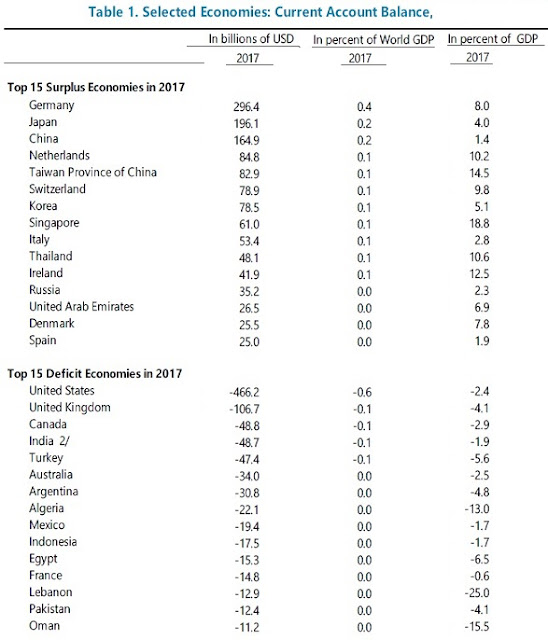
Here's a list of the 15 countries with the largest trade surpluses and deficits, as measured by the current account balance. It also shows these magnitudes as a share of world GDP and a share of the country's GDP (for the record, I've edited the table by cutting out the columns for 2014-2016).
A few facts jump out at me:
1) The US has the largest trade deficit in the world in absolute terms. However, trade deficits are larger as a share of the national economy in a number of other countries, including the UK, Canada, Turkey, Argentina, Algeria, Egypt, Lebanon, Pakistan, and Oman.
2) Germany has by far the largest trade surplus in the world in absolute terms. Indeed, the trade surplus for the euro-area as a whole (not shown in the table) is $442 billion--very similar in size to the US trade deficit.
3) China, which seems to be arch-enemy #1 for trade at present , is third-highest in absolute size of trade surplus, well behind Germany and Japan. Measured as a share of national GDP, China's trade surplus is actually the smallest of the top 15 trade surplus countries listed here.
4) If you subscribe to the economically illiterate view that trade surpluses are a measure of a nefarious ability to trade unfairly and exploit the rest of the world, while trade deficits are a sign of victimization by the beliefs of naive and overly trusting free trade fanatics, you need to match those beliefs to the national patterns shown here. That is, you need to believe that the 15 countries at the top are unfairly hustling the rest of the world economy, while the 15 at the bottom are paying the price.
5) The IMF report also emphasizes that there was a major shift in the configuration of global trade balances back around 2013, which has continued since then: trade surpluses and deficits are more concentrated in advanced economies, and less in the rest of the world economy.
"Global surpluses and deficits have become increasingly concentrated in AEs [advanced economies], as China and oil exporters have seen their current account surpluses narrow and the deficits of some EMDEs [emerging market and developing economies] (for example, Brazil, India, Indonesia, Mexico, South Africa) have shrunk. Key drivers of this reconfiguration were the sharp drop earlier this decade in oil prices, which have recovered somewhat after bottoming out in 2016, and the gradual tightening of global financing conditions reflecting prospects for monetary policy normalization in the United States. Also at work have been asymmetries in demand recovery and the associated policy responses in systemic economies ... After 2013, higher or persistently large surpluses in key advanced economies (for example, Germany, Japan, the Netherlands) were underpinned by relatively weaker domestic demand, constrained by fiscal consolidation efforts—necessary in some cases, given compressed fiscal space. Meanwhile, higher or persistent current account deficits in other AEs (United Kingdom, United States) reflected a stronger recovery in domestic demand, supported by some recent fiscal easing. Meanwhile, the narrowing of China’s underlying current account surplus was supported by a marked relaxation of fiscal and credit policies, masking lingering structural problems and causing a buildup of domestic vulnerabilities. These asymmetries in demand strength have also led to differences in monetary policy (as seen by the evolution of longer term nominal bond yields) and currencies."In passing, it's worth notice that the IMF economists explain these shifts in current account surpluses and deficits without reference to trade becoming more or less fair--which makes sense, because there were no major changes in the rules over this time. Instead, they focus on demand in different countries, along with fiscal and monetary policy choices.
In fact, China's current account deficit has dropped dramatically in the last decade, from about 10% of GDP in 2007 to 1.4% in the table above. The IMF writes about China:
"The CA [current account] surplus continued to decline, reaching 1.4 percent of GDP in 2017 ... about 0.4 percentage points lower than in 2016. This mainly reflects a shrinking trade balance (driven by high import volume growth), notwithstanding REER [real effective exchange rate] depreciation. Viewed from a longer perspective, the CA surplus declined substantially relative to the peak of about 10 percent of GDP in 2007, reflecting strong investment growth, REER appreciation, weak demand in major advanced economies, and, more recently, a widening of the services deficit ..."Conversely, the US current account trade deficit has declined from about 6% of GDP back in 2006 down to about 2.5% of GDP since 2014.
It is of course not a coincidence that the peak of China's trade surpluses coincides with the trough of US trade deficits, back around 2006-2007. China's exports and trade surplus exploded after China entered the World Trade Organization in 2001, much faster than anyone (including China's government) expected. China's exports of goods and services were 20.3% of China's GDP in 2001, and then took off to hit 36% of GDP in 2006, but since have fallen back to 19.7% of China's GDP in 2017. Conversely, the US economy was inhaling imports during its credit-led housing boom back in about 2005-2006.
Maybe there was a case for seeking to limit disruption from China's exports during the "China shock" period from 2001-2007 or so, when China's exports and trade surplus exploded in size. But it's now a decade later. And both China's trade surpluses and America's trade deficits have dramatically declined during that decade, well before any shots were fired in President Trump's trade war.
