Wednesday, October 31, 2018

Kinlessness

Kinlessness refers to a person without close living relatives. The idea of "close relatives" can be defined various ways: for example, as no living partner or children, or as no living partner, children, siblings, or parents. Ashton M. Verdery and Rachel Margolis present "Projections of white and black older adults without living kin in the United States, 2015 to 2060" (PNAS, October 17, 2017, 114: 42, 11109-11114). They write:
"Our findings point to dramatic increases in the numbers of kinless older adults in the United States, whether we consider a broad or a narrow definition of kinlessness. The increases occur for whites and blacks, men and women. By 2060, we expect the population of white and black Americans over 50 y old without a living partner or children to reach as high as 21.1 million, 6.3 million of whom will also lack living siblings or parents, up from our estimates of 14.9 million and 1.8 million, respectively, in 2015. The population of adults who will be over 50 y old in 2060 is already alive, which increases our confidence about probable levels of future kinlessness, barring dramatic changes in projected demographic processes."
Here's a set of graphs showing their estimates:

Verdery and Margolis  mostly focus on what assumptions about aging, mortality rates, marriage, abd childbirth drive their results. But at they note, those adults who will be over 50 in 2060 are already alive--that is, they were born in 2010 or earlier. Thus, we already know a certain amount about the family formation patterns of this group. But there are also broader social issues here. As they write:
Older adults have lived within dense kin networks for most of human history and the kinless have been a small subpopulation in the modern demographic era. However, recent declines in marriage, increases in gray divorce, and fertility decline are leading to larger numbers of older adults with no close family members. Mortality improvements and the increase in new relationship forms among older adults are not large enough to offset these trends.
Close family is a form of social insurance that often assists with addressing problems of life and old age. Figuring out what to for millions of people without close family will be a social challenge. At a personal level, give a thought to the kinless folks that you know.

Tuesday, October 30, 2018

Some Snapshots of Global and US Wealth

Wealth is not income. Income is the inflow measured over a period of time, like a pay period or a calendar year. Wealth is the accumulation of financial and real assets, minus debts. The total in retirement account and the equity in your house are wealth, but they are not income. The Credit Suisse Research Institute provides some perspectives in its recently published Global Wealth Report 2018, 

"Measured in current US dollars, total global wealth rose from USD 117 trillion in 2000 to 317 trillion in mid-2018, a rise of USD 200 trillion, equivalent to roughly 2.5 times global GDP." Global wealth works out to $63,100 per adult.

Along with its overview of global wealth, the report has discussions of the distribution of global wealth, both overall and across regions, and short reports for the growth of wealth in countries. Here's the "global wealth pyramid." At the bottom, about 3.2 billion adults, roughly two-thirds of the adult population of the world, have 1.9% of the total wealth. At the top, there are 42 million adults or 0.8% of the world population who have more than $1 million in wealth, and as a group they hold 44.8% of total world wealth.


The US economy, with its combination of high incomes and a large number of people, has many more milliionaires and ultra-high-worth individuals than other countries. Here's a figure showing the number of people with over $50 million in wealth across countries.

In different countries, what share of wealth is held by the top 1% of wealthholders? US wealth is more concentrated than Germany or China, but less so than Brazil, India, or Russia.
It's important to keep wealth numbers in some perspective. Being an ultra-high-net-worth person with more than $50 million in wealth is very rich indeed, wherever you live. But for Americans, for those in their 50s or older who have a lot of equity in their homes in parts of the US where real estate is pricey, and who also have accumulated a chunk of money in their retirement account during several decades of working wealth, exceeding $1 million in accumulated wealth is not an extraordinary event. I'll finish here with a couple of images of wealth patterns in the US.

Monday, October 29, 2018

Remembering Albert Hirschman's Tunnel Effect

Why do societies worry about high or rising inequality more at some times than at others. Albert O. Hirschman offered a classic answer in "The Changing Tolerance for Income Inequality in the Course of Economic Development," which appeared in the November 1973 Quarterly Journal of Economics (87: 4, pp. 544-566). His argument is in large part structured around a tunnel metaphor, which goes like this (footnotes omitted):
"Suppose that I drive through a two-lane tunnel, both lanes going in the same direction, and run into a serious traffic jam. No car moves in either lane as far as I can see (which is not very far). I am in the left lane and feel dejected. After a while the cars in the right lane begin to move. Naturally, my spirits lift considerably, for I know that the jam has been broken and that my lane's turn to move will surely come any moment now. Even though I still sit still, I feel much better off than before because of the expectation that I shall soon be on the move. But suppose that the expectation is disappointed and only the right lane keeps moving: in that case I, along with my left lane cosufferers, shall suspect foul play, and many of us will at some point become quite furious and ready to correct manifest injustice by taking direct action (such as illegally crossing the double line separating the two lanes). ...
"As long as the tunnel effect lasts, everybody feels better off, both those who have become richer and those who have not. It is therefore conceivable that some uneven distribution of the new incomes generated by growth will be preferred to an egalitarian distribution by all members of the society. In this eventuality, the increase in income inequality would not only be politically tolerable; it would also be outright desirable from the point of view of social welfare."
Hirschman was focused on issues of economic development. He offers examples of a number of countries where many poor people welcome signs of economic development before it touches them personally in any way--presumably because they are in the position of that driver stuck in the left lane who is taking hope from the movement of the right-hand lane.  He also points out that this tunnel effect can lead to a sense of complacency among leaders, when most people seem to be supportive of the processes that are leading to inequality, so that the leaders are unprepared when people start to denounce those same practices.
"Providential and tremendously helpful as the tunnel effect is in one respect (because it accommodates the inequalities almost inevitably arising in the course of development), it is also treacherous: the rulers are not necessarily given any advance notice about its decay and exhaustion, that is, about the time at which they ought to be on the lookout for a drastically different climate of public and popular opinion; on the contrary, they are lulled into complacency by the easy early stage when everybody seems to be enjoying the very process that will later be vehemently denounced and damned as one consisting essentially in `the rich becoming richer.'"
Writing back in 1973, Hirschman offers examples of "development disasters," in which those stuck in the left lane have come to strongly suspect that economic development will not benefit them, and thus a high degree of social unrest emerges. and he cites Nigeria, Pakistan, Brazil and Mexico as facing these issues in various ways.

I find myself thinking about the tunnel effect and expectations about future social mobility in the current context of the United States. Rising economic inequality in the United States goes back to the 1970s, and the single biggest jump in inequality at the very top of the income distribution happened in the 1990s when stock options and executive compensation took off. But my unscientific sense is that at that time, during the dot-com boom of the 1990s, many people who were either pleased, or not that unhappy, with the rise in inequality of that time. There seemed to be new economic opportunities opening up, new businesses were starting, unemployment rates were low, cool new products and services were becoming available. Even if you were for the time stuck in the left lane, all that movement in the right lane seemed to offer opportunities.

But that optimistic view of high and rising inequality came apart in the 2000s, under pressure from a from a number of factors: the sharp rise in imports from China in the early 2000s that hit a number of local areas so hard; the rise of the opioid epidemic, with its dramatically rising death toll exceeding 40,000 in 2016; and the carnage in employment and housing markets in the aftermath of the Great Recession.  In Hirschman's words, it seems to me that many politicians were "lulled into complacency by the easy early stage when everybody seems to be enjoying the very process that will later be vehemently denounced and damned as one consisting essentially in `the rich becoming richer.'"

Of course, no country is really one big tunnel. When people look at high or rising inequality, their views will often depend on the extent to which they feel some commonality--Hirschman calls it "shared historical experience"--with those who are moving ahead more briskly. In turn, this feeling may depend on the extent to which those who are moving ahead more briskly segment themselves off as a special and separate guild, with an implicit claim that they are just more worthy, or the extent to which they act in ways that embody broader and more inclusive outcomes.

Friday, October 26, 2018

Rent Control Returns: Thoughts and Evidence

Rent control is back on the public policy agenda, at least in California, where Proposition 10 on the November ballot "Expands Local Governments’ Authority to Enact Rent Control on Residential Property." Hence some thoughts about rent control in general, and a couple of the more recent studies on the topic.

Some thoughts:

1) Rent control is typically justified by pointing to low-income people who have difficulty paying the market rents. I'm sympathetic to this groups, and favor various policies like income support and rent vouchers to help them. But as I have argued in other contexts, invoking poverty and necessity as the basis for rent control is a ruse. The poor are not helped in any direct way by controlling rental prices for all income groups, including the rich and the the middle-class.

One response I have heard to this argument is that if rent control only applied to those with low-incomes, there would be an incentive to avoid renting to those with low incomes and not to build any more low-income housing. Of course, this argument is of course an admission that rent control discourages the growth and maintenance of rental properties. Expanding rent control to cover all income groups will expand those negative incentives to the entire rental housing stock, rather than just part of it.

2) Many of those who favor rent control also favor higher minimum wages. Thus, it is useful to remember that rent control is fundamentally different from minimum wage rules, because prices for physical objects like buildings are fundamentally different from wages paid to workers. When the price of an hour of work changes, workers can have higher or lower incentives, or higher or lower morale, or can search more or less for jobs, or consider different kinds of jobs, or look for jobs in other jurisdictions or in the underground economy, or even withdraw from the labor market. Buildings are not flexible in these ways, and so the implications of rent control are easier to predict with confidence than the implications of minimum wage laws. 

3) Before you own a house, there can be a tendency (which I certainly had) to think of the housing stock as immutable, rather like the pyramids. When you own a house, you instead come to think of it as a large machine that requires continual maintenance on all its separate parts. Many arguments in favor of rent control implicitly view the housing stock like the pyramids, and underestimate both the short-run costs of maintenance and repair and the longer-run costs of property upgrades and new construction.

4) Rent control offers a tradeoff between present benefits for one group and future costs for another. The present benefits go to those already living in apartments that are rent-controlled--whether they are low-income or not. Rent control benefits the well-settled. The future costs are imposed on those who are unable to find a place. In addition, rent control discourages building additional rental housing, which means that the possibility of mutual gains for future builders and future renters are foreclosed.

5) In any local housing market, the price of owned housing and rental housing is going to be closely linked, because one can be converted with relative ease into the other. If the price of housing is high, the price of rentals is also going to be high. The notion that a local housing market can make all the existing homeowners happy, with high and rising resale prices, but also make all the renters happy, with low and stable rents, is a delusion.

With rent control, as with so many other subjects, it can be tricky to sort out cause and effect. For example, say that we observe that cities which have rent control are more likely to have high housing prices. This of course would not prove whether rent control leads to high housing prices, or high housing prices make rent control more likely to be enacted, or whether some additional factors are influencing both housing prices and the political prospects for rent control.  Thus, researchers often try to seek out a "natural experiment," meaning a situation in which some change in law or circumstance affects part of a market at a certain time and place, but not another part. Then one can compare the more-affected and less-affected parts of the market.

For example, I wrote a few years about about a study on the unexpected end of rent control in Cambridge, Massachusetts, see "When Rent Control Ended in Cambridge, Mass." (October 4, 2012). That study found that rent-controlled properties had lower rents and were also lower quality with less maintenance. When a substantial number of properties in a neighborhood are poorly maintained, property values also fall for the building that are not rent-controlled.

Rebecca Diamond , Tim McQuade, and Franklin Qian offer a more recent study in "The Effects of Rent Control Expansion on Tenants, Landlords, and Inequality: Evidence from San Francisco."  An updated draft of the research paper is available at Diamond's website. It's also available as an NBER research paper, for those with access to that series. For a summary of the intuition behind the paper, you can turn to either a Cato Institute version or a Brookings Institution version.

From the Brookings summary, here's an description of the natural experiment they analyzed:
"In 1979, San Francisco imposed rent control on all standing buildings with five or more apartments. Rent control in San Francisco consists of regulated rent increases, linked to the CPI [Consumer Price Index], within a tenancy, but no price regulation between tenants. New construction was exempt from rent control, since legislators did not want to discourage new development. Smaller multi-family buildings were exempt from this 1979 law change since they were viewed as more “mom and pop” ventures, and did not have market power over rents.
"This exemption was lifted by a 1994 San Francisco ballot initiative. Proponents of the initiative argued that small multi-family housing was now primarily owned by large businesses and should face the same rent control of large multi-family housing. Since the initial 1979 rent control law only impacted properties built from 1979 and earlier, the removal of the small multi-family exemption also only affected properties built 1979 and earlier. This led to a differential expansion in rent control in 1994 based on whether the small multi-family housing was built prior to or post 1980—a policy experiment where otherwise similar housing was treated differently by the law."
The authors had data on those who lived in small multi-family units built before 1980, which were not covered by the 1979 rent control law, and those living in small multi-family units build from 1980 to 1990, who had not been covered by rent control in 1979, but were now covered by the 1994 change in the law. They also collected data on how properties were converted from rentals to condominiums or other types of properties.

The results are in some ways unsurprising. Those living in rent-controlled housing who remained in that housing benefited. But over time, landlords found ways to sidestep the rent controls. As they explain in the paper:
"In practice, landlords have a few possible ways of removing tenants. First, landlords could move into the property themselves, known as move-in eviction. Second, the Ellis Act allows landlords to evict tenants if they intend to remove the property from the rental market - for instance, in order to convert the units to condos. Finally, landlords are legally allowed to offer their tenants monetary compensation for leaving. In practice, these transfer payments from landlords are quite common and can be quite large. Moreover, consistent with the empirical evidence, it seems likely that landlords would be most successful at removing tenants with the least built-up neighborhood capital, i.e. those tenants who have not lived in the neighborhood for long."
As a result of such changes, the expansion of rent control reduced the quantity of rental properties and led to greater gentrification of San Francisco, with the incentives for builders to construct only new high-cost rentals and to build of high-end condominiums. They write:
"We find that rent-controlled buildings were 8 percentage points more likely to convert to a condo or a Tenancy in Common (TIC) than buildings in the control group. Consistent with these findings, we find that rent control led to a 15 percentage point decline in the number of renters living in treated buildings and a 25 percentage point reduction in the number of renters living in rent-controlled units, relative to 1994 levels. This large reduction in rental housing supply was driven by both converting existing structures to owner-occupied condominium housing and by replacing existing structures with new construction. This 15 percentage point reduction in the rental supply of small multi-family housing likely led to rent increases in the long-run, consistent with standard economic theory. In this sense, rent control operated as a transfer between the future renters of San Francisco (who would pay these higher rents due to lower supply) to the renters living in San Francisco in 1994 (who benefited directly from lower rents). Furthermore, since many of the existing rental properties were converted to higher-end, owner-occupied condominium housing and new construction rentals, the passage of rent control ultimately led to a housing stock which caters to higher income individuals."
You can make an argument that those who support higher minimum wages are seeking to help low-wage workers, and then quarrel over the evidence. But it is much harder to argue that comprehensive rent control is actually about helping low-income people find affordable housing. 

Thursday, October 25, 2018

How Much is the Fed Going to Raise Interest Rates?

In December 2008, the Federal Reserve took the specific policy interest rate that it targets--the so-called "federal funds interest rate"--down to the range of 0% to .25%. The Fed then held the federal funds interest rate at this near-zero level for seven years, until December 2015. Since then, the Fed has raised the federal funds interest rate eight times in small steps, with the most recent step at its September 27 meeting, so that it now is in the range of 2% to 2.25%. How much higher is the Fed going to go?

Short answer: Four more interest rate increases by the end of 2019, taking the federal funds interest rate up to the level of 3% to 3.25%.

Longer answer:  Robert S. Kaplan of the Dallas Federal Reserve explains in "The Neutral Rate of Interest" (October 24, 2018). Or for another nice explainer on the neutral rate, see
"The Hutchins Center Explains: The neutral rate of interest," by Michael Ng and David Wessel (October 22, 2018).

As Kaplan discussed, the Federal Reserve cut interest rates during the Great Recession and afterward, to stimulate the economy. But with the unemployment rate at 4% or less for the last six months, the Fed has been moving toward a "neutral" interest rate. Kaplan writes:
"The neutral rate is the theoretical federal funds rate at which the stance of Federal Reserve monetary policy is neither accommodative nor restrictive. It is the short-term real interest rate consistent with the economy maintaining full employment with associated price stability. You won’t find the neutral rate quoted on your computer screen or in the financial section of the newspaper. The neutral rate is an “inferred” rate—that is, it is estimated based on various analyses and observations."
So what are the Federal Reserve policymakers current inferring? At each meeting, the participants provide their own estimates of the neutral rate. Kaplan writes:
"Each of us around the FOMC table submits quarterly, as part of the Summary of Economic Projections (sometimes referred to as the SEP or the “dot plot”), our best judgments regarding the appropriate path for the federal funds rate and the “longer-run” federal funds rate. My longer-run rate submission is my best estimate of the longer-run neutral rate for the U.S. economy. In the September SEP, the range of submissions by FOMC participants for the longer-run rate was 2.5 to 3.5 percent, and the median estimate was 3.0 percent. My own estimate of the longer-run neutral rate is modestly below the median of the estimates made by my colleagues. My suggested rate path for 2019 is also modestly below the 3 to 3.25 percent median of the ranges suggested by my fellow FOMC participants."
So based on what Fed policy-makers are saying, that seems like what is likely to  happen (of course, barring substantial shifts in the economy that would lead to a reevaluation of plans). But is it what should happen? Kaplan makes the case for his own view, which in part involves looking at some prominent economic models that try to estimate the "neutral" interest rate. Thus, he writes:
"These models differ in terms of their structural assumptions and the data they use to produce estimates of the neutral rate. For example, Laubach–Williams uses data on real GDP, core PCE inflation, oil prices, import prices and the federal funds rate as inputs for their model. This model attempts to estimate an output gap to assess the neutral rate of interest. The Koenig model uses data on long-term bond yields, survey measures of long-term GDP growth and long-term inflation as inputs for its estimates of long-run r*. Giannoni’s model uses a broad set of key macroeconomic and financial data series to generate estimates of the neutral rate at different time horizons."
All of these models suggest that the neutral interest rate is lower now than, say, 15-20 years ago, when it was more in the range of 5%. The estimates are surrounded by a reasonable degree of uncertainty. But they generally support Kaplan's argument that the Fed should continue along its current path of interest rate increases.

The Fed's decisions about raising interest rates since December 2015 have  not been without controversy and dissent. Those who opposed raising the rates feared that the higher rates might slow the economy. But at least so far during the last few years, those skeptics have turned out to be mistaken in their concerns.

It's useful to remember that the specific interest rate on which the Fed focuses, the federal funds interest rate, is not a full summary of how easy or hard it is to borrow money. The Chicago Fed publishes a National Financial Conditions Index which looks at factors like total amount of loans, along with measures of leverage and risk. The pattern in the last few years is that although the Fed has raised its policy interest rate, credit conditions as a whole have actually been getting a little easier, not tighter. I tried to explain this pattern in "Rising Interest Rates, but Easier Financial Conditions" (February 15, 2018). The basic story is that the economy has been gaining strength, and the financial sector appears to have been reassured by the Fed's ongoing willingness to move to a neutral interest rate.

In other words, it is too simple to argue that higher interest rates always and automatically slow down an economy. When the higher interest rates reflect a bounce-back from historically low rates that were in place for seven years, returning those interest rates to more usual levels both reflects and supports economic strength.


Tuesday, October 23, 2018

The Remarkable Fall in Global Poverty

Back in 1990, the World Bank defined an "absolute poverty" line. It was based on the actual poverty lines as chosen by the governments of low-income countries around the world, and thus can be taken to represent those people who are beneath the most basic minimums for basic necessities like food, shelter, and clothing. This poverty line has been updated over time to adjust for changes in prices and exchange rates, and currently stands at $1.90 in consumption per person per day. The World Bank provides an overview of global poverty in its annual "Poverty and Shared Prosperity" report for 2018, titled "Piecing Together the Poverty Puzzle."  Here are some points that caught my eye.

The world has seen a dramatic fall in absolute poverty in the last 30 years or so. In 1990, more than one-third of the world's population was below the absolute poverty line; by 2015, it was 10% and falling. The raw number of people below the absolute poverty line declined by more than 1 billion. This extraordinarily rapid rise in the economic well-being of the world's poorest is without historical precedent.

A breakdown of the data by region shows an unsurprising pattern. Poverty in the east Asian region has dropped dramatically, thanks in substantial part to economic growth in China. Poverty in the south Asian region has dropped dramatically, thanks in substantial part to growth in India, as well as Bangladesh and others. Poverty rates in sub-Saharan Africa remain high.


But poverty rates don't quite capture the entire story. Population levels are very high in China and India, so that even low rates of poverty in those countries implies large absolute numbers of poor. Indeed, one pattern that has emerged is that in absolute numbers, more of the world's absolute poor now live in middle-income countries (which includes China, India, Pakistan, Bangladesh, Indonesia and others) than in low-income countries.

The report includes chapters looking at other measures of need, like improving the economic status of the bottom 40% of the population, or a multidimensional measure of poverty that includes not just income but access to health care and a secure community, or measures of poverty focused especially on women and children.

The World Bank also defines a poverty line for low-middle-income countries of $3.20 in consumption per person per day, and a poverty line for upper-middle-income countries of $5.50 per person per day. The share of people below these poverty lines has also fallen dramatically, although they remain fearsomely high in the regions of South Asian and sub-Saharan Africa.


Monday, October 22, 2018

Global Alcohol Markets

Markets for beer, wine and spirits offer can patterns of broad cultural interest--and for the college teacher, may serve to attract the attention of students as well. Kym Anderson, Giulia Meloni, and Johan Swinnen discuss "Global Alcohol Markets: Evolving Consumption Patterns, Regulations, and Industrial Organizations" in the most recent Annual Review of Resource Economics (vol. 10, pp. 105-132, not freely available online, but many readers will have access through a library subscription).  The authors take a global perspective on the evolution of alcohol markets. Here are a few points of the many that caught my eye.

1) "The global mix of recorded alcohol consumption has changed dramatically over the past half
century: Wine’s share of the volume of global alcohol consumption has fallen from 34% to 13% since the early 1960s, while beer’s share has risen from 28% to 36%, and spirits’ share has gone from 38% to 51%. In liters of alcohol per capita, global consumption of wine has halved, while that of beer and spirits has increased by 50%."

2) "As of 2010–2014, alcohol composed nearly two-thirds of the world’s recorded expenditure on beverages, with the rest being bottled water (8%), carbonated soft drinks (15%), and other soft
drinks such as fruit juices (13%)." 

3) There is something of inverse-U relationship between quantity consumed of alcohol and per capita GDP of countries.


4) However, when it comes to spending on alcohol as a share of income, it does not seem to drop off as income rises. The implication is that those in countries with higher per capita GDP drink smaller quantities of alcohol, but pay more for it.

5) "In early history, wine and beer consumption was mostly positively perceived from health and food security perspectives. Both wine and beer were safe to drink in moderation because fermentation kills harmful bacteria. Where available at affordable prices, they were attractive substitutes for water in those settings in which people’s access to potable water had deteriorated. Beer was also a source of calories. For both reasons, beer was used to pay workers for their labor from Egyptian times to the Middle Ages. Wine too was part of some workers’ remuneration and was included in army rations of some countries right up to World War II. Moreover, spirits such as rum and brandy were a standard part of the diet for those in European navies from the fifteenth century."

The authors then discuss how the rise of hard spirits and income levels raised concerns about health effects of alcohol consumption, while nonalcoholic alternatives became safe to drink--factors that helped to reconfigure social attitudes about alcohol. 

The article also includes discussions of the evolution of alcohol taxes, shifts in market concentration and competition, the rise of smaller-scale producers in recent years, and much more.   

Friday, October 19, 2018

Insights Into the Dramatic Rise in Pre-Marriage Cohabitation

If you go back 70 years, the share of women and men living together before marriage was under 1%. If  you go back 50 years, it was less than 10%. Now, about 70% of men and women live together before marriage.

Arielle Kuperberg digs into some of the patterns behind this trend in "From Countercultural Trend to Strategy for the Financially Insecure: Premarital Cohabitation and Premarital Cohabitors, 1956-2015," written as a briefing paper for the Council on Contemporary Families (October 8, 2018). The briefing paper draws on her article, To cite this article "Premarital Cohabitation and Direct Marriage in the United States: 1956–2015, just published in the Marriage & Family Review (but not freely available online).

Here's the overall trend in cohabitation before first marriage over time.


As Kuperberg breaks down the data, some interesting patterns emerge:

1) Some patterns by education.
"[O]verall there were no significant differences between rates of premarital cohabitation among couples with different levels of education during the period from 1956 to 1986. ... Between 1986 and 2000, premarital cohabitation rates grew more quickly among couples who had not completed high school than among any other group. At the next levels of education, differences in cohabitation rates remained small. Their rates grew more slowly, and there wasn’t a big difference among couples with at least a high school degree over thistime period. ... 
"Starting in 1995, a majority of first marriages have begun with premarital cohabitation. Here’s where a new educational divergence occurred: Since 2000, cohabitation rates of the most educated couples have grown markedly more slowly than those of all other educational groups – people with high school diplomas and even ones with some college. By 2011-2015, women who married directly, without first cohabiting, were a minority in every educational group. Even so, marrying directly was twice as common among women with a college degree as among women who had a high school diploma or less. More than 40 percent of women with a bachelor’s degree married in the so-called “traditional” way, without having first cohabited. But fewer than 20 percent of women who had never attended college did so."

2) The link from cohabitation to divorce has shifted.

"[T]he relationship between premarital cohabitation and divorce has also changed over time. Not surprisingly, those who were willing to transgress strong social norms to cohabit from the 1950s to 1970 were also more likely to transgress similar social norms about divorce. Indeed, in that earlier period, people who lived together before marriage were 82 percent more likely to divorce than people who moved in together only after marriage. But as cohabitation became more widespread, its association with divorce faded. In fact, since 2000 premarital cohabitation has actually been associated with a lower rate of divorce, once factors such as religiosity, education, and age at co-residence are accounted for. ...
"Regardless of whether people live together before marriage or not, college-educated couples have far lower rates of divorce than couples with a high school diploma or less. On average, women with a high school diploma or less have a 60 percent chance of a marriage ending in divorce within 20 years. The chance that a woman with a college degree will divorce within the same time period is nearly three times lower — about 22 percent."
3) Economic factors play a role here, too.

As Kuperberg points out, lower rates of cohabitation before marriage for women with higher levels of education in part is likely to reflect higher incomes for themselves or their families. Thus, cohabitation is less likely to arise from economic stress for those with higher education, and marriage prospects are more likely to be taken into account at the start. 


Thursday, October 18, 2018

Do Remittances Help Growth? A Lebanon Story

Remittances are money sent back to a home country by emigrants. On a global basis, remittances to developing countries topped $400 billion in 2017, far exceeding foreign aid to those countries, similar in size to flows of loans and equity investment in those countries, and beginning to approach the level of foreign direct investment  in those countries.

These inflows of funds are clearly helpful to the recipient families, helping to boost and to smooth their consumption. But do they help to boost overall economic growth for the recipient country? Ralph Chami, Ekkehard Ernst, Connel Fullenkamp, and Anne Oeking raise doubts in "Is There a Remittance Trap? High levels of remittances can spark a vicious cycle of economic stagnation and dependence," published in Finance & Development (September 2018, pp. 44-47). This short and readable article draws on insights from their IMF working paper, "Are Remittances Good for Labor Markets in LICs, MICs and Fragile States? Evidence from Cross-Country Data" (May 9, 2018).

The authors point out that at a big picture level, countries that receive more remittances (as a share of GDP) don't seem to grow faster. They offer the intriguing example of Lebanon:
"Consider the case of Lebanon. For many years, this country has been one of the leading recipients of remittances, in both absolute and relative terms. During the past decade, inflows have averaged over $6 billion a year, equal to 16 percent of GDP. Lebanon received $1,500 a person in 2016, more than any other nation, according to IMF data.
"Given the size of these inflows, it should not be surprising that remittances play a key if not leading role in Lebanon’s economy. They constitute an essential part of the country’s social safety net, accounting on average for over 40 percent of the income of the families that receive them. They have undoubtedly played a vital stabilizing role in a country that has endured civil war, invasions, and refugee crises in the past several decades. In addition, remittances are a valuable source of foreign exchange, amounting to 50 percent more than the country’s merchandise exports. This has helped Lebanon maintain a stable exchange rate despite high government debt.
"While remittances have helped the Lebanese economy absorb shocks, there is no evidence that they have served as an engine of growth. Real per capita GDP in Lebanon grew only 0.32 percent on average annually between 1995 and 2015. Even during 2005–15, it grew at an average annual rate of only 0.79 percent. Lebanon is not an isolated example. Of the 10 countries that receive the largest remittance inflows relative to their GDP—such as Honduras, Jamaica, the Kyrgyz Republic, Nepal, and Tonga—none has per capita GDP growth higher than its regional peers. And for most of these countries, growth rates are well below their peers. It is important to recognize that each of these countries is dealing with other issues that may also interfere with growth. But remittances appear to be an additional determining factor rather than just a consequence of slow growth. And remittances may even amplify some of the other problems that restrict growth and development. ...

"Returning to the case of Lebanon, the country’s well-educated population could be expected to point to robust growth. Lebanese families, including those who receive remittances, spend much of their income on educating their young people, who score much higher on standardized mathematics tests than their peers in the region. Lebanon is also home to three of the top 20 universities in the Middle East, and researchers at these universities produce more research than their regional peers. Lebanon’s abundant remittance inflows could provide seed capital to fund business start-ups led by its well-educated citizens.
"But statistics show that Lebanon has much less entrepreneurial activity than it should, especially in the high-tech information and communication technology sector. The size of this sector is less than 1 percent of GDP, and Lebanon scores very low on international gauges of this sector’s development. Studies of the overall spending habits of remittance-receiving households in Lebanon show that less than 2 percent of inflows goes toward starting businesses. Instead, these funds are typically spent on nontraded goods such as restaurant meals and services, and on imports.
"Instead of starting new businesses—or even working in established ones—many young Lebanese choose to emigrate. The statistics are stark: up to two-thirds of male and nearly half of female university graduates leave the country. Employers complain of an emigration brain drain that has caused a dearth of highly skilled workers. This shortage has been identified as a leading obstacle to diversifying Lebanon’s economy away from tourism, construction, and real estate, its traditional sources of growth. For their part, young people who choose to seek their fortune elsewhere cite a lack of attractive employment opportunities at home.
"Part of the remittance trap thus appears to be the use of this source of income to prepare young people to emigrate rather than to invest in businesses at home. In other words, countries that receive remittances may come to rely on exporting labor, rather than commodities produced with this labor. In some countries, governments even encourage the development of institutions that specialize in producing skilled labor for export."
In addition, the authors argue that encouraging emigration and remittances can be a way for governments to avoid making the tougher policy reforms and choices that could encourage domestic growth, and encourage emigrants to network and build production chains back to their home countries that go beyond sending money. The authors write:
"Many politicians welcome the reduced public scrutiny and political pressure that come with remittance inflows. But politicians have other reasons to encourage remittances. To the extent that governments tax consumption—say through value-added taxes—remittances enlarge the tax base. This enables governments to continue spending on things that will win them popular support, which in turn helps politicians win reelection.
"Given these benefits, it is little wonder that many governments actively encourage their citizens to emigrate and send money home, even establishing official offices or agencies to promote emigration in some cases. Remittances make politicians’ job easier, by improving the economic conditions of individual families and making them less likely to complain to the government or scrutinize its activities. Official encouragement of migration and remittances then makes the remittance trap even more difficult to escape."
Those interested in more detail on remittances might start with:  

Wednesday, October 17, 2018

Canada Legalizes Marijuana: What's Up in Colorado and Oregon?

Canada became the second country to legalize recreational use of marijuana today. The first was Uruguay, back in 2013.

However, the Uruguayans have proceeded quite slowly in legalization, with a heavy dose of regulation.  Apparently 14 pharmacies in the country, most have run the regulation gauntlet to be allowed to sell marijuana. Uruguay has only two legal producers of marijuana. Buyers must register with the government. Moreover, there are international financial complications. Specifically, parts of Uruguay's economy, including its pharmacies, make heavy use of US dollars. As a result, Uruguay's pharmacies have accounts with US banks. However, under US law, banks cannot provide an account to any party involves with controlled substances. Thus, the Uruguayan pharmacies that are licensed for sales of marijuana can only sell for cash.

It appears that Canada's legalization will move ahead more briskly. Among US states, 31 have enacted laws allowing the sale of marijuana for medical purposes since California did so back in 1996.  But it was in 2012 that Colorado became the first state to legalize recreational use of marijuana. Alison Felix and Sam Chapman describe "The Economic Effects of the Marijuana Industry in Colorado" in Main Street Views from the Federal Reserve Bank of Kansas City (April 16, 2018). For the non-Coloradans among us, they provide a useful overview of what has happened.

Colorado allowed local jurisdictions to keep some control over marijuana sales. Felix and Chapman write: "Although marijuana is legal in all of Colorado, each local jurisdiction can decide whether to allow medical or recreational marijuana retail stores. As of June 2017, 65 percent of Colorado jurisdictions (out of 320) had banned both medical and recreational stores, 4.7 percent had allowed only medical stores, 3.4 percent had allowed recreational stores only and 26.6 percent had allowed both recreational and medical marijuana stores."

Here's the pattern of monthly sales of medical and recreational marijuana:
Image
The overall rise in recreational marijuana sales is substantial. It's interesting that sales of medical marijuana have remained flat. There are always concerns with medical marijuana that is it just a back-door to recreational use. But if that was true in Colorado, one might expect medical marijuana sales to decline when recreational use became legal, and that decline hasn't happened. (Of course, it's also possible that when recreational use of marijuana became legal, it also made medical use more culturally acceptable to more people, so any shift from medical-to-recreational use is being offset by greater acceptance of medical use.)

Sellers and producers of marijuana are licensed in Colorado, and the number of licenses has been rising substantially. Felix and Chapman write:
"In January 2014, there were 156 business licenses issued for recreational retail stores and 493 business licenses for medical marijuana stores. By February 2018, recreational retail store licenses had more than tripled to 518 stores, while medical licenses had grown slightly to 503 stores. In addition to retail stores, the state of Colorado also provides business licenses for cultivation facilities, infused product facilities, testing facilities, operators and transporters. In February 2018, there were 1,473 licenses for cultivation facilities including both medical and recreational, 535 licenses for infused product manufacturing facilities, 23 licenses for testing facilities, 12 operator licenses and 18 transporter licenses. These licenses are issued by the Marijuana Enforcement Division and signify the number of licenses issued but do not necessarily imply that all of these licenses are being actively used."
Colorado has several sales taxes on marijuana, adding up to an overall sales tax rate of about 30%. Most of this goes to the state government, with a sliver going to local jurisdictions. For perspective, marijuana sales taxes have been equal to about 2% of total general fund revenue for the state of Colorado since 2016. However, the tax revenue from marijuana does not go to the general fund, but instead is earmarked for popular causes like school construction and renovation, as well as paying for expenses of running the marijuana licensing system, doing research on marijuana health issues, and so on.

There are some social costs to be balanced against the financial and employment gains to producers, the pleasure of users, and funds for the government.
"One source, a March 2016 report by the Colorado Department of Public Safety, provides some early statistics related to the effects of marijuana legalization on public safety and public health. Reported marijuana usage has increased significantly in the state, with the percentage of 18 to 25 year olds reporting usage over the past month increasing from 21 percent in 2006 to 31 percent in 2014. Similarly, reported usage among adults over 25 has risen from 5 percent in 2006 to 12 percent in 2014. Hospitalizations related to marijuana also rose sharply from 803 per 100,000 hospitalization on average between 2001 and 2009 to 2,413 per 100,000 between 2014 and mid-2015. In addition, calls to poison control mentioning marijuana have increased between 2006 and 2015. ... Traffic fatalities with THC-only or THC-in-combination positive drivers rose from 55 in 2013 to 79 in 2014."
It typically takes a few years to compile health statistics, so it will be interesting to see how statistics on usage, health, and safety of marijuana evolve in the next few years. Of course, a full analysis would also have to take into account if higher marijuana use turns out to be substitute for use of alcohol and tobacco, or is in addition to them.

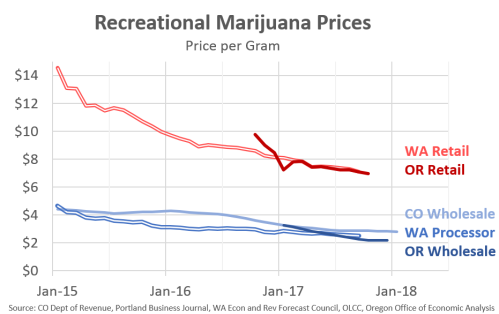
Oregon legalized recreational use of marijuana in 2016, and Josh Lehner at the Oregon Office of Economic Analysis posted some comments about the evolution of the market earlier this year in " Marijuana: Falling Prices and Retailer Saturation?" (February 8, 2018).  Lehner pointed out that in Oregon, Colorado, and Washington, prices for legalized recreational marijuana have been falling 10-20% per year in the last few years.

As Lehner argues, this price decline is probably to be expected as methods for production, distribution, and sales of marijuana become well-established, and as more efficient operations expand to take a larger share of markets.  On one side, some of the early entrants to legalized marijuana markets are going to be squeezed out by economic forces. But if part of the goal of legalizing recreational marijuana is to drive out black market sales, then lower prices for consumers will contribute to that goal.

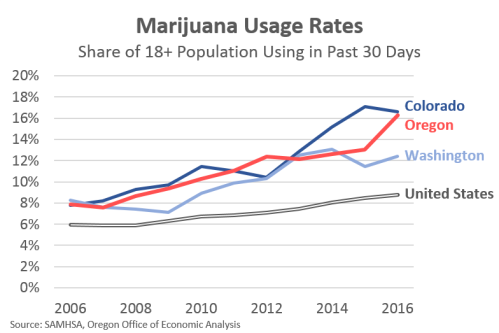
Lehner also offers evidence that marijuana usage rates are rising in states which have legalized the recreational use of marijuana.


Finally, Lehner discusses some speculation that over time, the marijuana market may evolve in a way similar to the beer market.
"As economist Beau Whitney notes, it’s easy to envision a long-run outcome for marijuana that is similar to the beer industry. One segment of the market is mass-produced and lower priced products. This will be the end result of the commodification of marijuana. Margins will be low, but due to scale, businesses remain viable. These are more likely to be outdoor grow operations as well, due to costs. Even in a world of legalized marijuana nationwide, it is plausible that Oregon, along with California, would remain a national leader in this market due to agricultural and growing conditions in the Emerald Triangle. The second segment of the marijuana market would be similar to craft beer today. This segment would include smaller grow operations of specialty strains, higher value-added products like oils, creams and edibles. Such products will require and command higher prices."

Friday, October 12, 2018

Why is Labor Force Participation Falling for Prime-Age Males?

For economists, "prime-age" refers to the ages between 25-54, which is post-school and pre-retirement for most workers. Didem Tüzemen asks "Why Are Prime-Age Men Vanishing from the Labor Force?" in the Economic Review of the Federal Reserve Bank of Kansas City (First Quarter 2018, pp. 5-28). She begins: "The labor force participation rate for prime-age men (age 25 to 54) in the United States has declined dramatically since the 1960s, but the decline has accelerated more recently. From 1996 to 2016, the share of prime-age men either working or actively looking for work decreased from 91.8 percent to 88.6 percent. In 1996, 4.6 million prime-age men did not participate in the labor force. By 2016, this number had risen to 7.1 million."

As Tüzemen shows, this rise in nonparticipation rates of prime-age males is broad-based. If you break down prime-age male labor force participation by education levels (less than high school, only high school, some college, college or more), the nonparticipation level is higher for those with less education, but it's up in every education category.  If break down the prime-age group into decades (25-34, 35-44, 45-54), then nonpartication is higher in the 45-54 age group, but it's been rising in every age category, too. 

Perhaps more of a clue comes from the employment survey data tiself.  As Tüzemen reports:
Those who report their status as "not in the labor force” also respond to another question, which asks, “what best describes your situation at this time? For example, are you disabled, ill, in school, taking care of house or family, in retirement, or something else?”
The answers to this survey question suggest that between 1996 and 2016, the share of nonparticipating men who give "disability" as an answer has declined, while the share who refer to family responsibilities, taking care of family, and in retirement have all increased.

Of course, these decisions about not being in the labor market are not made in a vacuum, but are presumably also affected by the reality of labor market opportunities. That's just a long way of saying that the rise in nonparticipation can involve both decisions about labor supply and realities of labor demand. Tüzemen makes a case that evolving labor demand is probably more important for rising male nonparticipation than choices about labor supply. In particular, she focuses on the "polarization" of the labor market--the overall pattern in which low-skill workers do OK, because they are providing personal services that are (at least so far) hard to replace with automation or software, and high-skilled workers do OK, because they are well-positioned to make gains from the use of automation and software, but those in the ranks of the middle-skilled can find themselves at risk. 

You can read the article to sort through the details of this argument, but here are a couple of points that caught my eye. One is that while nonparticipation of prime-age males has risen in every education group, the biggest rise is not in the lowest-skill or highest-skill groups, but rather in the middle.

The other point is that many of those currently out of the labor force are not looking to return. When the Great Recession hit from 2007-2009, the share of nonparticipating prime-age men who said they still wanted a job rose sharply. But now, the share of that group that says they want a job has declined back to levels from the early 2000s. This pattern suggests to me that some of the labor market nonparticipants who wanted a job have now returned to the labor market, while others have given up on employment.

Thursday, October 11, 2018

Primary Care: Expanding the Role of Nurse Practitioners

For most of us, most of the everyday health care we get is from a primary care doctor. But there's a limited number of primary care doctors, not enough to match the number of patients, especially in rural areas. An option slowly being used more broadly across the US health care system is let nurse practitioners (NPs) do primary care. Peter Buerhaus makes the case for accelerating this movement in "Nurse Practitioners: A Solution to America's Primary Care Crisis," written for the American Enterprise Institute (September 2018).

To set the stage, here's what primary care involves: 
"Primary care clinicians typically treat a variety of conditions, including high blood pressure, diabetes, asthma, depression and anxiety, angina, back pain, arthritis, thyroid dysfunction, and chronic obstructive pulmonary disease. They provide basic maternal and child health care services, including family planning and vaccinations. Primary care lowers health care costs, decreases emergency department visits and hospitalizations, and lowers mortality."
Here's evidence on the shortage of primary care physicians:
"The Association of American Medical Colleges (AAMC) estimates that by 2030 we will have up to 49,300 fewer primary care physicians than we will need ... Despite decades of effort, the graduate medical education system has not produced enough primary care physicians to meet the American population’s needs. When geographic distribution of primary care medical doctors (PCMDs) is taken into account, the problem begins to feel like a crisis. In 2018 the federal government reported 7,181 Health Professional Shortage Areas in the US and approximately 84 million people with inadequate access to primary care, with 66 percent of primary care access problems in rural areas."
Nurse practitioners (NPs) are already a recognized health care specialty, with additional training and autonomy beyond a registered nurse. Here's and overview:
"In the words of the American Association of Nurse Practitioners (AANP): `All NPs must complete a master’s or doctoral degree program, and have advanced clinical training beyond their initial professional registered nurse preparation.' Didactic and clinical courses prepare NPs with specialized knowledge and clinical competency to practice in primary care, acute care, and long-term health care settings. NPs assess patients, order and interpret diagnostic tests, make diagnoses, and initiate and manage treatment plans. They also prescribe medications, including controlled substances, in all 50 states and DC, and 50 percent of all NPs have hospital-admitting privileges. The AANP reports that the nation’s 248,000 NPs (87 percent of whom are prepared in primary care) provide one billion patient visits yearly.
"NPs are prepared in the major primary care specialties—family health (60.6 percent), care of adults and geriatrics (21.3 percent), pediatrics (4.6 percent), and women’s health (3.4 percent)—and provide most of the same services that physicians provide, making them a natural solution to the physician shortage. NPs can also specialize outside primary care, and one in four physician specialty practices in the US employs NPs, including psychiatry, obstetrics and gynecology, cardiology, orthopedic surgery, neurology, dermatology, and gastroenterology practices. Further, NPs are paid less than physicians for providing the same services. Medicare reimburses NPs at 85 percent the rate of physicians, and private payers pay NPs less than physicians. On average, NPs earn $105,000 annually.
"NPs’ role in primary care dates to the mid-1960s, when a team of physicians and nurses at the University of Colorado developed the concept for a new advanced-practice nurse who would help respond to a shortage of primary care at the time. Since then, numerous studies have assessed the quality of care that NPs provide ... and several policy-influencing organizations (such as the National Academy of Medicine, National Governors Association, and the Hamilton Project at the Brookings Institution) have recommended expanding the use of NPs, particularly in primary care. Even the Federal Trade Commission recognizes the role of NPs in alleviating shortages and expanding access to health care services. Most recently, the US Department of Veterans Affairs amended its regulations to permit its nearly 5,800 advanced-practice registered nurses to practice to the full extent of their education, training, and certification regardless of state-level restrictions, with some exceptions pertaining to prescribing and administering controlled substances."
So what's the problem? A number of states have rules limiting the services that NPs are allowed to provide. And a number of doctors support those rules, in part out of a fear that allowing NPs to do more would reduce their income or even threaten their jobs: 
"A 2012 national survey of PCMDs found that 41 percent reported working in collaborative practice with primary care nurse practitioners (PCNPs) and 77 percent agreed that NPs should practice to the full extent of their education and training. Additionally, 72.5 percent said having more NPs would improve timeliness of care, and 52 percent reported it would improve access to health services. However, about one-third of PCMDs said they believe the expanded use of PCNPs would impair the quality and effectiveness of primary care. The survey also found that 57 percent of PCMDs worried that increasing the supply of PCNPs would decrease their income, and 75 percent said they feared NPs would replace them." 
It's a nice thing that the health care industry provides jobs for so many workers, including doctors. But the fundamental purpose of the industry is not to provide high-paying jobs: it is to provide quality care to patients in a cost-effective manner. As Buerhaus writes:
"Drop the restrictions on PCNP scope-of-practice! These are regressive policies aimed at ensuring that doctors are not usurped by NPs, which is not a particularly worthwhile public policy concern, especially if it comes at the expense of public health. The evidence presented here suggests that scope-of-practice restrictions do not help keep patients safe. They actually decrease quality of care overall and leave many vulnerable Americans without access to primary care. It is high time these restrictions are seen for what they are: a capitulation to the interests of physicians’ associations."
Buerhaus also quotes a 2015 comment from the great health care economist Uwe Reinhardt, who died late last year. Reinhardt said:
"The doctors are fighting a losing battle. The nurses are like insurgents. They are occasionally beaten back, but they’ll win in the long run. They have economics and common sense on their side." 
In this arena, it would be nice if economics and common sense could win out a little faster.

Wednesday, October 10, 2018

How Best to Reintegrate Ex-Prisoners?

"Two-thirds of those released from prison in the United States will be re-arrested within three years, creating an incarceration cycle that is detrimental to individuals, families, and communities." So writes Jennifer L. Doleac in "Strategies to productively reincorporate the formerly-incarcerated into communities: A review of the literature" (posted on SSRN, July 21, 2018), Doleac's approach is straightforward: look at the studies. In particular, look at fairly recent studies done since 2010 that use a "randomized controlled trial" approach--that is, an approach where a group of participants are randomly assigned either to receive a particular program or not to receive it. When this approach is carried out effectively, comparing the "treatment group" and the "control group" provides a reasonable basis for drawing inferences about what works and what doesn't.

Here's a list of the interventions on which Doleac finds some fairly recent studies using randomized controlled trial approaches. Some of the studies focus on recidivism, while others look at outcomes like employment or gaining additional education. 

I'll let you read Doleac's literature review for details of individual studies. But I'll just notice here that this kind of list does not seek to respect what one expects or hopes might be true. 

For example, the "bad bets" at the bottom all have their advocates. But based on the evidence, Doleac writes concerning these programs: 
"Many programs focus on increasing employment for people with criminal records, with the hope that access to a steady job will prevent reoffending. This topic has been studied more than others, and the research results are mixed. Transitional jobs programs provide temporary, subsidized jobs and soft-skills training to those trying to transition into the private sector workforce. multiple rigorous studies show that transitional jobs programs are ineffective at increasing post-program employment, and have little to no effect on recidivism. ...

"Ban the Box policies seek to increase access to employment by prohibiting employers from asking about criminal records until late in the hiring process. Research shows that Ban the Box policies are ineffective at increasing employment for people with criminal records,and have the unintended consequence of reducing employment for young black men withoutcriminal records (because employers assume that applicants from this group are more likely to have a record when they cannot ask directly). The net effect is a reduction in employment for young, low-skilled black men--the opposite of what proponents of this policy hoped to achieve. ... 
"Given the array of challenges faced by people who cycle through the criminal justice system, a popular approach is to try to address many needs at once. Two evaluations of highly-respected reentry programs providing wrap-around services found little to no effect on subsequent recidivism. More recently, two large-scale evaluations of federal programs funding wrap-around services in communities across the country both found increases in recidivism for the treatment groups. ... Together, these studies suggest that these multi-faceted, labor-intensive (and thus expensive) interventions may be trying to do too much and therefore do not do anything well. Since this is a popular approach in cities and counties across the country, leaders should be skeptical about the effectiveness of their current programs."
Conversely, here are some comments on what seems most promising, based on the actual studies. From Doleac:
"Court-issued rehabilitation certi ficates can be presented to employers as a signal of recipients' rehabilitation. One study found that court-issued certi ficates increased access to employment for individuals with felony convictions. This could be because they provide valuable information to employers about work-readiness, or because employers perceive the court-issued certi ficates as protection against negligent hiring lawsuits. In either case, this strategy is promising and worth further study. The effect on recidivism is currently unknown. ...
"A large share of people who are arrested and incarcerated suffer from mental illness, and many more are hindered by emotional trauma and poor decision-making strategies. Therapy and counseling could have a meaningful impact on the successful reintegration of these individuals. Programs focused on mental health include cognitive behavioral therapy (CBT) and multisystemic therapy (MST). A growing body of evidence supports CBT as a cost-effective intervention, though the evidence on MST is more mixed and may be context-dependent. In both cases, it is unclear how much effectiveness will fall if programs are scaled up to serve more people: if they require highly-trained psychologists to conduct the sessions, the scalability will be limited. ...

"Diverting low-risk offenders to community supervision instead of incarceration appears to be highly effective. Electronic monitoring is used as an alternative to short incarceration spells in several countries, and in those contexts has reduced recidivism rates and increased economic well-being and educational attainment. Court deferrals--which allow low-risk, non-violent felony defendants to avoid a conviction if they successfully complete probation--reduce recidivism rates and increase employment. And an innovative diversion program for non-violent juvenile offenders that provides group mentoring and instruction in virtue theory was shown to reduce recidivism relative to standard diversion to community service. ...
"Many people coming out of jail or prison may benefit from government or community support, but many others might be better off if we left them alone. (This is especially likely if the programs they would be referred to are not effective.) A diverse set of high-quality studies consider the effects of reducing the intensity of community supervision. All found that reducing intensity of supervision (for example, requiring fewer meetings or check-ins with probation officers) has no impact on recidivism rates, and that it actually reduces recidivism for low-risk boys (age 15 or younger). That is, for less money, and less hassle to those who are court-supervised, we could achieve the same and even better public safety outcomes. This approach is worth exploring in a variety of contexts, and appears to be effective for high-risk as well as low-risk offenders. ... At this point, there is substantial evidence, from a variety of contexts, that increasing the intensity of community supervision has no public safety benefi ts and in some cases increases recidivism. It is also more expensive. It is unclear what the optimal amount of supervision is for various types of offenders, but it's clearly lower than current levels. ... 
"[A]nother policy that has great potential to reduce recidivism and incarceration
rates is expanding DNA databases. Two studies show that those charged or convicted of
felonies are dramatically less likely to reoffend when they are added to a government DNA database, due to the higher likelihood that they would get caught. Deterring recidivism in this way is extremely cost-effective, and reveals that many offenders do not need additional supports to stay out of trouble."
Doleac emphasizes that the evidence on many of these programs is not as strong as one might prefer, and there is certainly room for more research. But I would add that those looking to go beyond research and enact a wide-ranging alteration of policies should be considering the existing research, too.  

Monday, October 8, 2018

Boglehead Wisdom

The Bogleheads believe in Jack Bogle, who "founded Vanguard in 1974 and introduced the first index mutual fund in 1975." An index fund seeks only to mimic the average market return, and thus can do so at very low cost. In contrast, an "active" fund looks for ways to beat the market, through picking certain stocks or timing movements in the market, but also charges higher fees. 

Jason Zweig reports on a conference of Bogleheads in "Jack Bogle’s Bogleheads Keep Investing Simple. You Should Too," in the Wall Street Journal, October 5, 2018. The part of the article that especially caught my eye was "The Wit and Wisdom of Jack Bogle," a collection of comments from Bogle over the years. Here they are:
  • "In the field of investment management, nearly all of those experts whom we identify as stars prove to be comets. Rather than being eternal beacons of light, most managers live a transitory existence, illuminating the financial firmament for but a brief moment in time, only to flame out, their ashes drifting gently down to earth. Of course, some outstanding managers remain, but history tells us that they are the exception that proves the rule."
  • "I don’t like the word `never' when it comes to the stock market."
  • "In the fund business, you get what you don’t pay for."
  • "Over the long run, a percentage point increase in volatility is meaningless; a percentage point increase in return is priceless."
  • "It is investor emotions, often inexplicable for individual stocks and for the market alike, that drive the market in the short run, and sometimes for remarkably extended periods. But not forever."
  • "We must base our asset allocation not on the probabilities of choosing the right allocation, but on the consequences of choosing the wrong allocation."
  • "While rational expectations can tell us what will happen... they can never tell us when.:
  • “I built a career out of knowing what I don’t know.”
There is strong evidence that for the average investor, with no special inside knowledge, Indeed, the legendary active investor Warren Buffett has instructions in his will that the money he is leaving to his wife should be invested in a low-cost index fund. Buffett explained a few years ago:
Most investors, of course, have not made the study of business prospects a priority in their lives. If wise, they will conclude that they do not know enough about specific businesses to predict their future earning power.
I have good news for these non-professionals: The typical investor doesn’t need this skill. In aggregate, American business has done wonderfully over time and will continue to do so (though, most assuredly, in unpredictable fits and starts). ... The goal of the non-professional should not be to pick winners – neither he nor his “helpers” can do that – but should rather be to own a cross-section of businesses that in aggregate are bound to do well. A low-cost S&P 500 index fund will achieve this goal.
That’s the “what” of investing for the non-professional. The “when” is also important. The main danger is that the timid or beginning investor will enter the market at a time of extreme exuberance and then become disillusioned when paper losses occur. ... The antidote to that kind of mistiming is for an investor to accumulate shares over a long period and never to sell when the news is bad and stocks are well off their highs. Following those rules, the “know-nothing” investor who both diversifies and keeps his costs minimal is virtually certain to get satisfactory results. Indeed, the unsophisticated investor who is realistic about his shortcomings is likely to obtain better long-term results than the knowledgeable professional who is blind to even a single weakness. ...
My money, I should add, is where my mouth is: What I advise here is essentially identical to certain instructions I’ve laid out in my will. One bequest provides that cash will be delivered to a trustee for my wife’s benefit. ... My advice to the trustee could not be more simple: Put 10% of the cash in short-term government bonds and 90% in a very low-cost S&P 500 index fund. (I suggest Vanguard’s.) I believe the trust’s long-term results from this policy will be superior to those attained by most investors – whether pension funds, institutions or individuals – who employ high-fee managers.
I think this advice boils down to: "If you aren't Warren Buffett, or at least a pale imitation of Warren Buffett, you should think seriously about being a Boglehead."


Economics Nobel 2018: William Nordhaus and Paul Romer

Both William Nordhaus and Paul Romer are deserving of a Nobel Prize in Economics, but I was not expecting them to win it during the same year. The Nobel committee found a way to glue them together. Nordhaus won the prize "“for integrating climate change into long-run macroeconomic analysis," while Romer won the prize “for integrating technological innovations into long-run macroeconomic analysis.” Yes, the words "climate change" and "technological innovations" might seem to suggest that they worked on different topics. But with the help of "integrating ... into long-run macroeconomic analysis," Nordhaus and Romer are now indissolubly joined as winners of the 2018 Nobel prize.

Each year, the Nobel committee releases two essays describing the work of the winner: for the general reader, they offer "Popular Science Background: Integrating nature and knowledge into economics"; for those who speak some economics and don't mind an essay with some algebra in the explanations, there is "Scientific Background: Economic growth, technological change, and climate change." I'll draw on both essays here. But I'll take the easy way out and just discuss the two authors one at a time, rather than trying to glue their contributions  together. 

Back in the 1970s, the federal government had just recently taken on a primary role in setting and enforcing environmental laws, with a set of amendments in 1970 that greatly expanded the reach of the Clear Air Act and another set of amendments in 1972 that greatly expanded the reach of the Clean Water Act. As far back as the mid-1970s, William Nordhaus was estimating models of energy consumption that explored the lowest-cost ways of keeping  COconcentrations low in seven different "reservoirs" of carbon: "(i) the troposphere (<' 10 kilometers), (ii) the stratosphere, (iii) the upper layers of the ocean (0–60 meters), (iv) the deep ocean (> 60 meters), (v) the short-term biosphere, (vi) the long-term biosphere, and (vii) the marine biosphere."

By the early 1990s, Nordhaus was creating what are called "Integrated Assessment Models," which have become the primary analytical tool for looking at climate change. An IAM breaks up the task of analyzing climate change into three "modules", which the Nobel committee describes in this way: 
A carbon-circulation module This describes how global COemissions influence CO concentration in the atmosphere. It reflects basic chemistry and describes how COemissions circulate between three carbon reservoirs: the atmosphere; the ocean surface and the biosphere; and the deep oceans. The module’s output is a time path of atmospheric CO concentration. 
A climate module This describes how the atmospheric concentration of COand other greenhouse gases affects the balance of energy flows to and from Earth. It reflects basic physics and describes changes in the global energy budget over time. The module’s output is a time path for global temperature, the key measure of climate change. 
An economic-growth module This describes a global market economy that produces goods using capital and labour, along with energy, as inputs. One portion of this energy comes from fossil fuel, which generates COemissions. This module describes how different climate policies – such as taxes or carbon credits – affect the economy and its CO emissions. The module’s output is a time path of GDP, welfare and global CO emissions, as well as a time path of the damage caused by climate change. 
A number of different IAMs now exist. The usefulness of the framework is that one can plug in a range of assumptions--how much energy will an economy use, how will this affect CO2 in the atmosphere, how will it affect overall climate--and develop a sense of what factors or assumption matter most or least. These are quantitative models: that is, you can plug in a policy like a carbon tax, and then trace through its economic and environmental effects, and consider costs and benefits. Nordhaus offers a readable overview of how this work has developed here, with citations to the underlying academic references. 

When I was first being indoctrinated into economics in the late 1970s, the prevailing theories of economic growth were based on the work of Robert Solow (Nobel '87). A couple of implications of Solow's model are relevant here. One is that in Solow's approach, the researcher calculated increases in inputs of labor and capital for an economy, and then figured out whether those rising inputs of labor and capital could plausibly explain the overall rise in the overall amount of economic output. In these calculations for the US economy, economic output was rising faster than could be explained by the growth of labor and capital and so the additional residual amount was said to have resulted from a change in "productivity" or "technology" which needed to be understood in the broadest sense to include not just explicit scientific inventions, but all ways of rearranging inputs to get more output.

This approach was clearly useful, and also clearly limited. Another economists (Moses Abramowitz) liked to say that because it measured technology as the leftover residual from what could not be explained through increases in labor and capital, the discussion of productivity that resulted was "a measure of our ignorance." Others sometimes referred to economic growth in this theory as "manna from heaven," falling upon the economy without much explanation. Others said that technology in this model was a "black box"--meaning that the question of how new technology was created was assumed rather than argued.

Solow and other growth theorists working with this approach did derive some predictions about rates of economic growth. For example, they argued that growth depended on rates of investment, and that economies would experience diminishing returns as their capital stock increased. Thus, a low-income country with a low level of capital stock would have higher returns from investment than a high level of capital stock. 

But as Paul Romer noted when he began working on technology and economic growth the 1980s, this theory of productivity growth seemed inadequate. There were many examples of low-income countries that were growing quickly, but also many examples of low-income countries growing moderately, slowly, or even negatively. Something more than capital investment seemed important here. In addition,

From the Nobel "popular science" report:
"Romer’s biggest achievement was to open this black box and show how ideas for new goods and services – produced by new technologies – can be created in the market economy. He also demonstrated how such endogenous technological change can shape growth, and which policies are necessary for this process to work well. Romer’s contributions had a massive impact on the feld of economics. His theoretical explanation laid the foundation for research on endogenous growth and the debates generated by his country-wise growth comparisons have ignited new and vibrant empirical research. ...
"Romer believed that a market model for idea creation must allow for the fact that the production of new goods, which are based on ideas, usually has rapidly declining costs: the frst blueprint has a large fxed cost, but replication/reproduction has small marginal costs. Such a cost structure requires that frms charge a markup, i.e. setting the price above the marginal cost, so they recoup the initial fxed cost. Firms must therefore have some monopoly power, which is only possible for sufciently excludable ideas. Romer also showed that growth driven by the accumulation of ideas, unlike growth driven by the accumulation of physical capital, does not have to experience decreasing returns. In other words, ideas-driven growth can be sustained over time."
Romer's approach is often describe as an "endogenous growth" model. The earlier Solow-style approach demonstrated the critical importance of growth in technology and productivity, by showing that it was impossible to explain actual long-run macroeconomic patterns without taking them into account.  A Romer-style approach then seeks to explore the determinants of growth, with an emphasis on the economic power of producing and using ideas.
Oddly enough, Nordhaus and Romer published essays on the topics that won the Nobel prize in consecutive issues of the Journal of Economic Perspectives in Fall 1993 and Winter 1994 (full disclosure: where I have worked as Managing Editor of JEP since the start of the journal in 1987). For those who want a dose of the old stuff: