Thursday, November 30, 2017

The Family Options Experiment: Reducing Homelessness with Long-Term Rent Subsidies

What policy steps might offer at least a medium-term solution for homelessness affecting families with children? The Family Options Study is a randomized experiment run by the US Department of Housing and Urban Development that sought to address this topic. As it explains at the website:
Between September 2010 and January 2012, a total of 2,282 families (including over 5,000 children) were enrolled into the study from emergency shelters across twelve communities nationwide and were randomly assigned to one of four interventions: 1) subsidy-only – defined as a permanent housing subsidy with no supportive services attached, typically delivered in the form of a Housing Choice Voucher (HCV); 2) project-based transitional housing – defined as temporary housing for up to 24 months with an intensive package of supportive services offered on-site; 3) community-based rapid re-housing – defined as temporary rental assistance, potentially renewable for up to 18 months with limited, housing-focused services; or 4) usual care – defined as any housing or services that a family accesses in the absence of immediate referral to the other interventions. Families were followed for three years following random assignment, with extensive surveys of families conducted at baseline and again approximately 20 and 37 months after random assignment.
The results are discussed in a symposium of 15 short commentaries appearing in Cityscapes (2017, 19:3), a journal published online by the US Department of Housing and Urban Development. Here are some comments from the introduction to the symposium written by Anne Fletcher and Michelle Wood, "Next Steps for the Family Options Study."
"Family homelessness is dynamic, with families moving in and out of homeless assistance programs every day. Throughout the year in 2015, nearly 155,000 families with children, representing more than 500,000 adults and children, accessed the homeless assistance system (Solari et al., 2016). Over the years, divergent theories about the cause(s) of family homelessness have led to the rise of different types of interventions designed to address the problem. One theory holds that, whatever other challenges a family may face, homelessness is purely an economic problem—housing costs surpass the incomes of poor families—and housing assistance alone can resolve it. Another theory posits that, whereas housing assistance is indeed crucial, family homelessness is the result of other challenges (such as child welfare engagement, mental health or substance abuse challenges, or unemployment), which must be addressed in order to end families’ homelessness. In addition to these two broad theories on the causes of homelessness, evidence that at least some families experiencing homelessness will eventually secure housing without assistance has led to two schools of thought on appropriate policy, with some arguing that the need for access to assistance is permanent, and others arguing that it need be only temporary. ...

"The results of the Family Options Study offer striking evidence of the power of offering a long-term rent subsidy to a homeless family in shelter, substantially increasing housing stability and yielding benefits across a number of important domains, including reductions in residential moves, child separations, adult psychological distress, experiences of intimate partner violence, food insecurity, and school mobility among children, although those benefits were accompanied by reductions in work effort. These findings provide support for the notion that family homelessness is largely an economic issue, and that, by solving the economic issue, families experience additional benefits that extend beyond housing stability. Equally notable is the fact that these significant benefits that accrued to the families offered a long-term rent subsidy were achieved at a comparable cost to other interventions tested, which offered few positive outcomes for families in any domain. ...

"The study findings suggest that families who experience homelessness can successfully use and retain housing vouchers, and that by doing so families experience significant benefits in a number of important domains. Importantly, the study also demonstrates a compelling set of positive outcomes that directly benefit the children in families offered a long-term rent subsidy, including reductions in child separations (observed at 20 months); psychological distress of the family head (observed at both time points); economic stress (observed at both time points); intimate partner violence (observed at both time points); school mobility (observed at both time points); behavior problems and sleep problems of children (observed at 37 months); and food insecurity (observed at both time points). ... The striking impacts ... provide support for the view that, for most families, homelessness is a housing affordability problem that can be remedied with long-term housing subsidies without specialized services."
Some caveats are in order. This study is focused on homeless families with children, not on homelessness affecting single adults. I am not aware of a specific cost-benefit study of these results, comparing how much the long-term rent subsidies cost, compared both with the level of public services typically used by families in homelessness and the additional benefits of this approach. But the evidence certainly suggests that it would make sense to transfer some of the current resources being used to assist homeless families into straightforward rent subsidies.


For some earlier discussions of homelessness on this blog, see


Wednesday, November 29, 2017

What's Next for Mass Transit?

For a deeply skeptical take on the future of rail-based mass transit, I recommend "The Coming Transit Apocalypse," by Randal O’Toole (Cato Institute #824, October 24, 2017). He writes (footnotes omitted):
With annual subsidies of $50 billion covering 76 percent of its costs, public transit may be the most heavily subsidized consumer-based industry in the country. Since 1970, the industry has received well over $1 trillion (adjusted for inflation) in subsidies, yet the number of transit trips taken by the average urban resident has declined from about 50 per year in 1970 to 39 per year today. Total transit ridership, not just per capita, is declining today, having seen a 4.4 percent drop nationwide from 2014 to 2016 and a 3.0 percent drop in the first seven months of 2017 versus the same months of 2016. ... 
Four trends that are likely to become even more pronounced in the future place the entire industry in jeopardy: low energy prices; growing maintenance backlogs, especially for rail transit systems; unfunded pension and health care obligations; and ride-hailing services. The last is the most serious threat, as some predict that within five years those ride-hailing services will begin using driverless cars, which will reduce their fares to rates competitive with transit, but with far more convenient service. This makes it likely that outside of a few very dense areas, such as New York City, transit will be extinct by the year 2030, leaving behind a huge burden of debt and unfunded obligations to former transit employees. ...
"After adjusting for inflation, transit agencies have spent more than $1.6 trillion on operations and improvements since 1970, while collecting less than $500 billion in fares.  Per passenger mile, transit is the nation’s most expensive and most heavily subsidized form of travel. In 2015, transit agencies spent an average of $1.14 per passenger mile, while Amtrak costs averaged nearly 60 cents, driving averaged about 26 cents, and flying averaged about 16 cents per passenger mile. Of those costs, transit subsidies averaged 87 cents per passenger mile, compared with about 30 cents for Amtrak and less than 2 cents for flying and driving."
O'Toole also mentions the more general problem that over time, jobs and housing have become more spread out across cities and suburbs, which makes it harder for mass transit to function. Indeed, one useful question to ask of any mass transit system is whether people can get just about everywhere they need to go, with relatively little need for a car or a lot of taxi or Uber rides, or whether the transit system mainly helps people from the suburbs get in and out of the city some of the time--while driving the rest of the time.

Some degree of subsidy for mass transit would be all right, if it paid for reductions in pollution and traffic congestion. But even the relatively large subsidies aren't coming close to covering the costs for mass transit. Rail-based mass-transit needs ongoing repairs and maintenance, along with a major rebuilding every 30 years or so. Moreover, a number of transit systems are racking up large unfunded liabilities for future pension and health care payments. When push comes to shove, it often seems politically easier to open a new station or make flashy and visible improvements, rather than doing the nuts and bolts of physical maintenance and updating, or funding future costs to retirees. Here's some detail from O'Toole:

"In 2010, the Federal Transit Administration (FTA) estimated that the nation’s transit industry had a maintenance backlog of $77.7 billion ($87 billion in 2016 dollars).  The agency added that the backlog was growing because transit agencies weren’t spending enough on maintenance to keep their systems in their current conditions, much less to reduce the repair backlog. In 2015, the Department of Transportation estimated that the backlog had indeed grown to $89.8 billion ($95 billion in 2016 dollars), which was probably a conservative estimate. To eliminate the backlog in 20 years, the department calculated, 100 percent of funds now being spent on improvements would have to be shifted to maintenance ... 
"Rail infrastructure has an expected life of about 30 years and must be thoroughly rebuilt or rehabilitated at the end of that time or risk suffering numerous delays, accidents, and other problems. ... The original lines of the Washington Metrorail system turned 30 in 2006. Soon after that, riders began experiencing episodes of smoke in the tunnels, forcing the agency to stop and evacuate the trains. By 2013, such incidents were happening twice a month, and the agency had discovered they were caused by water in leaky tunnels short-circuiting fiberglass insulators in the third-rail power system, causing them to catch fire. In 2009, a train collision that killed nine people was blamed
on poorly maintained signaling systems.  As early as 2002, the Washington Metropolitan Area Transit Authority (WMATA) warned that the agency would need to spend more than $12 billion on maintenance in the next few years to prevent such problems. The system “stands at the precipice of a fiscal and service crisis,” the agency predicted. But neither the federal government, which had paid for most of the costs of building the system, nor local governments, which paid for most of the costs of operating it, stepped up to pay for maintenance. Today, WMATA’s general manager says the system has “$25 billion of unfunded capital needs. ...
"Boston’s Massachusetts Bay Transportation Authority and Sacramento’s Regional Transit District both have unfunded obligations that are more than double their operating budgets. The Maryland Transit Administration, New York’s Metropolitan Transportation Authority, Portland’s Tri-Met, and the Washington Metropolitan Area Transportation Authority all have unfunded obligations larger than their annual operating budgets. The Southeast Pennsylvania Transportation Authority (SEPTA) and Rochester Regional Transit Service (RTS) both have unfunded health care obligations that are nearly as large as their operating budgets and, when pension obligations are added, are likely to be larger. Most of these agencies also have large debts and/or maintenance backlogs.
What about mass transit as a way of helping mobility for the poor? Of course, this argument only works if the transit system is sufficiently widespread and reliable. But moreover, O'Toole argues: 
"Census data reveal that a higher percentage of people who earn more than $75,000 a year take transit than any other income class. To the extent people believe that low-income people can benefit from transportation assistance, such assistance should be in the form of vouchers (similar to food stamps) that can be used with any transportation provider, from a ride-hailing service to an airline."
What does O'Toole's recommend?
"[T]ransit agencies should begin to prepare for an orderly phase-out of publicly funded transit services as affordable, shared driverless cars become available in the next decade. This means the industry should stop building new rail lines; replace most existing rail lines with buses as they wear out; pay down debts and unfunded obligations; and target any further subsidies to low-income people rather than continue a futile crusade to attract higher-income people out of their cars."
Even I, gloomster though I am, am not as gloomy about mass transit as O'Toole. But the neglect of physical maintenance, the lack of planning and funds for needed large-scale updating, and the accumulation of  unfunded liabilities are real problems. I'm also a much bigger fan of buses than rail for most cities (remembering that buses can run both on dedicated lanes and also on regular streets). Also, I'm not as confident as O'Toole that driverless cars are right around the corner. But a different technological possibility that is very near is a network of ride-sharing vans, perhaps with a capacity of about 10 people each, whose routes would be continually updated, coordinated and optimized. For a study of the possibilities of such a system in the context of New York City, see the article by Javier Alonso-Mora, Samitha Samaranayake,  Alex Wallar,  Emilio Frazzoli,  and Daniela Rus, "On-demand high-capacity ride-sharing via dynamic trip-vehicle assignment," Proceedings of the National Academy of Sciences (2017, 114 (3) 462-467; published ahead of print January 3, 2017). 

Tuesday, November 28, 2017

Asset Prices and the Real Economy

Back in the late 1990s there was a mini-argument about whether something should be done about the run-up in the stock market. As a reminder, the Dow Jones Industrial Average was at about 4,000 in spring 1995, but reached 11,700 by January 2000. On one side, there was an argument that financial regulators or the central bank should do something to slow down or limit the rise. On the other side, the standard argument at the time (with which I agreed) was that: 1) giving government the power to decide an "appropriate" level for the stock-market seemed unwise for several reasons; 2) acting to choke off the stock market raised a danger of creating a near-term recession; 3) even if/when the bubble burst, the effects of a stock market collapse on the real economy would be muted. Indeed, the 2001 recession was fairly shallow and only eight months long, and while unemployment continued to rise for a time after the recession had ended, the monthly rate peaked at 6.3%.

This earlier experience represented how many economists mostly thought about the relationship between asset prices and the economy at the turn of the 20th century. Sure, there was a connection from asset prices to the economy, and asset prices could display bubbles that inflated and burst. But a common feeling was that policymakers who were thinking about macroeconomic policy shouldn't become too distracted by the fizzing and popping of asset markets or housing prices, and should instead focus on the real economy of output and unemployment rates.

The Great Recession of 2007-2009 showed the deep inadequacy of that kind of thinking. In particular, it showed that even if rises and falls in stock market prices should not be a top public policy priority (because for many owners of stock, paper gains and losses have only a modest effect on their other economic behavior), when asset market involve debt, housing prices, foreclosures and bankruptcies, and the banking sector, a crash in asset prices (like housing and housing-related financial instruments) can bring on a deep recession. 

For those wishing to get up to speed on the issues of asset prices and the real economy, Stijn Claessens and M. Ayhan Kose  offer a useful overview in "Asset prices and macroeconomic outcomes: a survey" (November 2017, Bank for International Settlements, Working Papers No 676).

There is of course a two-way interaction here: asset prices respond to changes in the real economy, and the real economy responds to changes in asset prices. But there's a lot of work to be done in spelling out these connections.

Assets prices fluctuate a lot, and more than real activity. Here's a figure from the report showing the average patterns of output, stock market prices, and housing prices for a group of 18 countries over the period from 1973-2011. The "zero" on the horizontal axis is when a recession started, so the figure shows the average patterns before and after the start of the recession. Notice that in a typical recession, the level of output falls by about 4%, but the average stock market decline (which usually starts before the actual recession) sees some quarters where the decline from the previous year is more like 30%. Housing prices typically fall in recessions, too. The question of why asset prices should move so much, given that these patterns have been common across a large number of countries and thus seem reasonably predictable, is not clear.


The interactions between these movements in asset prices and actual decisions by consumers and firms is not clearly understood, either. The writers note:
"[I]nvestment and consumption respond differently to asset prices from what standard models would suggest, with a larger role for “non-price factors” in driving agents’ behaviour and macroeconomic aggregates. Firm investment reacts less strongly to asset prices than predicted by models while household consumption reacts more vigorously to changes in asset prices, especially house prices, than consumption-smoothing models would suggest. In addition, the links between asset prices and macroeconomic outcomes appear to vary across countries depending on financial, institutional and legal structures. Research also questions the strength of the direct impact of interest rate changes on activity and highlights its dependence on the state of the economy and the financial sector, and institutional arrangements. Recent studies emphasize the importance of uncertainty (measured among others by the volatility of asset prices) in explaining macroeconomic outcomes."
Just to complicate matters one step further, the Great Recession also brought the widespread further complicated by the use of unconventional monetary policies like quantitative easing and even negative policy interest rates, as well as by international dimensions of policy like how movements of interest rates across countries can lead to fluctuations in exchange rates and even a risk of international debt crises.
"Many current policy questions focus on macrofinancial linkages. These include the implications of UMPs [unconventional monetary policies] for the real  economy and financial markets, including overall financial stability. A better assessment of the role played by monetary policy during a liquidity trap and the implications of UMPs on activity are of essential interest. In addition, the role of the exchange rate as a monetary policy target (possibly in addition to the inflation rate) needs further investigation, especially for the design of policies in small open economies and EMEs [emerging market economies]."
When I think about dangers faced by the US economy, I find that I no longer worry much about a rise in inflation, which would have been one of my main 20th century concerns, and now I worry instead about whether a potential crisis is lurking in the nooks and crannies of the financial system.

Monday, November 27, 2017

Progressive Redistribution: What's Happened? What's Next?

Is the rise in economic inequality around the world during the last few decades mainly a matter of economic forces that have affected wages, or a matter of political forces that reduced the extent of redistribution? What are the long-term patterns across the world in income redistribution? Does more redistribution happen in the more unequal countries?

Peter H. Lindert tackles these questions and others in "The Rise and Future of Progressive Redistribution," published as Working Paper 73 by the Commitment to Equity Institute at Tulane University (October 2017). This is a background paper for the Angus Maddison Development Lecture that Lindert recently delivered at an OECD conference.  Here's his summary of the findings:
(1) In every country supplying adequate data, government budgets have shifted resources progressively, from the rich to the poor, within the last hundred years. Before World War I, very little was redistributed through government, mainly because government was so small, due in turn to poverty, lack of state capacity, and lack of mass suffrage. 
(2) For all that has been written about a shift of political sentiments and government policy away from progressivity since the late 1970s, no such trend is clear yet, pending research on more countries. A slow sustained rise in progressivity shows up in data from the United States, Argentina, and Uruguay. Among democratic welfare states, the closest thing to a demonstrable reversal against Robin Hood is the slight retreat in Sweden since the 1980s. Globally, the most dramatic swing since the late 1970s has been Chile’s record-setting return toward progressivity after the regressivity of Pinochet.
(3) Adding the effects of rising public education subsidies on the later equalization of adult earning power strongly suggests that a fuller, longer-run measure of fiscal incidence would reveal a history of still greater shift toward progressivity. This revision has its greatest impact in Japan, Korea, and Taiwan, which have excelled in raising lower ranks’ earning power through primary and secondary education, but have offered little in direct transfers to the poor.
(4) Finding that redistribution of government budgets has continued to march slowly toward progressivity carries a strong implication for our interpretation of the rise in income inequality since the 1970s, so firmly established by the World Top Incomes Project and by Thomas Piketty (2014). That rise may owe nothing to a net shift in government redistribution toward the rich, despite the lowering of top tax rates. If so, it is all the more important to explore what non-fiscal forces have widened gaps in market incomes around the world.
(5) The stability or slow advance in net fiscal progressivity since the late 1970s has not matched the rise in overall social transfers, because less-progressive public pension benefits have risen as a share of transfers, and of GDP, in most countries. That is, social insurance policy has betrayed a mission drift away from investing in children and working-age adults, and toward accepting rising pension bills. This mission drift toward the elderly implies a missed opportunity for pro-growth leveling of income.
Let me add  few points from the main text of the paper that seemed worth reemphasizing. Here's a figure showing the extent inequality before redistribution (shown on the horizontal axis) and after redistribution (shown on the vertical axis). The upward-sloping line shows what would happen if redistribution was zero; thus the fact that all countries are below the line shows that inequality is lower after tax and spending policy than before.

For example, you can see in the upper right that Honduras, Colombia, and Brazil all started with similar levels of inequality, but Brazil did more to redistribute income. Indeed, many of the "green box" Latin American countries have relatively high levels of inequality to start, and do relatively little about it. At the lower left, countries like Korea and Japan started of with relatively low levels of inequality, and also did relatively little to reduce inequality (that is, the points are close to the upward-sloping line). The "black dot" countries of western Europe started with middling levels of inequality, and did a lot of redistribution. The US starts with  a somewhat above-average level of inequality, and makes a below-average effort to reduce it.

A shortcoming of this figure is that it focuses on data from a single recent year. Thus, it doesn't look at the role of education in reducing inequality over time. Lindert discusses this point at some length. He writes: 
"Many studies of fiscal redistribution have already quantified a same-year effect of public subsidies to education, yet none has treated the larger deferred effects. The studies of the United States, Sweden, and Latin America do include a same-year effect, as if the benefits of taxpayers’ paying for your (say) fifth-grade education accrue to your parents this year and not to you, the student, any time in the future. Convention has thus equated public education with babysitting. As convenient as this convention may be, it misses most of what public education spending does to the different income ranks. ...
Public spending on education affects the inequality of later pre-fisc earnings, and the progressivity of government’s contribution to reducing that inequality, through two channels. One is that a rise in inequality of adults’ accumulated schooling should directly widen the inequality of their earnings. The other is that a rise in their average schooling should bid down skilled-wage premiums, again reducing the inequality of earnings or of income. While it is not easy to trace these inequalities in education subsidies and in final earnings, this strong link should be pursued, given that the international literature on social rates of return to schooling shows consistently high average rates."
Lindert lays out a range of categories for the relationship between education and inequality over time. In particular, he emphasizes looking at the ratio of spending per pupil on tertiary education vs. spending per pupil on preschool and primary education. In countries with universal education, like most high-income countries, this ratio is relatively low. In  countries of Latin America that have historically tended to fund college education for the well-to-do, and not much primary education for everyone else, this ratio looks pretty high.

Finally, Lindert fingers an uncomfortable culprit that is likely to exert pressure over time for less progressive social spending: that is, the aging of populations around the world. He writes:
"The only clear threat to progressive social spending comes from demography and politics. All populations are aging faster than careers are lengthening, thus raising the share of adult life spent in retirement. In addition, and perhaps in response, policy has shifted toward helping the elderly and keeping them out of poverty.  This does not necessarily threaten the progressivity in government treatment of the elderly themselves, but it definitely threatens to erode progressive social spending on children and adults under 65, hurting both progressivity and economic growth. The dangerous shift in priorities can be described either as a shift from investing in people for the long run to insuring them for the short run, or, in Martin Ravallion’s (2013) terminology, a shift from promotion to protection. ... 
"What trend can we foresee in this political mission drift toward favoring the elderly? The elderly share of the adult population will continue to rise. This demographic fact of life has a clear implication for providing for old age: As the share of elderly rises, their annual benefits past the age of 65 should not rise as fast as the average annual incomes of those of working age.
"This clear warning ... does not mean pensions have to drop in real purchasing power. Pensions should still keep ahead of the cost of living – it’s just that they cannot grow as fast as earned incomes per person of working age, which historically grow at about 1.8 percent a year, adjusting for inflation. ... Thus as long as consumption per elderly person keep in step with wage and salary rates, population aging threatens to raise the share of GDP devoted to subsidizing the elderly. To avoid paying for this with an upward march in tax rates, or with cutbacks in public spending on more productive – and progressive -- investments in the young, society needs to trim the relative generosity of annual pension subsidies."
There are many possible takeaways from this analysis, but here are a few of mine: 1) The growth of economic inequality around the world is mainly about economic factors, not a political retreat from redistribution. 2) In the longer-term, addressing the underlying forces that generate inequality--in particular, unnecessarily high inequality of educational opportunity and achievement--is a powerful force. 3) Helping the elderly more is going to be increasingly popular for politicians, but a tradeoff is that it becomes harder to make social investments that will pay off in the long term. 

Friday, November 24, 2017

The Amazon Effect

One of the ongoing puzzles of the US economy in recent decades is why inflation has stayed so low. Even outgoing Fed Chair Janet Yellen has highlighted this puzzle. The "Amazon effect" may be part of the answer: basically, the Amazon effect is that a higher level of competitive pressure from the rising level of on-line retail sales is holding back price increases that might otherwise have occurred.

Here's a figure illustrating the potential force of the Amazon effect, put together by Kevin L. Kliesen at the St. Louis Fed. As the captions above the blue line show, e-commerce was 2.8% of retail sales, but has now risen to 10.4%. The blue line itself shows the price level for those items purchased via e-commerce, using 2009 as a base year. For example, from 2000 to 2009 this price index rose from a little above 90 to 100, implying an inflation rate for these goods of about 1% per year. But since 2009, the price index for goods purchased via e-commerce has actually been declining by about 1% per year.


It's interesting to consider the possibility that the falling prices for e-commerce retail may not be a pure deflation of prices. It might also reflect cost savings delivered because buying through increasing automated warehouses is becoming more cost-efficient, compared with standard wholesale and retail product chains.

For those who want details on this price index, it's the is the price deflator for “Electronic Shopping/Mail-Order Houses” produced by the US Bureau of Economic Analysis. It's in Table 7U. Chain-Type Price Indexes for BEA Retail and Food Services Sales, available here.

Of course, a 1% annual price decline on 10% of retail sales cannot, by itself, explain why overall inflation for the entire economy has remained so low. But if you allow for the possibility that e-commerce prices can also place pressure on bricks-and-mortar retailers to limit their own price increases, the Amazon effect could be a meaningful part of an overall explanation.

Thursday, November 23, 2017

The Origins of Thanksgiving as an Official Holiday

Thanksgiving is a day for a traditional menu, and I take a holiday by reprinting this annual column on the origins of the day:

The first presidential proclamation of Thanksgiving as a national holiday was issued by George Washington on October 3, 1789. But it was a one-time event. Individual states (especially those in New England) continued to issue Thanksgiving proclamations on various days in the decades to come. But it wasn't until 1863 when a magazine editor named Sarah Josepha Hale, after 15 years of letter-writing, prompted Abraham Lincoln in 1863 to designate the last Thursday in November as a national holiday--a pattern which then continued into the future.

An original and thus hard-to-read version of George Washington's Thanksgiving proclamation can be viewed through the Library of Congress website. The economist in me was intrigued to notice that some of the causes for giving of thanks included "the means we have of acquiring and diffusing useful knowledge ... the encrease of science among them and us—and generally to grant unto all Mankind such a degree of temporal prosperity as he alone knows to be best."

Also, the original Thankgiving proclamation was not without some controversy and dissent in the House of Representatives, as an example of unwanted and inappropriate federal government interventionism. As reported by the Papers of George Washington website at the University of Virginia.
The House was not unanimous in its determination to give thanks. Aedanus Burke of South Carolina objected that he “did not like this mimicking of European customs, where they made a mere mockery of thanksgivings.” Thomas Tudor Tucker “thought the House had no business to interfere in a matter which did not concern them. Why should the President direct the people to do what, perhaps, they have no mind to do? They may not be inclined to return thanks for a Constitution until they have experienced that it promotes their safety and happiness. We do not yet know but they may have reason to be dissatisfied with the effects it has already produced; but whether this be so or not, it is a business with which Congress have nothing to do; it is a religious matter, and, as such, is proscribed to us. If a day of thanksgiving must take place, let it be done by the authority of the several States.”

Here's the transcript of George Washington's Thanksgiving proclamation from the National Archives.
Thanksgiving Proclamation
By the President of the United States of America. a Proclamation.
Whereas it is the duty of all Nations to acknowledge the providence of Almighty God, to obey his will, to be grateful for his benefits, and humbly to implore his protection and favor—and whereas both Houses of Congress have by their joint Committee requested me “to recommend to the People of the United States a day of public thanksgiving and prayer to be observed by acknowledging with grateful hearts the many signal favors of Almighty God especially by affording them an opportunity peaceably to establish a form of government for their safety and happiness.”
Now therefore I do recommend and assign Thursday the 26th day of November next to be devoted by the People of these States to the service of that great and glorious Being, who is the beneficent Author of all the good that was, that is, or that will be—That we may then all unite in rendering unto him our sincere and humble thanks—for his kind care and protection of the People of this Country previous to their becoming a Nation—for the signal and manifold mercies, and the favorable interpositions of his Providence which we experienced in the course and conclusion of the late war—for the great degree of tranquillity, union, and plenty, which we have since enjoyed—for the peaceable and rational manner, in which we have been enabled to establish constitutions of government for our safety and happiness, and particularly the national One now lately instituted—for the civil and religious liberty with which we are blessed; and the means we have of acquiring and diffusing useful knowledge; and in general for all the great and various favors which he hath been pleased to confer upon us.
and also that we may then unite in most humbly offering our prayers and supplications to the great Lord and Ruler of Nations and beseech him to pardon our national and other transgressions—to enable us all, whether in public or private stations, to perform our several and relative duties properly and punctually—to render our national government a blessing to all the people, by constantly being a Government of wise, just, and constitutional laws, discreetly and faithfully executed and obeyed—to protect and guide all Sovereigns and Nations (especially such as have shewn kindness unto us) and to bless them with good government, peace, and concord—To promote the knowledge and practice of true religion and virtue, and the encrease of science among them and us—and generally to grant unto all Mankind such a degree of temporal prosperity as he alone knows to be best.
Given under my hand at the City of New-York the third day of October in the year of our Lord 1789.
Go: Washington
Sarah Josepha Hale was editor of a magazine first called Ladies' Magazine and later called Ladies' Book from 1828 to 1877. It was among the most widely-known and influential magazines for women of its time. Hale wrote to Abraham Lincoln on September 28, 1863, suggesting that he set a national date for a Thankgiving holiday. From the Library of Congress, here's a PDF file of the Hale's actual letter to Lincoln, along with a typed transcript for 21st-century eyes. Here are a few sentences from Hale's letter to Lincoln:
"You may have observed that, for some years past, there has been an increasing interest felt in our land to have the Thanksgiving held on the same day, in all the States; it now needs National recognition and authoritive fixation, only, to become permanently, an American custom and institution. ... For the last fifteen years I have set forth this idea in the "Lady's Book", and placed the papers before the Governors of all the States and Territories -- also I have sent these to our Ministers abroad, and our Missionaries to the heathen -- and commanders in the Navy. From the recipients I have received, uniformly the most kind approval. ... But I find there are obstacles not possible to be overcome without legislative aid -- that each State should, by statute, make it obligatory on the Governor to appoint the last Thursday of November, annually, as Thanksgiving Day; -- or, as this way would require years to be realized, it has ocurred to me that a proclamation from the President of the United States would be the best, surest and most fitting method of National appointment. I have written to my friend, Hon. Wm. H. Seward, and requested him to confer with President Lincoln on this subject ..."
William Seward was Lincoln's Secretary of State. In a remarkable example of rapid government decision-making, Lincoln responded to Hale's September 28 letter by issuing a proclamation on October 3. It seems likely that Seward actually wrote the proclamation, and then Lincoln signed off. Here's the text of Lincoln's Thanksgiving proclamation, which characteristically mixed themes of thankfulness, mercy, and penitence:

Washington, D.C.
October 3, 1863
By the President of the United States of America.
A Proclamation.
The year that is drawing towards its close, has been filled with the blessings of fruitful fields and healthful skies. To these bounties, which are so constantly enjoyed that we are prone to forget the source from which they come, others have been added, which are of so extraordinary a nature, that they cannot fail to penetrate and soften even the heart which is habitually insensible to the ever watchful providence of Almighty God. In the midst of a civil war of unequaled magnitude and severity, which has sometimes seemed to foreign States to invite and to provoke their aggression, peace has been preserved with all nations, order has been maintained, the laws have been respected and obeyed, and harmony has prevailed everywhere except in the theatre of military conflict; while that theatre has been greatly contracted by the advancing armies and navies of the Union. Needful diversions of wealth and of strength from the fields of peaceful industry to the national defence, have not arrested the plough, the shuttle or the ship; the axe has enlarged the borders of our settlements, and the mines, as well of iron and coal as of the precious metals, have yielded even more abundantly than heretofore. Population has steadily increased, notwithstanding the waste that has been made in the camp, the siege and the battle-field; and the country, rejoicing in the consiousness of augmented strength and vigor, is permitted to expect continuance of years with large increase of freedom. No human counsel hath devised nor hath any mortal hand worked out these great things. They are the gracious gifts of the Most High God, who, while dealing with us in anger for our sins, hath nevertheless remembered mercy. It has seemed to me fit and proper that they should be solemnly, reverently and gratefully acknowledged as with one heart and one voice by the whole American People. I do therefore invite my fellow citizens in every part of the United States, and also those who are at sea and those who are sojourning in foreign lands, to set apart and observe the last Thursday of November next, as a day of Thanksgiving and Praise to our beneficent Father who dwelleth in the Heavens. And I recommend to them that while offering up the ascriptions justly due to Him for such singular deliverances and blessings, they do also, with humble penitence for our national perverseness and disobedience, commend to His tender care all those who have become widows, orphans, mourners or sufferers in the lamentable civil strife in which we are unavoidably engaged, and fervently implore the interposition of the Almighty Hand to heal the wounds of the nation and to restore it as soon as may be consistent with the Divine purposes to the full enjoyment of peace, harmony, tranquillity and Union.
In testimony whereof, I have hereunto set my hand and caused the Seal of the United States to be affixed.
Done at the City of Washington, this Third day of October, in the year of our Lord one thousand eight hundred and sixty-three, and of the Independence of the United States the Eighty-eighth.
By the President: Abraham Lincoln
William H. Seward,
Secretary of State

An Economist Chews over Thanksgiving

As Thanksgiving preparations arrive, I naturally find my thoughts veering to the evolution of demand for turkey, technological change in turkey production, market concentration in the turkey industry, and price indexes for a classic Thanksgiving dinner. Not that there's anything wrong with that. [Note: This is an updated and amended version of a post that was first published on Thanksgiving Day 2011.]

The last time the U.S. Department of Agriculture did a detailed "Overview of the U.S. Turkey Industry" appears to be back in 2007, although an update was published in April 2014 . Some themes about the turkey market waddle out from those reports on both the demand and supply sides.

On the demand side, the quantity of turkey per person consumed rose dramatically from the mid-1970s up to about 1990, but then declined somewhat, but appears to have made a modest recovery in the last couple of years The figure below is from the Eatturkey.com website run by the National Turkey Federation.


On the production side, the National Turkey Federation explains: "Turkey companies are vertically integrated, meaning they control or contract for all phases of production and processing - from breeding through delivery to retail." However, production of turkeys has shifted substantially, away from a model in which turkeys were hatched and raised all in one place, and toward a model in which the steps of turkey production have become separated and specialized--with some of these steps happening at much larger scale. The result has been an efficiency gain in the production of turkeys. Here is some commentary from the 2007 USDA report, with references to charts omitted for readability:

"In 1975, there were 180 turkey hatcheries in the United States compared with 55 operations in 2007, or 31 percent of the 1975 hatcheries. Incubator capacity in 1975 was 41.9 million eggs, compared with 38.7 million eggs in 2007. Hatchery intensity increased from an average 33 thousand egg capacity per hatchery in 1975 to 704 thousand egg capacity per hatchery in 2007.
Some decades ago, turkeys were historically hatched and raised on the same operation and either slaughtered on or close to where they were raised. Historically, operations owned the parent stock of the turkeys they raised while supplying their own eggs. The increase in technology and mastery of turkey breeding has led to highly specialized operations. Each production process of the turkey industry is now mainly represented by various specialized operations.
Eggs are produced at laying facilities, some of which have had the same genetic turkey breed for more than a century. Eggs are immediately shipped to hatcheries and set in incubators. Once the poults are hatched, they are then typically shipped to a brooder barn. As poults mature, they are moved to growout facilities until they reach slaughter weight. Some operations use the same building for the entire growout process of turkeys. Once the turkeys reach slaughter weight, they are shipped to slaughter facilities and processed for meat products or sold as whole birds.
Turkeys have been carefully bred to become the efficient meat producers they are today. In 1986, a turkey weighed an average of 20.0 pounds. This average has increased to 28.2 pounds per bird in 2006. The increase in bird weight reflects an efficiency gain for growers of about 41 percent."
The 2014 report points out that the capacity of eggs per hatchery has continued to rise (again, references to charts omitted):
"For several decades, the number of turkey hatcheries has declined steadily. During the last six years, however, this decrease began to slow down. As of 2013, there are 54 turkey hatcheries in the United States, down from 58 in 2008, but up from the historical low of 49 reached in 2012. The total capacity of these facilities remained steady during this period at approximately 39.4 million eggs. The average capacity per hatchery reached a record high in 2012. During 2013, average capacity per hatchery was 730 thousand (data records are available from 1965 to present)."
U.S. agriculture is full of examples of remarkable increases in yields over perionds of a few decades, but they always drop my jaw. I tend to think of a "turkey" as a product that doesn't have a lot of opportunity for technological development, but clearly I'm wrong. Here's a graph showing the rise in size of turkeys over time from the 2007 report.


The production of turkey remains an industry that is not very concentrated, with three relatively large producers and then more than a dozen mid-sized producers. Here's a list of top turkey producers in 2015 from the National Turkey Federation:
Given this reasonably competitive environment, it's interesting to note that the price markups for turkey--that is, the margin between the wholesale and the retail price--tend to decline around Thanksgiving, which obviously helps to keep the price lower for consumers. Mildred Haley of the US Department of Agriculture spells this out in the "Livestock, Dairy, and Poultry Outlook" report of October 2017. The vertical lines in the figure show that the markups clearly fall around Thanksgiving.

In the past, the US turkey industry has at some times suffers from outbreaks of HPAI
(Highly Pathogenic Avian Influenza): for discussion of the 2015 outbreak, see the November 17, 2015 issue of the "Livestock, Dairy, and Poultry Outlook" from the US Department of Agriculture, Kenneth Mathews and Mildred Haley offer some details. But for Thanksgiving 2017, supply seems to have remained strong and turkey prices are down a bit.

For some reason, this entire post is reminding me of the old line that if you want to have free-flowing and cordial conversation at dinner party, never seat two economists beside each other. Did I mention that I make an excellent chestnut stuffing?

Anyway, the starting point for measuring inflation is to define a relevant "basket" or group of goods, and then to track how the price of this basket of goods changes over time. When the Bureau of Labor Statistics measures the Consumer Price Index, the basket of goods is defined as what a typical U.S. household buys. But one can also define a more specific basket of goods if desired, and since 1986, the American Farm Bureau Federation has been using more than 100 shoppers in states across the country to estimate the cost of purchasing a Thanksgiving dinner. The basket of goods for their Classic Thanksgiving Dinner Price Index looks like this:


The cost of buying the Classic Thanksgiving Dinner actually declined by a bit in 2017, falling to $49.12 from $49.87 in 2016. The top line of the graph that follows shows the nominal price of purchasing the basket of goods for the Classic Thanksgiving Dinner. The lower line on the graph shows the price of the Classic Thanksgiving Dinner adjusted for the overall inflation rate in the economy. The line is relatively flat, which means that inflation in the Classic Thanksgiving Dinner has actually been a pretty good measure of the overall inflation rate.


Thanksgiving is a distinctively American holiday, and it's my favorite. Good food, good company, no presents--and all these good topics for conversation. What's not to like?

Wednesday, November 22, 2017

The Dominance of Peoria in the Processed Pumpkin Market

As I prepare for a season of pumpkin pie, pumpkin bread (made with cornmeal and pecans), pumpkin soup (especially nice wish a decent champagne) and perhaps a pumpkin ice cream pie (graham cracker crust, of course),  I have been mulling over why the area around Peoria, Illinois, so dominates the production of processed pumpkin.

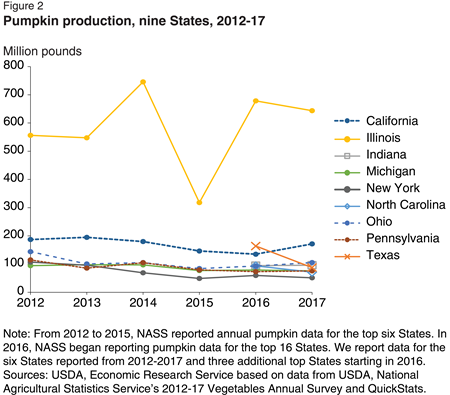
The facts are clear enough. As the US Department of Agriculture points out (citations omitted): In 2016, farmers in the top 16 pumpkin-producing States harvested 1.1 billion pounds of pumpkins, implying about 1.4 billion pounds harvested altogether in the United States. Production increased 45 percent from 2015 largely due to a rebound in Illinois production. Illinois production, though highly variable, is six times the average of the other top eight pumpkin-producing States (Figure 2).
Production increased 45 percent from 2015 largely due to a rebound in Illinois production. Illinois production, though highly variable, is six times the average of the other top eight pumpkin-producing States.

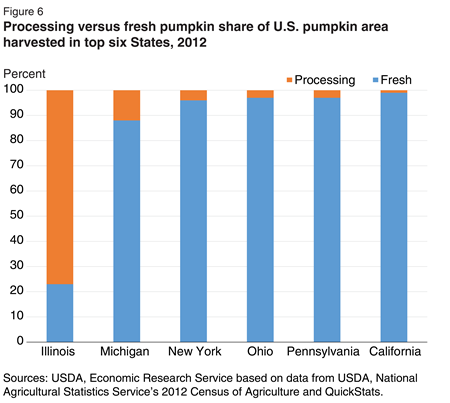
Not only does Illinois produce more pumpkins, but a much larger share of pumpkins from this state end up being processed, rather than used fresh. The USDA reports:
Illinois harvests the largest share of processing pumpkin acres among all States—almost 80 percent. Michigan is next with a little over 10 percent. Other States harvest less than 5 percent processing pumpkins.

It's not really the entire state of Illinois, either, but mainly an area right around Peoria. The University of Illinois extension service writes: "Eighty percent of all the pumpkins produced commercially in the
U.S. are produced within a 90-mile radius of Peoria, Illinois. Most of those pumpkins are grown for processing into canned pumpkins. Ninety-five percent of the pumpkins processed in the United States are grown in Illinois. Morton, Illinois just 10 miles southeast of Peoria calls itself the `Pumpkin Capital of the World.'"

Why does this area have such dominance? Weather and soil are part of the advantage, but it seems unlikely that the area around Peoria is dramatically distinctive for those reasons alone. This also seems to be a case where an area got a head-start in a certain industry, established economies of scale and expertise, and has thus continued to keep a lead. The Illinois Farm Bureau writes: "Illinois earns the top rank for several reasons. Pumpkins grow well in its climate and in certain soil types. And in the 1920s, a pumpkin processing industry was established in Illinois, Babadoost [a professor at the University of Illinois] says. Decades of experience and dedicated research help Illinois maintain its edge in pumpkin production." According to one report, Libby’s Pumpkin is "the supplier of more than 85 percent of the world’s canned pumpkin."

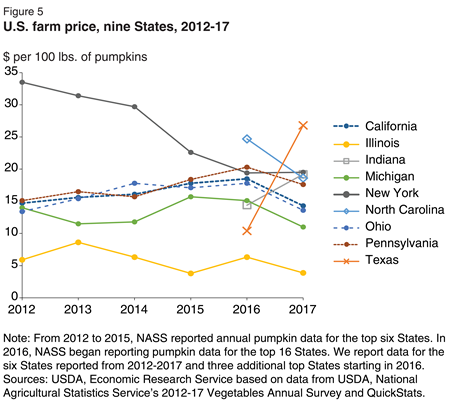
The farm price of pumpkins varies considerably across states, which suggests that it is costly to ship substantial quantities of pumpkin across moderate distances. For example, the price of pumpkins is lowest in Illinois, where supply is highest, and the Illinois price is consistently below the price for other nearby Midwestern states. This pattern suggests that the processing plants for pumpkins are most cost-effective when located near the actual production.

While all States see year-to-year changes in price, New York stands out because prices have declined every year since 2011. Illinois growers consistently receive the lowest price because the majority of their pumpkins are sold for processing.

Finally, although my knowledge of recipes for pumpkin is considerably more extensive than my knowledge of supply chain for processed pumpkin, it seems plausible that demand for pumpkin is neither the most lucrative of farm products, nor is it growing quickly, so it hasn't been worthwhile for potential competitors in the processed pumpkin market to try to establish an alternative pumpkin-producing hub somewhere else.

Tuesday, November 21, 2017

Will Artificial Intelligence Recharge Economic Growth?

There may be no more important question for the future of the US economy than whether the ongoing advances in information technology and artificial intelligence will eventually (and this "eventually" is central to their argument) translate into substantial productivity gains. Erik Brynjolfsson, Daniel Rock, and Chad Syverson make the case for optimism in "Artificial Intelligence and the Modern Productivity Paradox: A Clash of Expectations and Statistics" (NBER Working Paper 24001, November 2017). The paper isn't freely available online, but many readers will have access to NBER working papers through their library. The essay will eventually be part of a conference volume on The Economics of Artificial Intelligence

Brynjolfsson, Rock, and Syverson are making several intertwined arguments. One is that various aspects of machine learning and artificial intelligence are crossing important thresholds in the last few years and the next few years. Thus, even though we tend to think of the "computer age" as having already been in place for a few decades, there is a meaningful sense in which we are about to enter another chapter. The other argument is that when a technological disruption cuts across many parts of the economy--that is, when it is a "general purpose technology" as opposed to a more focused innovation--it often takes a substantial period of time before producers and consumers fully change and adjust. In turn, this means a substantial period of time before the new technology has a meaningful effect on measured economic growth. 

As one example of a new threshold in machine learning, consider image recognition. On various standardized tests for image recognition, the error rate for humans is about 5%. In just the last few years, the error rate for image-recognition algorithms is now lower than the human level--and of course the algorithms likely to keep improving. 
There are of course a wide array of similar examples. The authors cite one study in which an artificial intelligence system did as well as a panel of board-certified dermatologists in diagnosing skin cancer. Driverless vehicles are creeping into use. Anyone who uses translation software or software that relied on voice recognition can attest to how much better it has become in the last few years. 

The author also point to an article from the Journal of Economic Perspectives in 2015, in which Gill Pratt pointed out the potentially enormous advantages of artificial intelligence in sharing knowledge and skills. For example, translation software can be updated and improved based on how everyone uses it, not just on one user. They write about Pratt's essay: 
[Artificial intelligence] machines have a new capability that no biological species has: the ability to share knowledge and skills almost instantaneously with others. Specifically, the rise of cloud computing has made it significantly easier to scale up new ideas at much lower cost than before. This is an especially important development for advancing the economic impact of machine learning because it enables cloud robotics: the sharing of knowledge among robots. Once a new skill is learned by a machine in one location, it can be replicated to other machines via digital networks. Data as well as skills can be shared, increasing the amount of data that any given machine learner can use.
However, new technologies like web-based technology, accurate vision, drawing inferences, and communicating lessons don't spread immediately. The authors offer the homely example of the retail industry. The idea or invention of of online sales became practical back in the second half of the 1990s. But many of the companies founded for online-sales during the dot-com boom of the late 1990s failed, and the sector of retail that expanded most after about 2000 was warehouse stores and supercenters, not  online sales. Now, two decades later, online sales have almost reached 10% of total retail. 

Why does it take so long? The theme that Brynjolfsson, Rock, and Syverson emphasize is that a revolution in online sales needs more than an idea. It needs innovations in warehouses, distribution, and the financial security of online commerce. It needs producers to think in terms of how they will produce, package, and ship for online sales. It needs consumers to buy into the process. It takes time. 

The notion that general purpose inventions which cut across many industries will take time to manifest their productivity gains, because of the need for complementary inventions, turns out to be a pattern that has occurred before. 

For economists, the canonical comment on this process in the last few decade is due to Robert Solow (Nobel laureate '87) who wrote in an essay in 1987, "You can see the computer age everywhere but in the productivity statistics" (“We’d better watch out,” New York Times Book Review, July 12, 1987, quotation from p. 36). After all, IBM had been producing functional computers in substantial quantities since the 1950s, but the US productivity growth rate had been slow since the early 1970s. When the personal computer revolution, the internet, and surge of productivity in computer chip manufacturing all hit in force the 1990s, productivity did rise for a time. Brynjolfsson, Rock, and Syverson write: 
"For example, it wasn’t until the late 1980s, more than 25 years after the invention of the integrated circuit, that the computer capital stock reached its long-run plateau at about 5 percent (at historical cost) of total nonresidential equipment capital. It was at only half that level 10 years prior. Thus, when Solow pointed out his now eponymous paradox, the computers were finally just then getting to the point where they really could be seen everywhere."
Going back in history, my favorite example of this lag that it takes for inventions to diffuse broadly is from the invention of the dynamo for generating electricity, a story first told by economic historian Paul David back in a 1991 essay. David points out that large dynamos for generating electricity existed in the 1870s. However, it wasn't until the Paris World Fair of 1900 that electricity was used to illuminate the public spaces of a city. And it's not until the 1920s that innovations based on electricity make a large contribution to US productivity growth. 

Why did it take so long for electricity to spread? Shifting production away from being  powered by waterwheels to electricity was a long process, which involved rethinking, reorganizing, and relocating factories. Products that made use of electricity like dishwashers, radios, and home appliances could not be developed fully or marketed successfully until people had access to electricity in their homes. Large economic and social adjustments take time time.

When it comes to machine learning, artificial intelligence, and economic growth, it's plausible to believe that we are closer to the front end of our economic transition than we are to the middle or the end. Some of the more likely near-term consequences mentioned by Brynjolfsson, Rock, and Syverson include a likely upheaval in the call center industry that employs more than 200,000 US workers, or how automated driverless vehicles (interconnected, sharing information, and learning from each other) will directly alter one-tenth or more of US jobs. My suspicion is that the changes across products and industries will be deeper and more sweeping than I can readily imagine.

Of course, the transition to the artificial intelligence economy will have some bumps and some pain, as did the transitions to electrification and the automobile. But the rest of the world is moving ahead. And history teaches that countries which stay near the technology frontier, and face the needed social adjustments and tradeoffs along the way,  tend to be far happier with the choice in the long run than countries which hold back. 

Monday, November 20, 2017

Why Has Life Insurance Ownership Declined?

Back in the first half of the 19th century, life insurance was unpopular in the US because it was broadly considered to be a form of betting with God against your own life. After a few decades of insurance company marketing efforts, life insurance was transformed into a virtuous purchase for any good and devout husband. But in recent decades, life insurance has been in decline.

Daniel Hartley, Anna Paulson, and Katerina Powers look at recent patterns of life insurance and bring the puzzle of its decline into sharper definition in "What explains the decline in life insurance ownership?" in Economic Perspectives, published by the Federal Reserve Bank of Chicago (41:8,   2017). The story of shifting attitudes toward life insurance in the 19th century US is told by Viviana A. Zelizer in a wonderfully thought-provoking 1978 article, "Human Values and the Market: The Case of Life Insurance and Death in 19th-Century America," American Journal of Sociology (November 1978, 84:3, pp. 591-610).

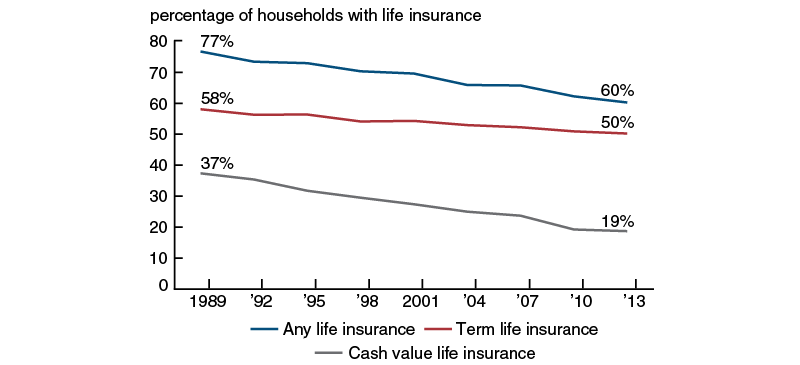
With regard to recent patterns, Hartley, Paulson, and Powers write: "Life insurance ownership has declined markedly over the past 30 years, continuing a trend that began as early as 1960. In 1989, 77 percent of households owned life insurance (see figure 1). By 2013, that share had fallen to 60 percent." In the figure, the blue line shows any life insurance, the red line shows the decline in term life, and the gray line shows the decline in cash value life insurance.


Early the 19th century, the costs of death and funerals were largely a family and neighborhood affair. As Zelizer points out, attitudes at the time, life insurance was commercially unsuccessful because it was viewed as betting on death. It was widely believed that such a bet might even hasten death, with with blood money being received by the life insurance beneficiary. For example, Zelizer wrote:

"Much of the opposition to life insurance resulted from the apparently speculative nature of the enterprise; the insured were seen as `betting' with their lives against the company. The instant wealth reaped by a widow who cashed her policy seemed suspiciously similar to the proceeds of a winning lottery ticket. Traditionalists upheld savings banks as a more honorable economic institution than life insurance because money was accumulated gradually and soberly. ...  A New York Life Insurance Co. newsletter (1869, p. 3) referred to the "secret fear" many customers were reluctant to confess: `the mysterious connection between insuring life and losing life.' The lists compiled by insurance companies in an effort to respond to criticism quoted their customers' apprehensions about insuring their lives: "I have a dread of it, a superstition that I may die the sooner" (United States Insurance Gazette [November 1859], p. 19). ... However, as late as the 1870s, "the old feeling that by taking out an insurance policy we do somehow challenge an interview with the 'king of terrors' still reigns in full force in many circles" (Duty and Prejudice 1870, p. 3). Insurance publications were forced to reply to these superstitious fears. They reassured their customers that "life insurance cannot affect the fact of one's death at an appointed time" (Duty and Prejudice 1870, p. 3). Sometimes they answered one magical fear with another, suggesting that not to insure was "inviting the vengeance of Providence" (Pompilly 1869). ... An Equitable Life Assurance booklet quoted wives' most prevalent objections: "Every cent of it would seem to me to be the price of your life .... it would make me miserable to think that I were to receive money by your death .... It seems to me that if [you] were to take a policy [you] would be brought home dead the next day" (June 1867, p. 3)."
However, over the course of several decades, insurance companies marketed life insurance with a message that it was actually a loving duty to one's family for a devout husband. As Zelizer argues, the rituals and institutions of what society viewed as a "good death" altered. She wrote:
"From the 1830s to the 1870s life insurance companies explicitly justified their enterprise and based their sales appeal on the quasi-religious nature of their product. Far more than an investment, life insurance was a `protective shield' over the dying, and a consolation `next to that of religion itself' (Holwig 1886, p. 22). The noneconomic functions of a policy were extensive: `It can alleviate the pangs of the bereaved, cheer the heart of the widow and dry the orphans' tears. Yes, it will shed the halo of glory around the memory of him who has been gathered to the bosom of his Father and God' (Franklin 1860, p. 34). ... life insurance gradually came to be counted among the duties of a good and responsible father. As one mid-century advocate of life insurance put it, the man who dies insured and `with soul sanctified by the deed, wings his way up to the realms of the just, and is gone where the good husbands and the good fathers go' (Knapp 1851, p. 226). Economic standards were endorsed by religious leaders such as Rev. Henry Ward Beecher, who pointed out, `Once the question was: can a Christian man rightfully seek Life Assurance? That day is passed. Now the question is: can a Christian man justify himself in neglecting such a duty?' (1870)."
Zelizer's work is a useful reminder that many products, including life insurance, are not just about prices and quantities in the narrow economic sense, but are also tied to broader social and institutional patterns.  

The main focus of Hartley, Paulson, and Powers is to explore the extent to which shifts in socioeconomic and demographic factors can explain the fall in life insurance: that is, have socioeconomic or demographic groups that were less likely to buy life insurance become larger over time? However, after doing a breakdown of life insurance ownership by race/ethnicity, education level, and income level, they find that the decline in life insurance is widespread across pretty much all groups. In other words, the decline in life insurance doesn't seem to be (primarily) about socioeconomic or demographic change, but rather about other factors. They write: 
"Instead, [life insurance] ownership has decreased substantially across a wide swath of the population. Explanations for the decline in life insurance must lie in factors that influence many households rather than just a few. This means we need to look beyond the socioeconomic and demographic factors that are the focus of our analysis. A decrease in the need for life insurance due to increased life expectancy is likely to be an especially important part of the explanation. In addition, other potential factors include changes in the tax code that make the ability to lower taxes through life insurance less attractive, lower interest rates that also reduce incentives to shelter investment gains from taxes, and increases in the availability and decreases in the cost of substitutes for the investment component of cash value life insurance." 
It's intriguing to speculate about what the decline in life insurance purchases tells us about our modern attitudes and arrangements toward death, in a time of longer life expectancies, more households with two working adults, the backstops provided by Social Security and Medicare, and perhaps also shifts in how many people feel that their souls are sanctified (in either a religious or a secular sense) by the purchase of life insurance. 

Friday, November 17, 2017

Brexit: Still a Process, Not Yet a Destination

I happened to be in the United Kingdom on a long-planned family vacation on June 23, 2016, when the Brexit vote took place. At the time, I offered a stream-of-consciousness "Seven Reflections on Brexit" (June 26, 2016). But more than year has now passed, and Thomas Sampson sums up the research on what is known and what might come next in "Brexit: The Economics of International Disintegration," which appears in the Fall 2017 issue of the Journal of Economic Perspectives.

(As regular readers know, my paying job--as opposed to my blogging hobby--the Managing Editor of the JEP. The American Economic Association has made all articles in JEP freely available, from the most recent issue back to the first. For example, you can check out the Fall 2017 issue here.)

Here's Sampson's basic description of the UK and its position in the international economy before Brexit. For me, it's one of those descriptions that doesn't use any weighted rhetoric, but nonetheless packs a punch.
"The United Kingdom is a small open economy with a comparative advantage in services that relies heavily on trade with the European Union. In 2015, the UK’s trade openness, measured by the sum of its exports and imports relative to GDP, was 0.57, compared to 0.28 for the United States and 0.86 for Germany (World Bank 2017). The EU accounted for 44 percent of UK exports and 53 percent of its imports. Total UK–EU trade was 3.2 times larger than the UK’s trade with the United States, its second-largest trade partner. UK–EU trade is substantially more important to the United Kingdom than to the EU. Exports to the EU account for 12 percent of UK GDP, whereas imports from the EU account for only 3 percent of EU GDP. Services make up 40 percent of the UK’s exports to the EU, with “Financial services” and “Other business services,” which includes management consulting and legal services, together comprising half the total. Brexit will lead to a reduction in economic integration between the United Kingdom and its main trading partner."
A substantial reduction in trade will cause problems for the UK economy. Of course, the estimates will vary according to just what model is used, and Sampson runs through the main possibilities. He summarizes in this way: 
"The main conclusion of this literature is that Brexit will make the United Kingdom poorer than it would otherwise have been because it will lead to new barriers to trade and migration between the UK and the European Union. There is considerable uncertainty over how large the costs of Brexit will be, with plausible estimates ranging between 1 and 10 percent of UK per capita income. The costs will be lower if Britain stays in the European Single Market following Brexit. Empirical estimates that incorporate the effects of trade barriers on foreign direct investment and productivity find costs 2–3 times larger than estimates obtained from quantitative trade models that hold technologies fixed."
What will come next after Brexit isn't yet clear, and may well take years to negotiate. In the meantime, the main shift seems to be that the foreign exchange rate for the pound has fallen, while inflation has risen, which means that real inflation-adjusted wages have declined. This national wage cut has helped keep Britain's industries competitive on world markets, but it's obviously not a desirable long-run solution.

But in the longer run, as the UK struggles to decide what actually comes next after Brexit, Sampson makes a distinction worth considering: Is the opposition to Brexit about national identity and taking back control, even if it makes the country poorer, or is it about renegotiating trade agreements and other legislation to do more to address the economic stresses created by globalization and technology? He writes:

"Support for Brexit came from a coalition of less-educated, older, less economically successful and more socially conservative voters who oppose immigration and feel left behind by modern life. Leaving the EU is not in the economic interest of most of these left-behind voters. However, there is currently insufficient evidence to determine whether the leave vote was primarily driven by national identity and the desire to “take back control” from the EU, or by voters scapegoating the EU for their
economic and social struggles. The former implies a fundamental opposition to deep economic and political integration, even if such opposition brings economic costs, while the later suggests Brexit and other protectionist movements could be addressed by tackling the underlying reasons for voters’ discontent."
For me, one of the political economy lessons of Brexit is that relatively easy to get a majority against a specific unpopular element of the status quo, while leaving open the question of what happens next. It's a lot harder to get a majority in favor of a specific change. That problem gets even harder when it comes to international agreements, because while it's easy for UK politicians to make pronouncements on what agreements the UK would prefer, trade negotiators in the EU, the US, and the rest of the world have a say, too. Sampson discusses the main post-Brexit options, and I've blogged about them in "Brexit: Getting Concrete About Next Steps" (August 2, 2016). While the process staggers along, this "small open economy with a comparative advantage in services that relies heavily on trade with the European Union" is adrift in uncertainty.

Thursday, November 16, 2017

US Wages: The Short-Term Mystery Resolved

The Great Recession ended more than eight years ago, in June 2009. The US unemployment rate declined slowly after that, but it has now been below 5.0% every month for more than two years, since September 2015. Thus, an ongoing mystery for the US economy is: Why haven't wages started to rise more quickly as the labor market conditions improved? Jay Shambaugh, Ryan Nunn, Patrick Liu, and Greg Nantz provide some factual background to address this question in "Thirteen Facts about Wage Growth," written for the Hamilton Project at the Brookings Institution (September 2017).  The second part of the report addresses the question: "How Strong Has Wage Growth Been since the Great Recession?"

For me, one surprising insight from the report is that real wage growth--that is, wage growth adjusted for inflation--has actually not been particularly slow during the most recent upswing. The upper panel of this figure shows real wage growth since the early 1980s. The horizontal lines show the growth of wages after each recession. The real wage growth in the last few years is actually higher. The bottom panel shows nominal wage growth, with inflation included. By that measure, wage growth in recent years is lower than after the last few recessions. Thus, I suspect that one reason behind the perception of slow wage growth is that many people are focused on nominal rather than on real wages.


Government statistics offer a lot of ways of measuring wage growth. The graphs above are wage growth for "real average hourly earnings for production and nonsupervisory workers," which is about 100 million of the 150 million workers.

An alternative and broader approach looks what is called the Employment Cost Index, which is based on a National Compensation Survey of employers. To adjust for inflation, I use the measure of inflation called the Personal Consumption Expenditures price index, which is the inflation just for the personal consumption part of the economy that is presumably most relevant to workers. I also use the version of this index that strips out jumps in energy and food prices. This is the measure of the inflation rate that the Federal Reserve actually focuses on.

Economists using these measures were pointing out a couple of years ago that real wages seemed to be on the rise. The blue line shows the annual change in wages and salaries for all civilian workers, using the ECI, while the redline shows the PCE measure of inflation. The gap between the two is the real gain in wages, which you can see started to emerge in 2015.

Not only has the recovery in US real wages been a bit higher than usual for the last few decades, and especially prominent in the last couple of years, but there is good reason to believe that the wage statistics since the Great Recession may be picking up a change in the composition of the workforce that tends to make wage growth look slower. Shambaugh, Nunn, Liu, and Nantz explain (citations and footnotes omitted):
"In normal times, entrants to full-time employment have lower wages than those exiting, which tends to depress measured wage growth. During the Great Recession this effect diminished substantially when an unusual number of low-wage workers exited full-time employment and few were entering. After the Great Recession ended, the recovering economy began to pull workers back into full-time employment from part-time employment ... and nonemployment, while higher-paid, older workers left the labor force. Wage growth in the middle and later parts of the recovery fell short of the growth experienced by continuously employed workers, reflecting both the retirements of relatively high-wage workers and the reentry of workers with relatively low wages. In 2017 the effect of this shifting composition of employment remains large, at more than 1.5 percentage points. If and when growth in full-time employment slows, we can expect this effect to diminish somewhat, providing a boost to measured wage growth."
The baby boomer generation is hitting retirement and leaving the labor force, as relatively highly-paid workers at the end of their careers. New workers entering the labor force, together with low-skilled workers being drawn back into the labor force, tend to have lower wages and salaries. This makes wage growth look low--but what's happening is in part a shift in types of workers. 

One other fact from Shambaugh, Nunn, Liu, and Nantz is that wage growth has been strong at the bottom and the top of the wage distribution, but slower in the middle. This figure splits the wage distribution into five quintiles, and shows the wage growth for production and nonsupervisory workers in each. 

Taking these factors together, the "mystery" of why wages haven't recovered more strongly since the end of the Great Recession appears to be resolved. However, a bigger mystery remains. Why have wages and salaries for production and nonsupervisory workers done so poorly not in the last few years, but over the last few decades?

There's a long list of potential reasons: slow productivity growth, rising inequality, dislocations from globalization and new technology, a slowdown in the rate of start-up firms, weakness of unions and collective bargaining, less geographic mobility by workers, and others. These factors have been discussed here before, and will be again, but not today. Shambaugh, Nunn, Liu, and Nantz provide some background figures and discussion of these longer-term factors, too. 

Wednesday, November 15, 2017

Rethinking Development: Larry Summers

Larry Summers delivered a speech on the subject of "Rethinking Global Development Policy for the 21st Century" at the Center for Global Development on November 8, 2017. A video of the 45-minute lecture is here. Here are a few snippets, out of many I could have chosen:

The dramatic global convergence between rich and poor
"There has been more convergence between poor people in poor countries and rich people in rich countries over the last generation than in any generation in human history. The dramatic way to say it is that between the time of Pericles and London in 1800, standards of living rose about 75 percent in 2,300 years. They called it the Industrial Revolution because for the first time in human history, standards of living were visibly and 2 meaningfully different at the end of a human lifespan than they had been at the beginning of a human lifespan, perhaps 50 percent higher during the Industrial Revolution. Fifty percent is the growth that has been achieved in a variety of six-year periods in China over the last generation and in many other countries, as well. And so if you look at material standards of living, we have seen more progress for more people and more catching up than ever before. That is not simply about things that are material and things that are reflected in GDP. ... [I]f current trends continue, with significant effort from the global community, it is reasonable to hope that in 2035 the global child mortality rate will be lower than the US child mortality rate was when my children were born in 1990. That is a staggering human achievement. It is already the case that in large parts of China, life expectancy is greater than it is in large parts of the United States." 

The marginal benefit of development aid is what is enabled, not what is funded
"I remember as a young economist who was going to be the chief economist of the World Bank sitting and talking with Stan Fischer, who was my predecessor as the chief economist of the World Bank. And we were talking, and I was new to all this. I had never done anything in the official sector. And I said, "Stan, I don't get it. If a country has five infrastructure projects and the World Bank can fund two of them, and the World Bank is going to cost-benefit analyze and the World Bank is going to do all its stuff, I would assume what the country does is show the World Bank its two best infrastructure projects, because that will be easiest, and if it gets money from the World Bank, then it does one more project, but what the World Bank is actually buying is not the project it is being shown, it is the marginal product that it is enabling. And so why do we make such a fuss of evaluating the particular quality of our projects?" And Stan listened to me. And he looked at me. He's a very wise man. And he said, "Larry, you know, it is really interesting. When I first got to the bank, I always asked questions like that." "But now I've been here for two years, and I don't ask questions like that. I just kind of think about the projects, because it is kind of too hard and too painful to ask questions like that."
Funds from the developing world governments and multilateral institutions have much less power
"[O]ur money—and I mean by that our assistance and the assistance of the multilateral institutions in which we have great leverage—is much less significant than it once was. Perhaps the best way to convey that is with a story. In 1991, when I was new to all of this, I was working as the chief economist of the World Bank, and the first really important situation in which I had any visibility at all was the Indian financial crisis that took place in the summer of 1991. And at that point, India was near the brink. It was so near the brink that, at least as I recall the story, $1 billion of gold was with great secrecy put on a ship by the Indians to be transported to London, where it could be collateral for an emergency loan that would permit the Indian government to meet its payroll at the end of the month.  And at that moment, the World Bank was in a position over the next year to lend India $3 billion in conjunction with its economic reform program. And the United States had an important role in shaping the World Bank's strategy. Well, that $3 billion was hugely important to the destiny of a sixth of humanity. Today, the World Bank would have the capacity to lend India in a year $6 billion or $7 billion. But India has $380 billion—$380 billion—in reserves dominantly invested in Treasury bills earning 1 percent. And India itself has a foreign aid budget of $5 billion or $6 billion. And so the relevance of the kind of flows that we are in a position to provide officially to major countries is simply not what it once was."
Protecting the world from pandemic flu vs. the salary of a college football coach
"[T]he current WHO budget for pandemic flu is less than the salary of the University of Michigan's football coach—not to mention any number of people who work in hedge funds. And that seems manifestly inappropriate. And we do not yet have any settled consensus on how we are going to deal with global public goods and how that is going to be funded."