Monday, March 30, 2020

Aging, the Demographic Transition, and the Necessary Adjustments

David E. Bloom has been thinking a lot about aging. Last fall he edited Live Long and Prosper? The
Economics of Ageing Populations, a free ebook with 20 short essays summarizing a range of research on the topic (October 2019, VoxEU.org, registration required). Then Bloom contributed the lead article, "Population 2020: Demographics can be a potent driver of the pace and process of economic development," in the most recent issue of Finance & Development (March 2020, pp. 4-9).  At the moment, of course, a primary concern is that older people may be more vulnerable to the spread of COVID-19. But more broadly, a shift in the distribution of ages across society will have broad consequences for social institutions and government policies.

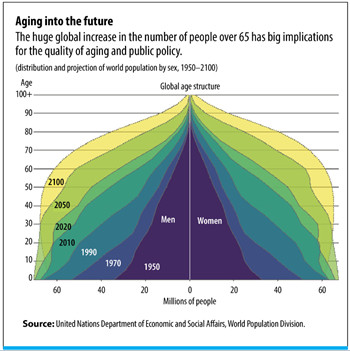
Here's a figure from Andrew Scott, in his F&D essay "The Long, Good Life," which gives as sense of the shift. The horizontal axis of the figure shows the expansion of population over time. The vertical axis shows the shift in aging. Thus, the shaded area for 1950 is narrower (fewer people) and more pointed near the top (fewer older people). The time periods that follow get wider (more people) and also develop "shoulders," representing a population where more people stay older for longer.


Bloom explains the underlying patterns, including the "demographic transition" and the graying population, in his F&D essay:

In many developing economies, population growth has been associated with a phenomenon known as the “demographic transition”—the movement from high to low death rates followed by a corresponding movement in birth rates.
For most of human history, the average person lived about 30 years. But between 1950 and 2020, life expectancy increased from 46 to 73 years, and it is projected to increase by another four years by 2050. Moreover, by 2050, life expectancy is projected to exceed 80 years in at least 91 countries and territories that will then be home to 39 percent of the world's population. ... Cross-country convergence in life expectancy continues to be strong. For example, the life expectancy gap between Africa and North America was 32 years in 1950 and 24 years in 2000; it is 16 years today. ...
In the 1950s and 1960s, the average woman had roughly five children over the course of her childbearing years. Today, the average woman has somewhat fewer than 2.5 children. This presumably reflects the growing cost of child-rearing (including opportunity cost, as reflected mainly in women’s wages), increased access to effective contraception, and perhaps also growing income insecurity. ... Between 1970 and 2020, the fertility rate declined in every country in the world. ... 
If the population’s age structure is sufficiently weighted toward those in prime childbearing years, even a fertility rate of 2.1 can translate into positive population growth in the short and medium term, because low fertility per woman is more than offset by the number of women having children. This feature of population dynamics is known as population momentum and helps explain (along with migration) why the populations of 69 countries and territories are currently growing even though their fertility rates are below 2.1.

The result of this demographic transition is a population with a rising number and share of elderly. Bloom writes:
Population aging is the dominant demographic trend of the twenty-first century—a reflection of increasing longevity, declining fertility, and the progression of large cohorts to older ages. Never before have such large numbers of people reached ages 65+ (the conventional old-age threshold). We expect to add 1 billion older individuals in the next three to four decades, atop the more than 700 million older people we have today. Among the older population, the group aged 85+ is growing especially fast and is projected to surpass half a billion in the next 80 years. This trend is significant because the needs and capacities of the 85+ crowd tend to differ significantly from those of 65-to-84-year-olds.
Although every country in the world will experience population aging, differences in the progression of this phenomenon will be considerable. Japan is currently the world leader, with 28 percent of its population 65 and over, triple the world average. By 2050, 29 countries and territories will have larger elder shares than Japan has today. In fact, the Republic of Korea’s elder share will eventually overtake Japan’s, reaching the historically unprecedented level of 38.1 percent. Japan’s median age (48.4) is also currently the highest of any country and more than twice that of Africa (19.7). But by 2050, Korea (median age 56.5 in 2050) is also expected to overtake Japan on that metric (54.7).
Three decades ago,the world was populated by more than three times as many adolescents and young adults (15- to 24-year-olds) as older people. Three decades from now, those age groups will be roughly on par.
I won't try here to summarize all the discussions in the F&D and the ebook. Instead, I'll just list the tables of contents below. But here are a few thoughts: 
  • Consider your mental picture of an extended family gathering. Maybe it's a holiday with grandparents, parents, and children. Maybe it's a family reunion with a larger group of aunts, uncles, and cousins. Now in thinking about that family reunion, think about it  being much more common to including five generations: that is, from great-great-grandparents down to children. In addition, think about there being fewer people in each generation, as a result of fewer children. The "family tree" is going to look taller and skinnier.  
  • As we shift from (in Bloom's calculation) a world where there are three times as many young people as elderly to a world where those populations are equal, public institutions will also shift to meet the needs of the elderly. The design of parks, libraries, public transit, city streets, shopping malls, and much more will evolve to reflect more emphasis on the needs and desires of the elderly. On the other side, schools and education will be a shrinking part of what government does. 
  • Caring for the elderly who need a range of support from an occasional in-home visit to living in a full-care institution is going to be a growth industry, needing both additional workers and technological innovations. This will be especially true as the number of extremely elderly people rises--often defined now as those over 85, but in the future perhaps defined as those over 100. In addition, the elderly will have had fewer children, and thus are less likely to have access to within-family support. 
  • It will be important for the workplace to shift in ways that provide jobs with the flexibility and interest to appeal to at least the "young elderly," who might otherwise just choose to retire completely.  
  • Government spending on programs to support the elderly, including pensions and health care, are going to rise dramatically in size.
  • All over the world, including the US, it's time to start phasing back the age of retirement at which people become eligible for pension plans. Exactly how that is done, and what kind of flexibility is available for retiring earlier or later, is open for discussion. But an expectation that retirement ages will in general be later is a fundamental step in making government-provided social security or pensions sustainable in the long run.
  • Older people tend to save less, as they draw down their retirement accounts, but also to look for less risky and volatile investments (more bonds, less stock market).
  • Keeping older people healthy and functioning later in life will be an urgent need, both for the people themselves and also to reduce the need for outside support. 
Following Bloom's lead-off essay, other essays on this topic in the March 2020 F&D include: 

In the e-book, the Table of Contents is:

1) "The what, so what, and now what of population ageing," by David E. Bloom

Part I: Implications of Population Ageing: The 'So What'

2) "Who will care for all the old people?" by Finn Kydland and Nick Pretnar
3) "Employment and the health burden on informal caregivers of the elderly," by Jan M. Bauer and Alfonso Sousa-Poza
4) "Ageing in global perspective," by Laurence J. Kotlikoff
5) "What do older workers want?" by Nicole Maestas and Michael Jetsupphasuk
6) "The flip side of "live long and prosper": Noncommunicable diseases in the OECD and their macroeconomic impact," by David E. Bloom, Simiao Chen, Michael Kuhn and Klaus Prettner
7) "Macroeconomic effects of ageing and healthcare policy in the United States," by Juan Carlos Conesa, Timothy J. Kehoe, Vegard M. Nygaard and Gajendran Raveendranathan
8) "Global demographic changes and international capital flows," by Weifeng Liu and Warwick J. McKibbin
9) "Ageing into risk aversion? Implications of population ageing for the willingness to take risks," by Margaret A. McConnell and Uwe Sunde
10) "Life cycle origins of pre-retirement financial status: Insights from birth cohort data," by
Mark McGovern
11) "A longevity dividend versus an ageing society," by Andrew Scott

Part II: Solutions and Policies: The 'Now What'

12) "Understanding 'value for money' in healthy ageing," by Karen Eggleston
13) "Healthy population ageing depends on investment in early childhood learning and development," by Elizabeth Geelhoed, Phoebe George, Kim Clark and Kenneth Strahan
14) "Financing health services for the Indian elderly: Aayushman Bharat and beyond," by Ajay Mahal and Sanjay K. Mohanty
15) "Cutting Medicare beneficiaries in on savings from managed healthcare in Medicare," by Thomas G. McGuire
16) "Macroeconomics and policies in ageing societies,"by Andrew Mason, Sang-Hyop Lee, Ronald Lee and Gretchen Donehower
17) "Population ageing and tax system efficiency," by John Laitner and Dan Silverman
18) "Means-tested public pensions: Designs and impact for an ageing demographic," by George Kudrna and John Piggott
19) "Pension reform in Europe," by Axel Börsch-Supan
20) "Happiness at old ages: How to promote health and reduce the societal costs of ageing," by Maddalena Ferranna


Saturday, March 28, 2020

An Economist's First Tryst with Benefit-Cost Analysis

Célestin Monga has had an eminent career as a research economist at the World Bank, as Managing Director of the UN Industrial Development Organization, as Chief Economist and vice-president at the the African Development Bank, and now as a Senior Economic Adviser at the World Bank. Here, he tells of that intimate special moment in the life of any economist--that first encounter with cost-benefit analysis. 

(I'm quoting here from Monga's "Comment" (pp. 77-94) in response to an essay by Amartya Sen from The State of Economics, The State of the World, published in 2019 by MIT Press.)  
I still remember vividly the strange mix of excitement and bewilderment that overwhelmed me in my high school years when our professor of accounting taught us the fundamentals of benefit-cost analysis. I immediately went to my dormitory and spent most of the evening trying to apply this powerful technique, not to assess whether the advantages of a hypothetical investment project were likely to outweigh its drawbacks, but to evaluate my own life prospects. Benefit-cost analysis seemed like a rigorous and revealing tool to examine whether my minuscule and uncertain existence was a "profitable" venture, or at least a worthwhile escapade that deserved to be continued. Of course, the few friends to whom I confided this found it a ludicrous idea. ... They were right: ... But so what? I kept running the numbers. ... 
I also had to decide how to imagine and estimate the prospective benefits and costs of my entire life to come. Using my own personal value scale, I calculated the costs as the amount of compensation required to exactly offset negative consequences of being alive for 50 or so years of life expectancy ahead. The compensation was the monetary amount required that would leave me just as well off as before engaging in this exercise. Benefits were measured by my willingness  to stay alive and enjoy all the things and emotions that I could reasonably expect for the decades ahead. Knowing that, in the end, life always results in death, typically following either an abrupt and tragic event like a car or airplane crash, or a long and painful illness, I could not find many benefits show present and expected value could match and compensate for the pains and disappointments of the costs. The results of my benefit-cost analysis were not very promising: Taking into consideration all current and expected streams of good and bad news, life did not appear to be a "profitable" investment. 
Shocked by the outcomes, I quick did some sensitivity analysis to check the robustness of my findings: No  matter what discount rates I chose, the calculations still yielded disappointing numbers to the question of whether life was a worthwhile venture. This was all the more puzzling because I actually loved many aspects of my life. Not knowing what to do with the analyses, I concluded one should either doubt the validity of certain measurement instruments or our ability to use them "objectively," or radically give more weight to whatever we define as "positive" outcomes for our actions or inactions, or accept the very probable hypothesis that happiness may be an illusion but those who choose to live should learn to ignore its downsides. I could only forget the outcomes of my own study by learning to radically change whatever assumptions I used in carrying it out. "Live is impossible without the ability to forget," philosopher Emil Cioran once said. But some memories are just to long-lasting to ever be erased. 
Monga's reminisce serves as a reminder of teenage feelings about the world. It also illustrates that although benefit-cost analysis has a useful place in comparing certain limited sets of choices, the method does not contain solutions to the mysteries of life. However, if you are a young person who finds yourself tempted to carry out a benefit-cost analysis of your own life, you may wish to consider seriously a career as an economist. 

Friday, March 27, 2020

Value of a Statistical Life: Where Does It Come From?

One of the (many) questions that causes economists to pull their hair out takes the general form: "How can you economists even possibly try to weigh economic costs against the value of a life saved?" Even worse, the question is often delivered in a triumphalist tone of a deeper moral truth being unveiled.

But in the real world, people and governments actually weigh economic costs against the value of a life saved all the time. Certain jobs that pose a greater risk to life and limb also tend to pay more than jobs for similarly qualified workers without such risks. Those who take such jobs, or don't take them, are in part placing an economic value on a greater risk of losing their life. Many government regulations, from setting speed limits on the roads to health and safety standards for food, could be tightened in a way that would save more lives but impose greater costs, or loosened in a way that would save fewer lives but impose lesser costs. Deciding where to set such regulations will necessarily involve a decision about how much it's worth paying to reduce the risk of someone losing their life.

Thus, the relevant question is not "how" to put a monetary value on life or "why would anyone ever want" to put a monetary value on life. The discussion starts from the fact that people and governments are already putting a monetary value on life, albeit often implicitly, by the actual real-world decisions they make.  When economists say that the "value of a statistical life" is about $10 million, they are not just pulling a number out of the air. Instead, they are only pointing out the monetary values that people are already using.

Thomas J. Kniesner and W. Kip Viscusi offer a readable overview of the evidence behind such decisions in "The Value of a Statistical Life," which was published in June 2019 in the Oxford Research Encyclopedia, Economics and Finance. (If for some reason you don't have access, a version of the paper is available on SSRN.)

As Kneiser and Viscusi point out, evidence about the economic value that people place on a higher or lower risk of losing their life can come from several sources: "revealed preference" studies that look at choices people make about jobs or products with different risks, or "stated preference" studies that involve survey data. To understand the intuition here, it's important to recognize that they studies are not asking a question like: "How much money would we need to pay you before we kill you?" The "value of a statistical life" is about changes in risk. They write:
Suppose further that ... the typical worker in the labor market of interest, say manufacturing, needs to be paid $1,000 more per year to accept a job where there is one more death per 10,000 workers. This means that a group of 10,000 workers would collect $10,000,000 more as a group if one more member of their group were to be killed in the next year. Note that workers do not know who will be fatally injured but rather that there will be an additional (statistical) death among them. Economists call the $10,000,000 of additional wage payments by employers the value of a statistical life. It is also the amount that the same group of workers would be willing to pay via wage reductions to have safer jobs where one fewer of their group would be fatally injured or ill. In that sense the VSL measures the willingness of workers to implicitly pay for safer workplaces and can be used to calculate the benefits of life-saving projects by private sector managers and government policymakers.
Studies of specific jobs that compare risks of death and pay will come up with a range of numbers; after all, jobs differ in many ways other than just their mortality risk. Thus, in a 2018 study, Viscusi looked at 1,025 estimates of the value of a statistical life drawn from 68 publications. He looked both at the total group, and then also at a "best-set" subgroup of the estimates that used what he viewed as more reliable methods. He found: "The all-set mean VSL is $12.0 million and the best-set sample mean is $12.2 million, where all estimates are in $2015. The median values are somewhat lower—$9.7 million for the all- set sample and $10.1 million for the best-set sample."

Of course, not everyone will put the same value on reducing mortality risk, and those of different ages and income levels, for example, will prefer different values. But for evaluating a broad government regulation that affects a broad cross-section of the population, using an overall number makes sense.

Another branch of the literature looks at purchases of certain goods or services. For example, how much is the price of a house affected by being in a high-crime area or near a large source of air pollution? How does the price that people pay for bike helmets or smoke detectors compare to the reduction in risk from such purchases? Again, different studies have a range of answers: again, an estimate of $10 million as the value of a statistical life seems plausible.

Other studies have taken an approach that uses detailed scenario-setting surveys. For example, the questionnaire may lay out a starting scenario, which includes the health risk expressed in various ways, like the chance of living to 100 years of age or the annual risk of being killed in the next year by cancer or in a car accident. Then the follow-up question offers other scenarios, with a range of costs expressed in terms like expected changes in prices or taxes paid, and different health risks. Naturally, the construction and interpretation of such surveys can be controversial, and sometimes the answers seem crazy-high or crazy-low. But an OECD study a few years ago suggested, based on an overview of these studies, that using $3.6 million as the value of a statistical life was plausible.

When it comes to public policy, Kneiser and Viscusi note: "Most U.S. government agencies have now adopted VSL estimates in a similar range consistent with the economics literature." The point out that the  U.S. Department of Transportation (2016) uses $9.4 million as the value of a statistical life, compared with $9.7 million for Environmental Protection Agency and $9.6 million for the U.S. Department of Health and Human Services.

It's easy enough to come up with questions about the value of a statistical life. But again, it is simply a fact that people and governments make decisions all the time about weighing health and safety against costs. Blaming the economists for doing the calculations to figure out what values are actually being places on a statistical life is like blaming the bathroom scale, or perhaps the laws of gravity, when it tells you that you could stand to lose a few pounds.

In the midst of the coronavirus pandemic, an obvious question is what a value of $10 million for the value of a statistical life means about the ongoing strategy of causing a recession for the sake of protecting public health. The multiplication is straightforward. Imagine that the steps being taken to contain the virus save 500,000 US lives. With those lives valued at $10 million, a social cost of up to  $5 trillion in lost output would be justified. For comparison, US GDP is about $21 trillion. If steps taken to contain the virus save 50,000 lives, then a social cost of up to $500 billion in lost output would be justified. This calculation is so quick-and-dirty, and leaves out so much, that I hesitate even to include it  here. It does suggest to me that in these benefit-cost terms, it's plausibly worth a recession to contain the virus, even a deep-but-short recession. It also suggests that if looking at how health risks  have been valued by actual people and governments in the past, a long-term recession or depression would not be a price worth paying to contain the virus.

For some previous posts and articles on the value of a statistical life, and its cousin the "quality-adjusted life-year," see:

Wednesday, March 25, 2020

Does the US Tax Code Favor Automation Over Jobs?

Imagine a company that is considering two possible ways to improve efficiency and productivity. One is to pay for many of its employees to go through a training program to learn new sets of useful skills. The other is to pay for new equipment that will replace many of the employees. Daron Acemoglu, Andrea Manera, and Pascual Restrepo argue that the US tax code tends to favor the second option. The technical version of their argument, "Does the U.S. Tax Code Favor Automation?" is published in most recent Brookings Papers on Economic Activity (Spring 2020, a short readable overview of the paper is also available at the link).  They write (citations and footnotes omitted):
The most common perspective among economists is that even if automation is contributing to declining labor share and stagnant wages, the adoption of these new technologies is likely to be beneficial, and any adverse consequences thereof should be dealt with appropriate redistributive policies (and education and training investments). But could it be that the extent of automation is excessive, meaning that US businesses are adopting automation technologies beyond the socially optimal level? If this were the case, the policy responses to these major labor market trends would need to be rethought.
There are several reasons why the level of automation may be excessive. Perhaps most
saliently, the US tax system is known to tax capital lightly and provide various subsidies
to the use of capital in businesses. In this paper, we systematically document the asymmetric taxation of capital and labor in the US economy in the US tax system labor is much more heavily taxed than capital. ...
Mapping the complex range of taxes in the US to effective capital and labor taxes is not trivial. Nevertheless, under plausible scenarios (for example, depending on how much of healthcare and pension expenditures are valued by workers and the effects of means-tested benefits), we find that labor taxes in the US are in the range of 25.5-33.5%. Effective capital taxes on software and equipment, on the other hand, are much lower, about 10% in the 2010s and even lower, about 5%, after the 2017 tax reforms. We also show that effective taxes on software and equipment have experienced a sizable decline from a peak value of 20% in the year 2000.3 A major reason explaining this trend in capital taxation is the increased generosity [of] depreciation allowances ...
 I should emphasize that this  paper is part of an ongoing research effort by these authors to think about interactions between automation and jobs. I have blogged about a previous entry in this line of research in "Is Something Different This Time About the Effect of Technology on the Labor Market?" (May 6, 2019). I discussed there a paper by Daron Acemoglu and Pascual Restrepo titled  "Automation and New Tasks: How Technology Displaces and Reinstates Labor."

In that paper, they suggest a framework in which automation can have three possible effects on the tasks that are involved in doing a job: a displacement effect, when automation replaces a task previously done by a worker; a productivity effect, in which the higher productivity from automation taking over certain tasks leads to more buying power in the economy, creating jobs in other sectors; and a reinstatement effect, when new technology reshuffles the production process in a way that leads to new tasks that will be done by labor. In this model, the effect of automation on labor is not predestined to be good, bad, or neutral. It depends on how these three factors interact.

In that context, the authors of the current paper suggest the theoretical possibility of an "automation tax," defined as "a higher tax on the use of capital in tasks where labor has a comparative advantage." They would combine this with a lower tax on other forms of capital, as well as on labor. In my own words, they are proposing that the tax code encourage the kind of automation that complements what workers do in a way that leads to sharp increases in productivity and output, but that the tax code not encourage the kind of automation that mostly just replaces workers with a real but only modest cost savings for the employer.

Of course, it's reasonable to note that a theoretical economic model can just create variables for these two kinds of automation, while a real world policy might face some difficult challenges in distinguishing between them. Still, the authors are trying to break out of a binary choice where automation is viewed as always good or always bad, and automation is instead being viewed as a range of choices that include automation that is more likely to be job-destroying or more likely to be job-creating. It feels to me like a potential distinction worth investigating.

Monday, March 23, 2020

James Madison on Why to Fill Out Your Census Form

I saw a news release from the US Bureau of the Census over the weekend that only about one-sixth of US households have responded to the 2020 Census so far. Here's what James Madison had to say, back in 1790, about why to fill out the form.

To set the stage, section 2 of the just-adopted US Constitution called for an enumeration of people to determine the number of members each state would have in the House of Representatives: "The actual Enumeration shall be made within three Years after the first Meeting of the Congress of the United States, and within every subsequent Term of ten Years, in such Manner as they shall by Law direct." But when the bill to enact the first Census came up in 1790, James Madison (then a member of the House of Representatives) argued that although collecting additional information would add to the difficulties, both the legislators and citizens would proceed with "more light and satisfaction" when they "rest their arguments on facts, instead of assertions and conjectures." 

Our records of Congressional debates from that time do not quote exactly verbatim, but instead are paraphrased. The fuller comments attributed to Madison are below, but here's are some highlights of what he had to say on January 25 and then on February 2, 1790:
This kind of information, he [Madison] observed, all Legislatures had wished for; but this kind of information had never been obtained in any country. ... If the plan was pursued in taking every future census, it would give them an opportunity of marking the progress of the society, and distinguishing the growth of every interest. This would furnish ground for many useful calculations, and at the same time answer the purpose of a check on the officers who were employed to make the enumeration ... I take it, sir, that in order to accommodate our laws to the real situation of our constituents, we ought to be acquainted with that situation. ... If gentlemen have any doubts with respect to its utility, I cannot satisfy them in a better manner, than by referring them to the debates which took place upon the bills, intend, collaterally, to benefit the agricultural, commercial, and manufacturing parts of the community. Did they not wish then to know the relative proportion of each, and the exact number of every division, in order that they might rest their arguments on facts, instead of assertions and conjectures? ... We should have given less encouragement in some instances, and more in others; but in every instance, we should have proceeded with more light and satisfaction.
Afterword: Here is a fuller version of the comments attributed to Madison. Here is the paraphrase of Madison's comments for January 25, 1790:  
Mr. Madison observed, that they had now an opportunity of obtaining the most useful information for those who should hereafter be called upon to legislate for their country, if this bill was extended to as to embrace some other objects besides the bare enumeration of the inhabitants; it would enable them to adapt the public measures to the particular circumstances of the community. In order to know the various interests of the United States, it was necessary that the description of the several classes into which the community is divided should be accurately known. On this knowledge the Legislature might proceed to make a proper provision for the agricultural, commercial, and manufacturing, interests, but without it they could never make their provisions in due proportion. This kind of information, he observed, all Legislatures had wished for; but this kind of information had never been obtained in any country. He wished, therefore to avail himself of the present opportunity of accomplishing so valuable a purpose. If the plan was pursued in taking every future census, it would give them an opportunity of marking the progress of the society, and distinguishing the growth of every interest. This would furnish ground for many useful calculations, and at the same time answer the purpose of a check on the officers who were employed to make the enumeration; forasmuch as the aggregate number is divided into parts, any imposition might be discovered with proportionable ease.
And here is a fuller paraphrase of Madison's comments on February 2, 1790:
And I am very sensible, Mr. Speaker, that there will be more difficulty attendant on the taking the census, in the way required by the constitution, and which we are obliged to perform, than there will be in the additional trouble of making all the distinctions contemplated in the bill. The classes of people most troublesome to enumerate, in this schedule, are happily those resident in large towns, the greatest number of artisans live in populous cities, and compact settlements, where distinctions are made with great ease.
I take it, sir, that in order to accommodate our laws to the real situation of our constituents, we ought to be acquainted with that situation. It may be impossible to ascertain it as far as I wish, but we may ascertain it so far as to be extremely useful, when we come to pass laws, affecting any particular description of people. If gentlemen have any doubts with respect to its utility, I cannot satisfy them in a better manner, than by referring them to the debates which took place upon the bills, intend, collaterally, to benefit the agricultural, commercial, and manufacturing parts of the community. Did they not wish then to know the relative proportion of each, and the exact number of every division, in order that they might rest their arguments on facts, instead of assertions and conjectures? Will any gentleman pretend to doubt, but our regulations would have been better accommodated to the real state of the society than they are? If our decisions had been influenced by actual returns, would they not have been varied, according as the one side or the other was more or less numerous? We should have given less encouragement in some instances, and more in others; but in every instance, we should have proceeded with more light and satisfaction.
Finally, this post repeats some material from a post back in March 2017 about the importance of government statistical agencies. But with the 2020 Census upon us, the message seemed to bear repeating.

Friday, March 20, 2020

Can the Economy Just Be Put on Hold for a Few Months?

The COVID-19 pandemic is an intertwined public health and economic event. Here are some comments from Richard Baldwin and Beatrice Weder di Mauro: "The social distancing policies are purposefully inducing an economic slowdown. ... The recession, so to speak, is a necessary public health measure. ... The recession is a medical necessity. That’s a given. But governments can and should try to flatten the economic recession curve. ... The key is to reduce the accumulation of ‘economic scar tissue’ – reduce the number of unnecessary personal and corporate bankruptcies, make sure people have money to keep spending even if they are not working."

The comments are from the "Introduction" to an e-book containing 24 short essays edited by Baldwin and Weder di Mauro, and just released by VoxEU: Mitigating the COVID Economic Crisis: Act Fast and Do Whatever It Takes. This is a follow-up to the ebook they produced less than two weeks ago, which I commented on in "Some Coronavirus Economics" (March 11, 2020). The collection has a lot of interesting analysis about fiscal and monetary policy in the current setting, along with specific discussions of the European Union, the European Central Bank, Italy, Germany,  China, Singapore, South Korea, and so on. 

Here, I want to focus a bit on a theme that comes up in a number of the essays: the idea that sensible economic policy can put the economy in the freezer for a few months, and the pull the economy out of the freezer, thaw it out, and restart it. I find myself in the awkward position here of largely being in agreement with this policy as a short-run approach, and at the same time also feeling that the ultimate consequences of the policy are going to be more difficult than a number of authors are envisaging. 

As one example of this theme in the book, Luis Garicano writes: "[A]t this point standard demand management is useless. Governments do not want to stimulate economic activity —they are doing all they can to stop it (they are asking people to stay at home!). Instead, economic policy is needed to ensure that the economy survives a ‘freeze’ of (hopefully, no more than) three to six months." 

As another, Pierre-Olivier Gourinchas writes: 
[I]n the short run, flattening the infection curve inevitably steepens the macroeconomic recession curve. Consider China, or Italy: increasing social distances has required closing schools, universities, most non-essential businesses, and asking ost of the working-age population to stay at home. While some people may be able to work from home, this remains a small fraction of the overall labour force. Even if working from home is an option, the short-term disruption to work and family routines is major and likely to affect productivity. In short, the – appropriate – public health policy plunges the economy into a sudden stop. ... A modern economy is a complex web of interconnected parties: employees, firms, suppliers, consumers, banks and financial intermediaries… Everyone is someone else’s employee, customer, lender, etc. A sudden stop like the one described above can easily trigger a cascading chain of events, fuelled by individually rational, but collectively catastrophic, decisions. ... To a first-order approximation, I would consider that governments may need to provide income support on a scale roughly comparable to the output lost.  
Rather than quote from a number of other authors, I'll try to sum up the economic policy goal in my own words. Sure, in normal times, it makes sense to have a dynamic economy where firms rise and fall depending on whether customers are willing to pay for what they produce, and it makes sense for a churning labor market to reallocate workers back and forth across these companies. 

But the novel coronavirus isn't a normal time. There is no reason to believe that it is a socially useful mechanism for sorting out which firms should expand or contract, or that it is a useful mechanism for reallocating labor across the economy. Instead, the goal of public policy should be to prevent firms from needing to fire workers permanently as a response to the pandemic. If firms need to use short-term layoffs, then government can help to replace lost income until workers get the call-back to return to work. The financial sector should be encouraged or subsidized to hold back on calling in loans or foreclosures. In some broad sense, the costs of an economic "freeze" due the coronavirus pandemic should be socialized. In the US, for example, perhaps the debt/GDP of the federal government rises by 5 percentage points of GDP, as the government provides support for the lost income across the economy.  

As I said earlier, I broadly share this vision of aggressive government action to ease the immediate economic burden of the pandemic. If the issue was as simple as whether to cut interest rates and raise government debt by 5 percentage points, then the policy choice would be simple for me. But ti's not that simple. 

1) As a matter of public health, there's no guarantee that COVID-19 is a one-time event. For example, the Great Influenza Epidemic of 1918-20 happened over three cycles. There is some reason for concern that in a globalized world, outbreaks of pandemics may be more common and spread faster than in the past. Even as we plunge into the immediate economic rescue, it's worth asking: Is this a pattern of public health and economic actions we are planning to repeat each year for the next 2-3 years? If such pandemics recur more frequently, is the the set of policies we are planning to follow once or twice a decade into the foreseeable future? For example, if very large fiscal policy actions to soften the economic blow of pandemics are going to be a recurrent and standard policy moving ahead, governments need to start planning ahead for them. 

2) The proposed plan as a matter of practical politics and legislation, will be able to turn on the rescue and then turn it off? For example, Olivier Blanchard offers this advice in the book: "[S]pend what you must on crisis containment and commit to wind down everything once the crisis is over. Full stop." The commitment to turning off the support is easy to say, but often hard to do, and the "winding down" process can extend a considerable time. 

3) As another matter of practical politics, support for business often tends to favor the big and the prominent. For example, in a US context there has been talk of assisting the airlines, which are big prominent companies, often with unionized employees, and thus lots of political clout. However, the tourism, entertainment, and restaurant industry is made up of much smaller firms, although as a group, they employ vastly more people.

4) It's easy to say that companies shouldn't be forced into bankruptcy by the coronavirus, and by and large, I agree. But we all know that some economic actors are more prudent than others. Some companies take on very high levels of debt, and some don't. Some people make sure to an amount equal to several months of income on hand, and others (who have similar levels of income) are rolling over large credit-card bills and paying interest from month to month. Yes, the pandemic was unexpected, but some firms and people build in a cushion deal with the unexpected, and some don't. Whenever government steps in to help those who are blindsided by an unexpected event, it benefits those who were not prudent over those who tried to be.

5) Finally, I'll add that any economy is not just a machine that can be switched off and on again. Helping households and firms to limp through the economic effects of this pandemic is worth doing, even at high costs to governments. But the economic disruption has costs of its own. Some number of the projects that companies were working on will be forever uncompleted. Relationships within and across organizations have been disrupted. It seems unlikely that customers and supply chains will simply restart their old patterns after a substantial disruption. Trust in providers will be shaken, sometimes for good reasons and sometimes for trivial ones.  There may be jump-starts toward companies doing more work online, or encouraging telecommuting. In health care, there may be shifts toward virtual consultations, or pharmacists providing more services, or how tests and treatments are approved and used. There may be surge to online education: after all, if online education is good enough for grades and credit at Harvard, Stanford, doesn't that show that it could be online at lots of other places after the pandemic passes? These pattern shifts and many more will outlast the pandemic itself, and will cause economic disruptions and costs of their own.

Thursday, March 19, 2020

The Spanish Flu of 1918-20: Health and Macroeconomic Effects

A century ago, the world went through the "Spanish flu," which was actually an epidemic that arrived in three waves from 1918-1920. Robert J. Barro, Jose F. Ursua, and Joanna Weng discuss "The coronavirus and the Great Influenza epidemic: Lessons from the `Spanish Flu'” (AEI Economics Working Paper 2020-02, March 2020). They write (footnotes omitted):
A reasonable upper bound for the coronavirus’s mortality and economic effects can be derived from the world’s experience with the Great Influenza Epidemic (popularly and unfairly known as the Spanish Flu), which began and peaked in 1918 and persisted through 1920. Our estimate, based on data discussed later on flu-related death rates for 43 individual countries, is that this epidemic killed around 39 million people worldwide, corresponding to 2.0 percent of the world’s population at the time. These numbers likely represent the highest worldwide mortality from a “natural disaster” in modern times, though the impact of the plague during the black death in the 14th century was much greater as a share of the population. 
The Great Influenza Epidemic arose in three main waves, the first in spring 1918, the second and most deadly from September 1918 to January 1919, and the third from February 1919 through the remainder of the year (with a fourth wave applying in some countries in 1920). This airborne infection was based on the Influenza A virus subtype H1N1. The coincidence of the two initial waves with the final year of World War I (1918) encouraged the spread of the infection, due to crowding of troops in transport, including large-scale movements across countries. An unusual feature was the high mortality among young adults without existing medical conditions. This pattern implies greater economic effects than for a disease with comparable mortality that applied mostly to the old and very young. 
The epidemic killed a number of famous people, including the sociologist Max Weber, the artist Gustav Klimt, the child saints Francisco and Jacinta Marto, and Frederick Trump, the grandfather of the current U.S. President. Many more famous people were survivors, including Mahatma Gandhi, Friedrich Hayek, General Pershing, Walt Disney, Mary Pickford, and the leaders of France and the United Kingdom at the end of World War I, Georges Clemenceau and David Lloyd George. The disease severely impacted U.S. President Woodrow Wilson, whose impairment likely had a major negative effect on the negotiations of the Versailles Treaty in 1919. Thus, if the harsh terms imposed on Germany by this treaty led eventually to World War II, then the Great Influenza Epidemic may have indirectly caused World War II. ...
Applying the flu death rates from the Great Influenza Epidemic to current population levels (about 7.5 billion worldwide in 2020) generates staggering mortality numbers. A death rate of 2.0 percent corresponds in 2020 to 150 million worldwide deaths. The number of deaths in the United States would be 6.5 million at the global death rate of 2.0 percent and 1.7 million at the U.S. death rate of 0.5 percent. However, these numbers likely represent the worst-case scenario today, particularly because public-health care and screening/quarantine procedures are more advanced than they were in 1918-1920.
The main purpose of the Barro, Ursua and Weng paper is to estimate macroeconomic effects of the Great Influenza Outbreak. It should be noted that this is a working paper, subject to later revision. The broad approach is to look at how outbreaks of flu intensity varied across countries and over time, and to draw inferences about changes in economic output accordingly. (For example, not all countries that had outbreaks of flu were much involved in World War I.).  But as the authors are quick to poiunt out, the quality of country-level data for this time period often isn't great. There is also the task of separating effects of flu from after-effects of World War I, including postwar depression and, in some countries, inflations on their way to becoming hyperinflations. Those with a taste for working through econometrics will certainly find other questions to raise.

Nonetheless, as an early take on events, the results caught my eye. By their calculations, the Great Influenza Outbreak was the fourth-worst global economic event since 1870, lagging behind only World War I, World War II, and the Great Depression. (Of course, Americans have a tendency to think of World War II as a time of rising economic output, but this was not the experience of the war across Europe and Asia).  Barro, Ursua, and Weng conclude this way:
The implications of our findings from the Great Influenza Epidemic for the ongoing coronavirus epidemic are unsettling. As noted before, the flu death rate of 2.0 percent out of the total population in 1918-1920 translates into 150 million deaths worldwide when applied to the world’s population of around 7.5 billion in 2020. Further, this death rate corresponds in our regression analysis to declines in the typical country by 6 percent for GDP and 8 percent for consumption. These economic declines are comparable to those last seen during the global Great Recession of 2008-2009. The results also suggest substantial short-term declines in real returns on stocks and short-term government bills. Thus, the possibility exists not only for unprecedented numbers of deaths but also for major global economic dislocation. Although these outcomes for the coronavirus are only possibilities, corresponding to plausible worst-case scenarios, the large potential losses in lives and economic activity justify substantial outlays to attempt to limit the damage. However, extreme mitigation efforts—such as widespread cancellations of travel, meetings, and major events—will themselves contribute to the depressed economic activity
A number of points here are worth reflection. For example, this kind of pandemic can be something that echoes over several years, not just a three-week or three-month event. The effects of a major outbreak will echo over time, both in terms of an effect on the lives of prominent people, but also through health effects that may not manifest themselves until decades later in life. At least so far, the mortality rate of coronavirus seems higher among the elderly and those with previous conditions, which is one of the several main reasons why this historical parallel is imperfect. Indeed, there is some argument--for example, expressed here by Nicholas Christakis--that COVID-19 may be closer to the quite 1957-8 outbreak of "Asian flu," rather than the 1918-1920 experience.

An overview from the CDC on the 1918 pandemic is available here.

Given the kerfuffle over whether to refer to viral outbreaks or diseases by using geographic names, I did find myself smiling at the comment from Barro, Ursua, and Weng about what I long-ago learned to call the "Spanish flu" of 1918-20:
Spain was not special in terms of the severity or date of onset of the disease but, because of its neutral status in World War I, did have a freer press than most other countries. The greater attention in news reports likely explains why the flu was called “Spanish.” In terms of mortality rates and total persons killed, it would be more appropriate to label the epidemic as the Indian Flu, although the highest mortality rate out of the total population, above 20 percent, may have been in Western Samoa. There is controversy about the origin point of the epidemic, with candidates including France, Kansas, and China.

Wednesday, March 18, 2020

US and International Stock Market Premiums in the Long Run

Stock markets can be volatile and risky in the short- and even the medium-run. But as a long-run average, stock markets (in the US, at least) have provided rewarding returns. Elroy Dimson, Paul Marsh, and Mike Staunton provide some useful background in the Credit Suisse Global Investment Returns Yearbook 2020.  The "Summary Report" is freely available on-line.

Here are a couple of figures showing nominal and real rates of return on stocks, bonds, and Treasury bills for the US market from 1900-2019. (Thanks to the authors for permission to reproduce the figures shown here.) In real terms, US stock market returns have risen at a 6.5% annual rate over this time, compared to 2.0% for bonds and 0.8% annually for bills. This is the "equity premium," the name given to the pattern that if you invest in stocks for the long term--and thus ride through the hills and valleys--your patience will be rewarded after a decade or two.
This general pattern of higher stock market returns holds across many countries, but it's stronger in the US than in most others. Here's a figure showing the return on equities from 1900 to 2019 for a range of countries. Sweden's (fairly small) stock market is at the top, with the US just a bit behind. Some of the stock markets that existed in 1900, like those in China and Russia, were  wiped out altogether. (Russia represented about 6% of global stock market capitalization in 1900).


The high returns for US stock market mean that over time, US stock market capitalization has become a substantially larger share of the global total. For example, the US stock market was 15% of total global stock market capitalization in 1899 (top pie graph), but was 54.5% of global stock market capitalization in 2019 (bottom pie graph).
This pattern raises some obvious questions. What specifically is it about US stock markets that has enabled them to grow so robustly over the long-term? In particular, are the key factors more closely related to events and patterns in the US economy as a whole? To characteristics of US corporations? Or to something in the US institutional/financial/legal framework which gives US shareholders a well-founded belief that their stock ownership gives them an actual claim on corporate profits that will be respected in the future? Naturally, these questions also raise concerns about whether US stock market investors with long-term horizons--like pension accounts, insurance companies, and retirement accounts held by individuals--will be able to count on higher stock market returns in the future, too.

The report by Dimson, Marsh, and Staunton  has a lot of other material of interest, as well: how factor investing has worked over time; the "golden age" of US bond markets from 1982-2014; environmental, social and governance investing; and more.

Tuesday, March 17, 2020

Federal Debt in a Time of Pandemic

In the midst of 1,001 ways that the government could increase spending or reduce taxes to blunt the immediate economic effect of the coronavirus pandemic, spare a moment for the existing level and trend of federal debt. The Congressional Budget Office has issued "Federal Debt:A Primer" (March 2020).

Here's the ratio of federal debt held by the public to GDP, going back to 1790. The "held by the public" means that when one part of the federal government loans money to another part of the federal government--like when the Social Security Trust Fund invests in US Treasury debt--this doesn't require the federal government to borrow from outside the government, and thus isn't counted in the total.
The historical spikes in the debt/GDP ratio are named easily enough. You can point out the rising levels of debt for the Revolutionary War, the Civil War, World War I, the Great Depression, World War II, the tax cuts and defense build-up of the 1980s, and the Great Recession. The current debt/GDP ratio is second-highest in US history, and trending toward highest. 

Much of the report focuses on the specific financial instruments that the Treasury uses to borrow:  short-term Treasury "bills" that are repaid in periods from one month up to one year; Treasury "notes" that are repaid over periods from two to 10 years; long-term Treasury "bond" repaid over 30 years; Treasury Inflation-Protected Securities (TIPS) where the principal value of the borrowing is adjusted for inflation twice a year; and Floating Rate Notes (FRNs) where the interest rate adjusts up and down based on the interest rate for 13-week Treasury bills. The report notes:
Since the late 1990s, Treasury notes typically have accounted for more than half of all outstanding marketable securities, peaking at 67 percent in 2013 . Treasury bills made up between 20 percent and 30 percent of marketable debt until 2010, when the Treasury began to issue fewer short-term instruments. Those securities declined to just 11 percent of marketable debt in 2015 before rising back to 15 percent in 2019. By the end of 2019, bonds accounted for 14 percent of the Treasury’s outstanding marketable debt, in line with their typical share since the end of the 1990s. TIPS were first issued in 1997 and—after an initial growth phase through 2004—have represented between 7 percent and 10 percent of outstanding marketable debt since then. By the end of 2019, the share of debt taken up by FRNs, which were introduced in 2014, was just 3 percent. ...

Offerings that best meet investors’ needs typically will lower the Treasury’s overall cost of borrowing. Short-term instruments generally have lower interest costs, but they expose the government to the risk of paying higher interest rates when it refinances the issues. Conversely, long-term securities typically involve higher rates but provide more certainty about the future costs of interest payments because they require less frequent financing.
Putting all of these together, the average time to maturity for federal borrowing hasn't changed much in the last two decades: as the figure shows, it got a little shorter during the Great Recession, but now it's back to roughly the same level as 2001.
How much of the Treasury borrowing has come from domestic sources and how much from foreign sources? About half comes from abroad, much of that from China and Japan.
One interesting point I had not considered before is the how higher student debt has played a role in raising federal debt. The CBO explains:
In 2011, the federal student loan program stopped providing loan guarantees to banks and instead began lending to borrowers directly, with the result that the magnitude of federal holdings of financial assets began to increase markedly. In total, at the end of 2019, the government’s financial assets—loans as well as cash—had an estimated value of nearly $1.8 trillion. Subtracting that amount from the $16.8 trillion in debt held by the public leaves about $15.0 trillion in debt held by the public net of financial assets. Debt held by the public at the end of 2019 was equal to about 79 percent of gross domestic
product; debt net of financial assets was about 71 percent of GDP.
The CBO report is focused on laying out trends and patterns, not on ringing the gong about possible dangers. However, there's a brief discussion of risks and effects at the end of the report.

1) "If federal debt as a percentage of GDP continues to rise at the pace of CBO’s current-law projections, the economy would be affected in two significant ways: Growth in the nation’s debt would dampen economic output over time, and higher interest costs would increase payments to foreign debt holders and thus reduce the income of U.S. households by rising amounts."

2) "The increases in debt that CBO projects would also pose significant risks to the fiscal and economic outlook, although those risks are not currently apparent in financial markets. ... High and rising federal debt increases the likelihood of a fiscal crisis because it erodes investors’ confidence in the government’s fiscal position and could result in a sharp reduction in their valuation of Treasury
securities, which would drive up interest rates on federal debt because investors would demand higher yields to purchase Treasury securities. However, the debt-to-GDP ratio has no identifiable tipping point because the risk of a crisis is influenced by other factors, including the long-term budget outlook, near-term borrowing needs, and the health of the economy. Moreover, because the United States currently benefits from the dollar’s position as the world’s reserve currency and because the federal government borrows in dollars, a financial crisis—similar to those that befell Argentina, Greece, or Ireland—is less likely in the United States. Although no one can predict whether or when a fiscal crisis might occur or how it would unfold, the risk is almost certainly increased by high and rising federal debt."

3) "Not all effects of the projected path of debt are negative, however. In addition to allowing policymakers to maintain current-law spending and revenue policies, that path would cause underlying interest rates to be higher than they otherwise would be, giving the Federal Reserve more flexibility in implementing monetary policy."

4) At the current moment, I'd emphasize one other reason mentioned briefly: "In addition, high debt might cause policymakers to feel constrained from implementing deficit-financed fiscal policy to respond to unforeseen events ..."  The enormous and fundamentally healthy US economy can take on more debt in response to the coronavirus. But it's just a fact that if you have already loaded up on borrowing, and your future tax and spending plans already have you locked into pattern of additional borrowing, then your flexibility is lower. The idea of taking steps to hold down the rise in federal borrowing is never going to be  popular. It feels as if it's all discipline and no benefit--right up to when a situation arises when you would like to be able to borrow with confidence in an unconstrained way to meet the challenge of a pandemic. 

Monday, March 16, 2020

Some Ruminations from Mars on Organizations and Informal Jobs

In high-income developed economies like the United States, we tend to take for granted that a large share of economic activity is organized within companies, and that these companies will hire workers and then organize and direct their efforts. However, in lower-income countries the notion of employment through firms cannot be taken for granted--as shown by a lack of "formal" jobs in those economies. .

For an extremely high-level view of the importance of business organizations--indeed, a view from Mars--a passage from Herbert A. Simon (Nobel '78) about two decades ago in an article he wrote for the Journal of Economic Perspectives ("Organizations and Markets, Spring 1991, pp. 25-44). Simon wrote:
A large part of the behavior of the system now takes place inside the skins of firms, and does not consist just of market exchanges. Counted by the head, most of the actors in a modern economy are employees, who either do not spend their days in trading, or if they do (for example, if they are salesmen or purchasing agents) are assumed to trade as agents of the firm rather than in their own interest, which might be quite different. ...

A mythical visitor from Mars, not having been apprised of the centrality of markets and contracts, might find the new institutional economics rather astonishing. Suppose that it (the visitor—I'll avoid the question of its sex) approaches the Earth from space, equipped with a telescope that reveals social structures. The firms reveal themselves, say, as solid green areas with faint interior contours marking out divisions and departments. Market transactions show as red lines connecting firms, forming a network in the spaces between them. Within firms (and perhaps even between them) the approaching visitor also sees pale blue lines, the lines of authority connecting bosses with various levels of workers. As our visitor looked more carefully at the scene beneath, it might see one of the green masses divide, as a firm divested itself of one of its divisions. Or it might see one green object gobble up another. At this distance, the departing golden parachutes would probably not be visible.

No matter whether our visitor approached the United States or the Soviet Union, urban China or the European Community, the greater part of the space below it would be within the green areas, for almost all of the inhabitants would be employees, hence inside the firm boundaries. Organizations would be the dominant feature of the landscape. A message sent back home, describing the scene, would speak of "large green areas interconnected by red lines." It would not likely speak of "a network of red lines connecting green spots."

Of course, if the vehicle hovered over central Africa, or the more rural portions of China or India, the green areas would be much smaller, and there would be large spaces inhabited by the little black dots we know as families and villages. But the red lines would be fainter and sparser in this case, too, because the black dots would be close to self-sufficiency, and only partially immersed in markets. But let us, for the present, restrict our attention to the landscape of the developed economies.

When our visitor came to know that the green masses were organizations and the red lines connecting them were market transactions, it might be surprised to hear the structure called a market economy. "Wouldn't 'organizational economy' be the more appropriate term?" it might ask. The choice of name may matter a great deal. The name can affect the order in which we describe its institutions, and the order of description can affect the theory.
In low-income countries, as Simon pointed out, the "green areas" of business organizations are far less prominent. As a result, jobs are more likely to be "informal," in the sense that they are people working on their own or as part of their own family, without regular wages. Here's are some columns from a table from the World Employmentand Social Outlook: Trends 2020 published by the International Labour Organization in January 2020. As the report points out, around the world about 60% of workers have informal jobs; in low-income countries, it's more like 90% (first column) Conversely, it's not a coincidence that in low income countries less than 20% of workers have jobs with wages and salaries (second column).
The ILO discusses these patterns in a section on "Paid work and the problem of decent work." Indeed, a main distinction in lower-income countries between the poor and the middle class in those countries is that the middle class are far more likely to have a formal job that pays a regular wage or salary.

When thinking about Simon's "green areas," there's no need to to the rhetorical extreme of extremes of Nicholas Murray Butler, president of Columbia University, who said in a 1911 speech: "The limited liability corporation is the greatest single discovery of modern times." But it's worth pointing out that a lot of public commentary is a more than a little schizophrenic about the social value of the "green areas." There is often strong criticism that the green areas are following their own logic and goals, which in a number of contexts (pollution is a leading example, direct assistance to the poor is another), may not line up with broader social goals.

Amidst the criticism, one can lose track of the reality that the green areas are the way that advanced economies around the world provide desired and secure jobs for their populations. The green areas are also a major social mechanism for organizing production and pursuing innovation. Indeed, many of the concerns about workers in the "gig economy" in high-income countries are about how workers may suffer if they don't have a well-defined and ongoing connection to a green area.

In lower-income countries, one of the major social challenges is how to generate decent jobs for growing populations (for discussion, see here , here, here). For these countries, providing the legal, social, and financial conditions where Simon's green areas can develop and sustain themselves--thus providing a foundation for secure jobs and future growth--is an important policy goal. Indeed, it seems to me that in many settings the arguments that favor free markets or express concern about free markets are not actually about "markets" per se: instead, they are about decisions being made inside the green areas and how to define the rules and responsibilities that should govern those decisions.

Friday, March 13, 2020

Sick Pay Benefits: A Labor Market and Public Health Issue

Providing sick pay to workers is often discussed in terms of fairness or social insurance against the risk of declining income, but it also has an important public health dimension. Employers might prefer that sick workers remain at home, rather than passing on their illness to the rest of the workforce. But workers who do not have sick pay won't get paid if they don't show up.

Most high-income countries in the world have government-required provision of sick pay. Researchers at the World Policy Analysis Center at UCLA compiled data in a 2018 report "Paid Leave for Personal Illness: A Detailed Look at Approaches Across OECD Countries."  They write that of 34 OECD countries, only the US and Korea do not have a guarantee of paid leave for personal illness. The details of implementation vary across  countries, of course. For example, two of these countries make employers solely responsible for paying for sick leave, nine countries have government solely responsible, and 21 have a mixture of the two. In the mixed systems, a common pattern is that employers pay for the first few weeks of sick leave, and then government takes over after that up to some limit like three or six months. A common pattern in these countries is that sick leave is 80% of regular pay.

In the US, sick leave is much less likely in lower-paying jobs. Here's a figure showing the pattern from the Kaiser Family Foundation:


Efforts to have federal sick pay rule in the US have gone nowhere. However, starting with San Franciso in 2007, a number of state and local governments have passed such rules in the last few years. Twelve states now have such laws, and a couple of dozen more cities, including New York City, Chicago, Philadelphia, Washington DC, Seattle, and Portland.  The typical pattern for these laws is that all employees earn  one hour of paid sick leave for every 30 to 40 hours worked. Of course, the idea behind this design is that a worker can't take a job and then immediately take paid sick leave, but a worker will accumulate roughly a day of paid sick leave for every 8 weeks worked. For a detailed and updated  "Interactive Overview of Paid Sick Time Laws in the United States," see the A Better Balance website.

What are the effects of these laws? Stefan Pichler and Nicolas R. Ziebarth have written "Labor Market Effects of U.S. Sick Pay Mandates," forthcoming in the Spring 2020 issue of the Journal of Human Resources (55:2, pp. 611–659). They look at employment and wage data over a time frame from 2001 to 2016 for nine cities and four states that have enacted sick pay rules. They create what is called a "synthetic control group," which is a set of cities and states that historically have followed the same patterns of employment and wages, but did not adopt a sick pay rule. Then, they can see whether adopting sick pay causes a change in  employment and wages compared to this control group. They find no evidence of such a change.

In a follow-up study, Johanna Catherine Maclean, Stefan Pichler, and Nicolas R. Ziebarth have published a working paper, "Mandated Sick Pay: Coverage, Utilization, and Welfare Effects" (March 2020, NBER Working Paper #26832, not freely available, but readers may have access through their institutiosn).  This study focuses on state-level sick-pay mandates, with data from 2009-2017. During this time, states are adopting sick pay mandates at different times. Thus, for these states and in comparison with other states, one can look for how patterns of sick leave coverage change when sick-pay mandates are adopted. They find:
Within the first two years following mandate adoption, the probability that an employee has access to paid sick leave increases by 18 percentage points from a base coverage rate of 66%. The increase in coverage persists for at least four years without rising further. Over all post-mandate periods covered by this paper, we find a 13 percentage point higher coverage rate attributable to state mandates. As a result of the increased access to paid sick leave, employees take more sick days ...  newly covered employees take two additional sick days per year. Employer sick leave costs also increase, but effect sizes are modest. On average, the increase amounts to 2.7 cents per hour worked ... Further, we find little evidence that sick pay mandates crowd-out non-mandated benefits such as paid vacation or holidays. Likewise, we find no evidence that employers curtail the provision of group policies such as health, dental, or disability insurance.
These studies are focused on labor market issues, and do not take public health effects into account. However, in a different working paper, Stefan Pichler, Katherine Wen,  Nicolas R. Ziebarth study 
"Positive Health Externalities of Mandating Paid Sick Leave" (February 2020).  Looking at state-level data, they find that in the first year after a state enacts sick pay, rates of doctor-certified influenza-like illness fell by about 11%.

This offered broad confirmation of results from an earlier study by Stefan Pichler and Nicolas R. Ziebarth, "The pros and cons of sick pay schemes: Testing for contagious presenteeism and noncontagious absenteeism behavior" (Journal of Public Economics, December 2017, pp. 14-33).  Looking at Google Flu data, they found that when U.S. employees gain access to paid sick leave, the general flu rate in the population decreases significantly, which suggests the possibility of less transmission of flu at work.

They also look at sick pay outcomes in Germany, a country with generous sick pay provisions. However, when Germany legislative changes allowed some flexibility to reduce sick pay from 100% of previous salary to 80%, the result was a large drop in more nebulous claims sickness claims like "back pain" but little drop for sickness claims related to infectious illnesses. This pattern suggests a plausible tradeoff: very generous sick pay can lead to workers taking time off for reasons not related to public health, but as sick pay becomes less generous, it will also lead to "contagious presenteeism" where contagious workers become more likely to show up at the job.

(In passing, I was also struck by this historical comment about Germany sick pay in the Pichler and Ziebarth 2017 paper: "Historically, paid sick leave was actually one of the first social insurance pillars worldwide; this policy was included in the first federal health insurance legislation. Under Otto van Bismarck, the Sickness Insurance Law of 1883 introduced social health insurance in Germany, which included 13 weeks of paid sick leave along with coverage for medical bills. The costs associated with paid sick leave initially made up more than half of all program costs, given the limited availability of (expensive) medical treatments in the nineteenth century ...")

Some US companies are now discovering that sick pay may matter to their business: for example,
"Amazon announces up to 2 weeks of paid sick leave for all workers and a 'relief fund' for delivery drivers amid coronavirus outbreak."  But the kinds of sick pay laws that have been gradually spreading through certain states and cities are partial and incomplete. The novel coronovirus outbreak suggests that a national sick pay policy--probably with employers responsible for the first weeks and then government serving as a back-up--is an issue with broad public health consequences, not just an argument over whether government should require companies to provide certain benefits. Sitting here in March 2020, it would have been nice to have a national sick-pay policy in place a few years ago, as a way of reducing the spread of coronavirus and cushioning the loss of income for those who become sick. But it's not too early to start prepping for the next pandemic.

Wednesday, March 11, 2020

Some Coronavirus Economics

Back in the mid-1980s, when I worked for a few years at the San Jose Mercury News as an editorial writer, my boss would sometimes remind us (channeling Murray Kempton): "An editorial writer is someone who comes down from the hills after the battle is over and shoots the wounded." Similarly, authors of books about important events have the luxury of time and distance before they commit themselves to print. But Richard Baldwin and and Beatrice Weder di Mauro, much to their credit,  decided to step into the arena of arguments about an appropriate response to the novel coronavirus while the disputes are ongoing by editing an e-book: Economics in the Time of COVID-19 (March 2020, free with registration from VoxEU.com). The very readable book was literally produces over a long weekend: it includes an "Introduction" and 14 short essays, many of them summarizing and drawing on longer work. Here, I'll draw up on some comments from the book as well as my own thoughts. 

1) The hard question is how bad the novel coronavirus will get, and the short answer is that nobody really knows. 

It is already clear that COVID-19 is worse than the SARS outbreak in 2002-3. Worldwide, that ended up being slightly more than 8,000 total cases and slightly less than 800 deaths. The Johns Hopkins School of Medicine maintains a continually updated page on confirmed cases of coronavirus around the world, as well as deaths and recoveries. As I write, it already has more than 120,000 cases and more than 4,000 deaths. 

For some context, the Centers for Disease Control estimates each year the cases and deaths from flu in the US. In the last decade or so, 2011-12 was a low mark for flu-related deaths, with "only" 12,000. Conversely, 2014-15 and  2017-18 were especially bad flu seasons in the US, with 51,000 and 61,000 deaths respectively. The 2009 Avian flu (N1H1) ended up causing between between 151,700 and 575,400 people deaths worldwide (according to Centers for Disease Control estimates), most of them in the US and Mexico. 

Predicting the path of an epidemic is difficult. Baldwin and Weder di Mauro offer a useful diagram, showing that in the early stages, a straight-line prediction will dramatically understate the harms, while in the middle stages, a straight-line prediction will dramatically overstate the harms. They offer a comment from Michael Leavitt, a former head of the US department of Health and Human Services: “Everything we do before a pandemic will seem alarmist. Everything we do
after will seem inadequate.” The challenge is to predict the length and peak of the curve --which depends not only on the epidemiology of the disease but also on what public health steps are taken. 
In addition, there is no guarantee that the coronavirus will ever disappear. AsBaldwin and Weder di Mauro note: "[T]he virus might become endemic – that is to say, a disease that reappears
periodically – in which case COVID-19 could become one of humanity’s constant
companions, like the seasonal flu and common cold."

2) What are some common estimates of potential economic losses from the coronavirus? In their chapter, Laurence Boone, David Haugh, Nigel Pain and Veronique Salins of the OECD  estimate a base scenario and a downside scenario. 
In a first best-case scenario, the epidemic stays contained mostly in China with limited
clusters elsewhere. ... In this best-case scenario, overall, the level of world GDP is reduced by up to 0.75% at the peak of the shock, with the full year impact on global GDP growth in 2020 being around half a percentage point. Most of this decline stems from the effects of the initial reduction in demand in China. Global trade is significantly affected, declining by 1.4% in the first half of 2020 and by 0.9% in the year as a whole. The impact on the rest of the world depends on the strength of cross-border linkages with China. ...

In the downside scenario, the outbreak of the virus in China is assumed to spread much
more intensively than at present through the wider Asia-Pacific region and the major
advanced economies in the northern hemisphere in 2020. ...  Together, the countries affected in this scenario represent over 70% of global GDP ... Overall, the level of world GDP is reduced by up to 1.75% (relative to baseline) at the peak of the shock in the latter half of 2020, with the full year impact on global GDP growth in 2020 being close to 1.5%.
Warwick McKibbin and Roshen Fernando simulate seven economic scenarios--three where the disease stays mainly in China, three where a pandemic spreads worldwide, and one in which a mild pandemic recurs each year into the future. For a sense of the range, their low pandemic scenario (S04) estimated 15 million deaths globally, with 236,000 in the US. Their most aggressive pandemic scenario (S06) is based on 68 million deaths worldwide, more than 1 million of them in the US. In this scenario, US GDP falls 8.4 percent in 2020, and the world economy falls by a similar amount.  To get a sense of what this scenario means, it is roughly equivalent to half the world's population being infected by the coronavirus, with a mortality rate of 2% for those infected.

3) How will the coronavirus affect the world trading system? Weber di Mauro writes: 
Supply chain disruptions may also turn out to be larger and more extended than is currently evident. Maersk, one of the world’s largest shipping companies, has had
to cancel dozens of container ships and estimates that Chinese factories have been
operating at 50-60% of capacity. Shipping goods to Europe from Asia via sea takes
about five weeks, so at the moment goods are still arriving from pre-virus times. The
International Chamber of Shipping estimates that the virus is costing the industry
$350m a week in lost revenues. More than 350 000 containers have been removed
and there have been 49% fewer sailings by container ships from China between mid
January and mid February. ... China has become a major source of demand in the world economy and many core European industries are highly dependent on the Chinese market. Sales in China account for up to 40% of the German car industry’s revenues, for example, and they have collapsed over the last weeks.
Richard Baldwin and Eiichi Tomiura write:
There is a danger of permanent damage to the trade system driven by policy and firms’ reactions. The combination of the US’ ongoing trade war against all of its trading partners (but especially China) and the supply-chain disruptions that are likely to be caused by COVID-19 could lead to a push to repatriate supply chains. Since they supply chains were internationalised to improve productivity, their undoing would do the opposite. We think this would be a misthinking of the lessons. Exclusively depending on suppliers from any one nation does not reduce risk –  it increases it. ...  We should not misinterpret pandemic as a justification for anti-globalism. Redundant dual sourcing from multiple countries alleviates the problem of excess dependence on China, though with additional costs. Japanese multinationals have already begun diversifying the destinations of foreign direct investment away from China in recent years, not foreseeing COVID-19 but prompted by Chinese wage hikes. We hope more intensive use of ICT enables firms to more effectively coordinate global sourcing.
4) Perhaps there will be a separation of global trade, which isn't likely to transmit pandemics, and free movement of people, which is more likely to do so. Joachim Voth raises this question clearly:

Fortunately, many – but not all – of the benefits of globalisation can be achieved without enormous health risks. The free exchange of goods and capital does not have to be restricted; only very few diseases are transmitted by contaminated goods. The free movement of people itself also contributes to the advantages of globalisation, but it is far less important for production. It is not obvious that running the risk of coronavirus outbreaks every few years – or worse – is a price worth paying for multiple annual vacation trips to Paris and Bangkok, say. Severe restrictions may well be desirable and justifiable, bringing to an end a half-century of ever-increasing individual mobility. In addition, specific restrictions could be brought in. For countries where, for example, wild animals are regularly sold and eaten (such as China, until recently), the certification for travel could be withheld without restrictions; anyone who comes or returns from there must undergo a medical examination and possibly spend a few weeks in quarantine. This would not only build a virtual plague wall against the next major outbreak, it would also put pressure on health authorities around the world to restrict dangerous practices that allow pathogens to jump from one species to the next. Even if airlines, hoteliers and tour operators would suffer from such rules in the short term and would complain, the lesson from Wuhan should be that we need a broad discussion within and outside of academia about how much mobility is actually desirable.
Voth also reminds us of some grim historical episodes:
The ship, Grand Saint Antoine, had already come to the attention of the port authority of Livorno. A cargo ship from Lebanon loaded with expensive textiles, it reached the port of Marseille in 1720. The Health Commission had its doubts – the plague was widespread in the eastern Mediterranean. Like all ships from affected regions, the Grand Saint Antoine was placed in quarantine. Normally, the crew and the property would have had to stay on board for 40 days to rule out the possibility of an infectious disease. But a textile fair near Marseille, where the importing merchants hoped for rich business, would soon begin. Under pressure from the rich traders, the health agency changed its mind. The ship could be unloaded, the crew went to town. 
After only a few days it was clear that changing the initial decision had been a mistake. The ship had carried the plague. Now the disease spread like a forest fire in the dry bush. The city authorities in Marseille could not cope with the number of deaths, with corpses piling up in the streets. ... At the behest of the French king and the pope, a plague wall (Mur de Peste) was built in Provence. Tourists can still see parts of it today. The wall was over two meters high and the watchtowers were manned by soldiers. Those who wanted to climb over it were prevented from doing so by force. Although some individuals managed to escape, the last major outbreak of black death in Europe was largely confined to Marseille. While probably 100,000 people – about a third of the population – died in Marseille, the rest of Europe was spared the repeated catastrophe of 1350 when millions of people lost their lives. 


5) Should the economic policies in response to the coronavirus be general or targeted? 

By general policies, I mean policies that refer to cuts in interest rates by central banks, or plans for government to send out checks to everyone (or in a US context, to cut Social Security payroll tax rates). By specific policies, I mean economic policies where the government focuses on specific issues like sick pay for workers not covered by employers, medical bills, support for small/medium firms with cash-flow problems, making sure banks have funds to lend and are not pushing firms into bankruptcy right now, and support for specific hard-hit industries like airlines and tourism.

John Cochrane put it this way:
We need a detailed pandemic response financial plan, sort of like an earthquake, flood, fire, or hurricane plan that (I hope!) local governments and FEMA routinely make and practice. Is there any such thing? Not that I know of, but I would be interested to hear from knowledgeable people if I am simply ignorant of the plan and it’s really sitting there under “Break glass in emergency” down in a basement of the Treasury or Fed. Without a pre-plan, can our political system successfully make this one up on the fly, as they made up the bank bailouts of 2008?
Then we have to figure out how to prevent the atrocious moral hazard that such interventions produce. Pandemics are going to be a regular thing. Ex-post bailout reduces further the incentive for ex-ante precautionary saving. Too good a fire department, and people store gasoline in the basement.
This starts down the same bailout and regulate road that suffocates our debt-based banking system. I welcome better ideas.
6) Will manufacturing or services be hit harder? 

Richard Baldwin and Eiichi Tomiura emphasize the problem for manufacturing:

An important point is that manufacturing is special. Manufactured goods are – on the whole – ‘postpone-able’ purchases. As we saw in the Great Trade Collapse of 2009, the wait-and-see demand shock impacts durable goods more than non-durable goods. In short, the manufacturing sector is likely to get a triple hit.
  1. Direct supply disruptions hindering production since the disease is focused on the world’s manufacturing heartland (East Asia), and spreading fast in the other industrial giants – the US and Germany.
  2. Supply-chain contagion will amplify the direct supply shocks as manufacturing sectors in less-affected nations find it harder and/or more expensive to acquire the necessary imported industrial inputs from the hard-hit nations, and subsequently from each other.
  3. Demand disruptions due to (1) macroeconomic drops in aggregate demand, i.e. recessions, and (2) precautionary or wait-and-see purchase delays by consumers, and investment delays by firms.
However, Catherine Mann points out that while manufacturing may be hit more in the short-term, it is also more likely to recoup its losses: 
Manufacturing will show a ‘V’ or ‘U’ shape. Manufacturing spillovers from factory closures loom large in the near term, but production will rebound to restock inventories once quarantines end and factories reopen. However, the duration of closures, as well as spillovers through supply chains and through virus cases and closures worldwide, will generate a set of Vs that should take on a U-shape in the global data. Importantly, the loss to global growth momentum will drag on both in individual country data and global rebound economic data, particularly trade and industrial production. Services, on the other hand, will experience an ‘L’ shape. The shock to tourism, transportation services, and domestic activities generally will not be recovered, and the projected slowing of global growth will further weigh on the L-shape evolution of demand for these non-storable tradeable services. Domestic services also will bear the brunt of the outbreak, depending in part on the responses of authorities, business, and consumers.