Wednesday, September 30, 2020

Checking on COVID-19 Economics Research: BPEA Fall 2020

 It would be a full-time job to keep up with the flow of economics research on aspects of COVID-19. Those who wish to take a closer look might begin with COVID Economics, a quick-turnaround journal which published its first issue on April 3, and has now just published its 50th issue. In that issue, the editor Charles Wyplosz reports the journal has published 332 papers so far. However, the flow of submissions has been slowing, from 6-7 submissions per day back in April to 1-2 submissions per day now. 

The National Bureau of Economic Research is another useful source for COVID-19 related research. The NBER website has one page that lists COVID-related papers by the week they are released, with a typical week including 5-10 new papers, and another page that organizes the paper by broad subject area (like effects on asset markets, effects of social distancing and other measures, macroeconomic effects, and so on). 

But if your personal idea of the good life doesn't involve surfing through these hundreds of research papers, and yet you would still more than a tiny taste of what economists have been doing on this subject, a useful starting point is the set of papers produced for the Fall 2020 Brookings Papers on Economic Activity. These papers both pull together a lot of the existing research and offer additional insights. Drafts of papers, presentation slides, and video are all available. Here's a list of the papers. Each link leads to a readable short overview of the main themes of the paper, and then a link to the paper itself: 

Here are a couple of illustrative figures from the paper by Fernández-Villaverde and Jones, showing the results of the COVID-19 epidemic across countries and states. The upper right of these diagrams represent places with high COVID-19 mortality and large economic losses; the upper left is low mortality but high economic losses. The lower left is low mortality and low economic losses. The lower right is high mortality but low economic losses. 

Here's a figure showing these health and economic results for countries. Countries that have performed the worst on both dimensions (upper right) would include Spain, the United Kingdom, Italy, and Belgium. The US is similar to Sweden and Netherlands, in having had a high level of COVID-related deaths but lower economic losses. In the bottom left are places like South Korea, Japan, China, Norway, Poland, and Denmark, with economic losses similar to the US but a much lower death rate. Taiwan is the extreme outlier, with almost no COVID-19 deaths and economic gains rather than losses (show here on the negative scale). 
 
Here's a similar graph at the level of US states, focusing on the monthly unemployment rate as the measure of economic outcomes. The worst outcomes in the upper right are for Massachusetts, New York, and New Jersey, with both high COVID-19 death rates and high unemployment. In the upper left, some western states like Hawaii, California, and Nevada (along with Pennsylvania) had large economic losses but much lower death rates. The states with both low death rates and low unemployment in the bottom left of the diagram include Utah, Idaho, Nebraska, and Montana. 


As Fernández-Villaverde and Jones emphasize, figuring out the extent to which the better results are a matter of luck or policy (or measurement issues) is an ongoing research task. Moreover, the outcomes are still evolving. Still, graphs like these offer a way of starting to think systematically about where the health and economic effects that have followed in the wake of COVID-19 have been better or worse, and thus offer a useful starting point for additional investigation. 

Tuesday, September 29, 2020

When Local Governments Subsidize Firms: Some Guidelines

Certain cities and metropolitan areas have been lagging in economic growth for decades, while others have surged ahead.  US regions used to be converging in economic terms, but this pattern has halted. These changes have been contributors to patterns of growing inequality, as well as to political divisions. This raises an obvious question: Can "place-based" public policy be used to stimulate the economy in slower-growth areas?  

I've written from time to time about proposals along these lines. For example, a couple of years ago Benjamin Austin, Edward Glaeser, and Lawrence H. Summers considered the problem and some of the options. For example, they pointed out that while additional infrastructure spending may be useful for other purposes, it's not clear that it's a tool that works well for touching off a wave of growth in a slow-growth area. They end up advocating geographically-targeted employment subsidies for jobs in certain geographic areas. 

Some of the proposals have focused more on spreading out research and development efforts across the country, through some combination of R&D funding at universities and technology centers. For example, last year Jonathan Gruber and Simon Johnson proposed that cities be able to bid for how they would used federal funds to support a local tech center. An independent commission would determining how the funds would be allocated, but the funds would go only to cities with a population of at least 100,000 workers from age 25-64, where the college-educated share of such workers is at least 25%, and where the mean home price is less that $265,000, and the commute is less than 30 minutes. The commission would also look at  measures of patents/worker in that area, as well as whether the area already has highly-ranked graduate school programs in science and tech areas. Robert D. Atkinson, Mark Muro, and Jacob Whiton made a broadly similar proposal for "growth centers" along these lines. 

The Summer 2020 issue of the Journal of Economic Perspectives offers a couple of other perspectives on place-based policies. Timothy J. Bartik  writes about "Using Place-Based Jobs Policies to Help Distressed Communities," with a particular focus on the $60 billion or so that state and local governments spend each year on incentives for businesses to locate in their area, mostly in the form of cash and tax incentives to specific companies. Bartik points out that moving people to different locations is hard, and economic and social problems in certain areas are persistent; thus, the potential payoff from additional jobs in depressed areas is high. But Bartik also points out that local politicians often prefer to offer relocation subsidies to a few large firms, who often don't even locate in the actually distressed areas. Thus, he offers some suggestions for how to make this approach cost-effective: 

First, place-based jobs policies should be more geographically targeted to distressed places. The benefits of more jobs are at least 60 percent greater in distressed places than in booming places. But our current incentive system does not significantly favor distressed places. 

Second, place-based jobs policies should be more targeted at high-multiplier industries, such as high-tech industries. Governors may claim they want to build the future economy, but state and local governments in practice do not target high-tech. One caveat: high-tech targeting should consider how to increase the access of current residents to these jobs. One model is Virginia’s recent offer for Amazon’s “Headquarters II.” Virginia’s offer included a new Virginia Tech campus in northern Virginia and increased funding at state colleges for tech-related programs. These education programs increased the odds that Virginia residents would fill Amazon’s jobs. 

Third, incentives should not disproportionately favor large firms, especially given the renewed concern in economics over excess market power in product markets and labor markets (Azar, Marinescu, and Steinbuam 2017; Gutiérrez and Phillippon 2017). 

Fourth, place-based jobs policies should put more emphasis on enhancing business inputs. Customized business services, infrastructure, and land development services have the potential to be more cost effective than incentives as ways to increase local jobs and earnings. 

Fifth, place-based policies should be a coordinated package of policies attuned to local conditions. One area may need more infrastructure; another, training; and still another, better land development processes. Place-based policies are complementary. If the local nonemployed are more skilled, job growth increases employment rates more. If more jobs are available, it is easier to design effective training programs. Business inputs are complementary—boosting infrastructure helps growth more if the local economy also has customized business services.
In another essay in the Summer 2020 JEP, Maximilian von Ehrlich and Henry G. Overman consider "Place-Based Policies and Spatial Disparities across European Cities." They point out that across the European Union, as in the United States, spatial disparities in income are large, persistent, and growing. The EU has a "cohesion" policy that seeks to reduce these differences by targeting certain metropolitan areas with subsidies, mainly for infrastructure and physical capital, but also to a more limited extent for employment training and subsidies to firms, They find that these policies have been modestly effective in ameliorating the ongoing trends, although not in reversing it. They also find that such subsidies tend to be more effective in areas that already have a relatively high number of educated workers. 

The economic forces that have led certain areas to be economically distressed for long periods of time are obviously powerful and slow to change. As I consider the proposals, I keep running into questions of political economy. Is it possible for the political system to do place-based targeting in a cost-effective way?  After all, the areas most in need of such targeting are also frequently the areas that currently lack economic and political clout. 

When national governments try to target assistance to distressed areas, it's common to see a dynamic where the definition of "distressed" keeps getting wider and wider, until it includes all major cities and all 50 states. A proposal for spreading R&D more widely across the country or starting "tech centers" or "growth centers" is likely to run into similar problems. When it comes to eligibility for employment subsidies, big companies know how to play the bureaucracy for maximum eligibility, while small companies do not. When state and local government think about business incentives, they have a bias toward a high-profile and costly deal where the governor or the mayor can shake hands with a CEO of a prominent company, and where there will be a ceremony to stick a shovel in the ground at the site of a new plant. There also seems to be a bias toward building physical infrastructure, surely in part because of behind-the-scenes lobbying for such contracts and also because of the photo opportunities for politicians when such projects are completed. 

In short, I can believe that well-targeted and well-designed incentives could have benefits that exceed  costs for areas that have experience long-term and persistent economic distress. I'm not confident that the political system can enact a large-scale version of such a program. It would require that the political representatives of metropolitan areas and states with high per capita incomes see it as in the interest of their own area to actively support efforts to launch economic growth in other areas. 

Friday, September 25, 2020

How the US Start-Up Industry is Faltering

One of the long-term strengths of the US economy has been that it fostered the growth of new businesses. Some provided employment for only a few, while others grew into giants. But that dynamic process of new businesses ultimately benefited not just those who worked in them, but also innovation, productivity, and consumers. But as I have pointed out in the past, there are a variety of signs that this business dynamism has been declining. Here are some additional pieces of evidence: 

Thomas Astebro, Serguey Braguinsky, and Yuheng Ding discuss "Declining Business Dynamism Among Our Best Opportunities: The Role of the Burden of Knowledge" (September 2020, NBER Wroking paper 27787). They write: 
We employ the nationally representative Survey of Doctorate Recipients to show a decline over the past 20 years in both the rate of startups founded and the share of employment at startups by the highest-educated science and engineering portion of the U.S. workforce. The declines are wide-ranging and not driven by any particular founder demographic category or geographic region or scientific discipline. 
Here's a figure focused just on those with PhDs in science and engineering fields. As the authors note: "The figure reports the share of PhDs in science and engineering who are employed full-time with non-zero salaries in new (five years old or less) private for-profit companies (startups) compared with PhDs in science and engineering who are employed full-time with non-zero salaries in all private for-profit businesses." The dashed line shows the share of this group who are employees in startups, while the solid line shows the share who are founders of start-ups. 

They argue that when dealing with new technology, the benefits of working established firm may be rising. They point out that PhDs in science and engineering who are starting firms now do tend to hae more business experience, suggesting that the task of running a new technology-based business might be becoming more complex, even as the potential rewards for doing so may be diminishing. 

First, entrepreneurial outcomes are immensely skewed. Only a very small subset of entrepreneurial ventures make a meaningful contribution to growth, job creation or productivity improvements. The average entrepreneurial venture typically ends up as economically marginal, under-sized and poorly performing enterprise, or a ‘Muppet’. The second finding is that the skewed distribution of outcomes seems to be decreasing over time. Positive outcomes are becoming less common. While the share of firms with growth intentions seems to be increasing, the quality of entrepreneurial ventures seems to be falling, with high-growth outcomes becoming more unlikely. The rare ‘gazelles’ and ‘unicorns’ that disproportionately propel the economy, are becoming rarer. Economically trivial ventures, are becoming more common.
The suggest that a possible answer is the rise of the "Entrepreneurship Industry," which has the goal of selling to people who want to see themselves as entrepreneurs. They write: 
The Entrepreneurship Industry leverages the Ideology of Entrepreneurialism to create products and services that can be marketed to entrepreneurs. The industry grows its own market by encouraging greater entry into entrepreneurship and persistence in entrepreneurial ventures, irrespective of their likelihood of success. In doing so, it has transformed entrepreneurship from a generally gainful economic activity into a largely wasteful form of conspicuous consumption motivated by aspirations to the socially attractive identity of ‘being an entrepreneur’. This form of wasteful entrepreneurship is what we refer to as Veblenian Entrepreneurship. That is entrepreneurship that masquerades as being innovation-driven and growth-oriented but is substantively oriented towards supporting the entrepreneur’s conspicuous identity work.
Josh Lerner and Ramana Nanda offer a different set of concerns in "Venture Capital's Role in Financing Innovation: What We Know and How Much We Still Need to Learn" (Journal of Economic Perspectives, Summer 2020, pp. 237-61). They argue that while the venture capital industry has had some great successes in the past, "venture capital financing also has real limitations in its ability to advance substantial technological change." In particular, 
Three issues are particularly concerning to us: 1) the very narrow band of technological innovations that fit the requirements of institutional venture capital investors; 2) the relatively small number of venture capital investors who hold and shape the direction of a substantial fraction of capital that is deployed into financing radical technological change; and 3) the relaxation in recent years of the intense emphasis on corporate governance by venture capital firms. We believe these phenomena, rather than being short-run anomalies associated with the ebullient equities market from the decade or so up through early 2020, may have ongoing and detrimental effects on the rate and direction of innovation in the broader economy.
They argue that venture capital firms have become narrower in their focus, looking for firms where the uncertainty about whether the business will succeed is likely to be resolved fairly quickly, and thus less willing to take on a wider variety of start-up ideas where the uncertainty will remain for a substantial time--and where the direct involvement of the venture capital firm in corporate governance over an extended time might make the difference between success and failure. As one example, here's how the focus of Charles River Associates has evolved over time:  
Charles River Ventures was founded by three seasoned executives from the operating and investment worlds in 1970. Within its first four years, it had almost completely invested its nearly $6 million first fund into 18 firms. These included classes of technologies that would be comfortably at home in a typical venture capitalist’s portfolio today: a startup designing computer systems for hospitals (Health Data Corporation), a software company developing automated credit scoring systems (American Management Systems), and a firm seeking to develop an electric car (Electromotion, which, alas, proved to be a few decades before its time). Other companies, however, were much more unusual by today’s venture standards: for instance, startups seeking to provide birth control for dogs (Agrophysics), highstrength fabrics for balloons and other demanding applications (N.F. Doweave), and turnkey systems for pig farming (International Farm Systems). Only eight of the 18 initial portfolio companies—less than half—were related to communications, information technology, or human health care.

The portfolio of Charles River Ventures looks very different in December 2019. Of the firms listed as investments, about 90 percent are classified as being related to information technology comprising social networks, applications for consumers, and software and services related to enhancing business productivity. Approximately 5 percent of investments are classified as being related to health care, materials, and energy. This shift in Charles River’s portfolio reflects the patterns of the industry at large ...

I don't feel as if I have a good handle on all the reasons for the decline in US startup firms. But it does seem to me that a lot of the private sector has become highly focused on start-up firms that involve web-based networking in one way or another. Fortunes can be made in such firms with a relatively small number of employees. In contrast, as Lerner and Nanda point out, start-ups in areas like clean energy or new materials may not have as clear a path to follow, and those thinking about starting such firms may not find it easy to get support from venture capital or with other parts of the finance system for start-ups. 

Thursday, September 24, 2020

Interview with Joshua Gans on Pandemic Economics

Like many of us, Joshua Gans found himself stuck at home in March. Unlike many of us, he decided to write a book about the pandemic. In fact, MIT Press put the first draft of the book up online for comments. David A. Price interviews Gans about lessons he learned in the process of writing the book, as well as about some of his other work on artificial intelligence and how an economist thinks about parenting (Econ Focus: Federal Reserve Bank of Richmond, "On managing pandemics, allocating vaccines, and low-cost prediction with AI," Second/Third Quarter 2020, pp. 18-22). Here are some thoughts from Gans on the policy response to the pandemic: 
What's reflected in the book that's coming out is that I now see these pandemics as manageable things. Policymakers have to react right away and stay the course, but pandemics can be managed. If I had to guess how history is going to judge this period, the judgment is going to be that this shouldn't have been a two- to three-year calamity, it should have been a three-month calamity.

The need for testing aggressively at the beginning had to be appreciated. You aggressively isolate people you find who are infected, you trace who they had contact with, and you aim for quick, complete suppression. The countries that had had experience with pandemics — Hong Kong, South Korea, Taiwan, most of Africa — got it right away. They knew what the problems would be if they didn't do anything about it. So experience with viruses was definitely a factor. But Canada had that and didn't quite get its act together quickly enough. ...

But once the virus breaks out, then you've got a problem. Then you've got to do the complete lockdown. And we're seeing places that did a complete lockdown — like they did in Italy, France, and Spain — squash it all the way down. Locking down is terribly painful; that's why you don't want to go through it in the first place. But you may have to. ... 

Early in the crisis, people in the United States and Canada were not talking about the virus as something we needed to suppress completely. The discussion was mainly, "We're going to push down the curve, and then we'll wait for a vaccine." But the evidence both historically and now with this virus is that, as I said, you can achieve suppression in months if you act quickly. You have to keep working at it because if you don't have a vaccine, the disease can crop up again, but it's manageable. ...

The issue of treatments is a little bit easier because you don't need enough for everybody. You just need enough to treat the sick. And fortunately, at any given time, there aren't that many people sick. Unless, of course, the virus goes out of control and there are a lot of people sick, with intensive care units filling up — that's going to create scarcity on the treatment side. That was the whole discussion back in March: Let's not let that happen. Let's keep the infection rate low so we can treat everybody. As it turned out, overrunning of hospitals was avoided by the skin of our teeth. If we had waited another week, it would've happened.
The interview also offers an insight from Gans about one way that technology has made it easier for to get children to clean their rooms--at least in the Gans household:
[Y]ou care about the mess in the room and the children do not. It is much easier to negotiate an outcome where you can find things that people care about equally: You care about X as much as I care about Y. So to negotiate with a child to clean up a messy room, you have to be able to find in that negotiation bundle something that the child cares as much about. ...

 I've found the most useful thing that I have that the child cares a lot about is the access to the Wi-Fi. I have a button that I can press to cut my children off from the internet. Suffice it to say, that's all I need. I may encounter resistance; I might encounter a child saying, "Fine! Shut off the internet, I don't need it!" But a few hours later, I'm getting a clean room. So there's new technology that has changed the balance. The iPad and other such devices are a parent's dream. They are reducing the cost of punishment.

The interview also explores some of Gans's insights about economic implications of artificial intelligence. He also wrote about that issue, with a couple of co-authors in the Spring 2019 issue of the Journal of Economic Perspectives in "Artificial Intelligence: The Ambiguous Labor Market Impact of Automating Prediction." 

Finally, as a mignardise. I'll point out that back in the Winter 1994 issue of the Journal of Economic Perspectives, when Josh was still a graduate student, he and George Shepherd had the idea of contacting leading economists around the world and asking for their most painful experience in having a paper rejected. They received responses from 60 economists, including 15 Nobel laureates. For anyone interested in back-story economics profession gossip and/or struggling with the vagaries of academic publishing, it may be either refreshing or disheartening to hear that the best-known and most successful have had their tribulations, too. The article is Joshua S., Gans and George B. Shepherd. 1994. "How Are the Mighty Fallen: Rejected Classic Articles by Leading Economists." Journal of Economic Perspectives, 8 (1): 165-179.

Tuesday, September 22, 2020

Where Federal Debt is Headed and Staying Off the Interest Payments Treadmill

By now, it's old news to anyone paying attention that the federal debt, based on current law, is on a trajectory to rise in an unsustainable way over the next few decades. What is less well-known, I think, is the extent to which these forecasts for rising federal debt rely on interest payments soaring out of control. The message comes through clearly in the Congressional Budget Office report "The 2020 Long-Term Budget Outlook" (September 2020). 

Here's the CBO projection for where federal debt is headed, based on current law. The federal debt/GDP ratio is now on the verge of surpassing its previous high, which was the debt incurred to fight World War II. These debt projections are typically viewed as conservative, because Congress often passes laws that suggest taxes will be raised or spending will be cut several years off in the future; for example, that the tax cuts in the 2017 Tax and Jobs Act will end in 2025. The CBO projections faithfully assume that these future tax increases and spending cuts will be enacted, but often when the date gets near, they are postponed until further into the future. 

This "baseline" prediction, as it is called, suggests that higher spending will be a main driver of the future deficits. This figure shows projections for future spending and tax revenues. The burst of pandemic-related spending is clearly visible. Looking at 2025, you can see a bump upward in tax revenues when certain tax cuts from the 2107 legislation are projected to expire. But outlays just keep rising. Why? 


One underappreciated factor is that at some point, a vicious circle emerges in which the interest payments on past borrowing get so big that they make annual budget deficits notably larger, which in turn drives interest payments higher, too. Here's a breakdown of the projected rise in federal spending by main categories. As you can see, spending on Social Security rises, as does spending on major health care programs. But it's net interest payments that really; indeed, the current projections are that interest payments will be larger than the Social Security program by the early 2040s.  

The obvious lesson here, as anyone with a credit card has learned, is that it's important to stay away from that treadmill where debt and interest payments on the debt keep driving each other to new heights. How might that be done? 

Part of the issue here is that we have been making a slow-motion decision over time to shift the role of the federal government away from investment and away from national defense, and toward social insurance. It has been obvious for decades now since that surge of birthrates after World War II that we call the "baby boom generation" that spending programs for the elderly like Social Security and Medicare would be expanding in the 2020s. We seem to have a fairly broad social consensus in support of the spending for these programs, but we haven't been able to agree on taxes to finance them. This figures shows the projected rise in these programs over time, how much of it can be attributed to the aging of the population, and for health care programs, how much can be attribute to what seems to be an inexorable rise in health care costs. 


There are a number of possible ways to stay off that interest payments treadmill via higher taxes or lower spending in other areas of the budget. But it's now 10 years since the passage of the Patient Protection and Affordable Care Act of 2010, and based on current campaign advertising by Democrats, it seems clear that it did not succeed either in holding down costs or providing an assurance of health insurance coverage. If a way could be found to hold down that excess growth in health care costs, it would be a big step in reducing the growth of federal debt and staying off the interest rate treademill.

Monday, September 21, 2020

An Overview of Emergency COVID-19 Lending from the Fed

 The Federal Reserve, like central banks everywhere, view providing financial liquidity during a crisis (being the "lender of last resort") as one of their core functions. What has the Fed done so far in the COVID-19 recession?. Tim Sablik offers a crisp overview in "The Fed's Emergency Lending Evolves" (Econ Focus: Federal Reserve Bank of Richmond, Second/Third Quarter 2020, pp. 14-17).  

Here's a list of the nine main lending programs the Fed has used, and to whom the credit was extended: 

And here's a graph showing how much was loaned under these programs as of August 12. The Main Street Lending Program doesn't appear on this graph because it had loaned $226 million--not enough to show up on a graph measured in tens of billions of dollars. 


As you can see, total Fed lending spiked very quickly in late March, then eased a little higher in late June and a little lower in early August. A short description of the various lending programs from the Federal Reserve is here; an update on lending through the end of August is here.  

In practical terms, the key test of emergency lending is whether it is repaid fairly soon, and thus fades away. When that happens--say, look at the blue Primary Dealer Credit Facility at the bottom of the figure--it suggests that the real problem was a short-term credit crunch, which soon resolved itself when the Fed made emergency loans available. The Money Market Mutual Fund Lending Facility seems on a similar trajectory. 

Based on the current data, the real challenge for current lending will be the Paycheck Protection Program Liquidity Facility--the program where the Fed helps banks to make loans to small-ish or at least non-huge companies so that they can meet payroll and not need to lay off workers. The Small Business Administration has the power to forgive these loans; in other words, any losses that arise from loan forgiveness in this program will be attributed to the SBA, not to the Fed.  

In broader terms, the key distinction is that it is acceptable for a central bank to be a lender of last resort in a short-term financial market panic, as arguably occurred in March, with the expectations that such loans will be repaid when the market stabilizes. The infamous section 13(3) of the Federal Reserve Act is the break-glass-in-case-of-emergency part of the law, which gives the Fed the authority to do "broad-based" lending under ""unusual and exigent circumstances." Section 13(3) got a workout during the Great Recession, and it is the legal justification for all nine of the lending programs above.  But as the Fed takes a few halting steps into assuring credit for corporate bond markets and for payroll protection, there is some danger that it is sticking a toe or two over the line of the lender of last resort role, and instead becoming a tool for extending credit in a few favored markets. 

Sunday, September 20, 2020

Advice on Writing from Ruth Bader Ginsberg

David Post offers some personal reminiscences about Ruth Bader Ginsberg at the Reason website ("RGB, R.I.P," September 18, 2020). As someone who has worked as an editor for a long time, several  pieces of her advice to him about writing resonated with me.  Here's a paragraph from Post (who got to know Ginsberg while clerking for her): 
Most of what I know about writing I learned from her. The rules are actually pretty simple: Every word matters. Don't make the simple complicated, make the complicated as simple as it can be (but not simpler!). You're not finished when you can't think of anything more to add to your document; you're finished when you can't think of anything more that you can remove from it. She enforced these principles with a combination of a ferocious—almost a terrifying—editorial pen, and enough judicious praise sprinkled about to let you know that she was appreciating your efforts, if not always your end-product. And one more rule: While you're at it, make it sing. At least a little; legal prose is not epic poetry or the stuff of operatic librettos, but a well-crafted paragraph can help carry the reader along, and is always a thing of real beauty.

Friday, September 18, 2020

Every Day is a Bad Day, Say a Rising Share of Americans

The Behavioral Risk Factor Surveillance System (BRFSS) is a standardized phone survey about health-related behaviors, carried out by the Centers for Disease Control and Prevention (CDC). One question asks: “Now thinking about your mental health, whicjh includes stress, depression, and problems with emotions, for how many days during the past 30 days was your mental health not good?” 

David G. Blanchflower and Andrew J. Oswald focus on this question in "Trends in Extreme Distress in the United States, 1993–2019" (American Journal of Public Health, October 2020, pp. 1538-1544).  I particular, they focus on the share of people who answer that their mental health was not good for all 30 of the previous 30 days, who they categorize as in a condition of "extreme distress." Here are some patterns: 

This graph shows the overall and steady rise for men and women from 1993-2019. 

Here's a breakdown for a specific age group of those 35-54 years of age, with a simple breakdown by education and by ethnicity. 
This kind of survey evidence doesn't let a researcher test for causality, but it's possible to look at some correlations. The authors write: "Regression analysis revealed that (1) at the personal level, the strongest statistical predictor of extreme distress was `I am unable to work,' and (2) at the state level, a decline in the share of manufacturing jobs was a predictor of greater distress."

Of course, one doesn't want to overinterpret graphs like this. The measures on the left-hand axis are single-digit percentages, after all. But remember, these people are reporting that their mental health hasn't been good for a single day in the last month. The share has been steadily rising over time, through different economic and political conditions. In those pre-COVID days of 2019, 11% of the white, non-college population--call it one out of every nine in this group--reported this form of extreme distress. The implications for both public health and politics seem worth considering. 

Thursday, September 17, 2020

Stock Buybacks: Leverage vs. Managerial Self-Dealing

Consider a company that has been earning profits, and wants to pay or all of those earnings to its shareholders. There are two practical mechanisms for doing so. Traditionally, the best-known approach was for the firm to pay a dividend to shareholders. But in the last few decades, many US firms instead have used stock buybacks. How substantial has this shift been, and what concerns does it raise? 

Here, I'll draw upon a couple of recent discussions of stock buybacks. Siro Aramonte writes about "Mind the buybacks, beware of the leverage," in the BIS Quarterly Review (September 2020, pp. 49-59). Kathleen Kahle and René M. Stulz tackle the topic from a different angle in "Why are Corporate Payouts So High in the 2000s? (NBER Working Paper 26958, April 2020, subscription required). 

Kahle and Stulz present the evidence both that overall corporate payouts to shareholders are up in the 21st century, and that stock buybacks are the primary vehicle by which this has happened. They calculate that total payouts from corporations to shareholders from 2000-2017 (both dividends and share buybacks) were about $10 trillion. They find that corporate payouts to shareholders have risen substantially post-2000, and that stock buybacks are the main vehicle through which this has happened. They write: 
In the 2000s, annual aggregate real payouts average roughly three times their pre-2000 level. ... Specifically, in the aggregate, higher earnings explain 38% of the increase in real constant dollar payouts and higher payout rates account for 62% of the increase. ...

In our data, the growth in payout rates, defined as the ratio of net payouts to operating income, comes entirely from repurchases. This finding is consistent with the evidence in Skinner (2008) on the growing importance of repurchases. Dividends average 14.4% of operating income from 1971 to 1999 and 14% from 2000 to 2017. In contrast, net repurchases, defined as stock purchases minus stocks issuance, average 4.8% of operating income before 2000 and 18.3% from 2000 to 2017.
The tax code offers obvious reasons for share buybacks, rather than dividends, as economists were already discussing back in the 1980s.  Dividends are subject to the personal income tax, and thus taxed at the progressive rates of the income tax. However, the gains of an investor who sells stock back to the company are taxed at the lower rate for capital gains. In addition, when a company pays a dividend, all shareholders receive it, but when a company announced a share buyback, not all shareholders need to participate, if they do not wish to do so. Thus, share buybacks offer investors more flexibility about when and in what form they wish to receive a payout from the firm. 

In addition, economists have also recognized for some decades that corporations will sometimes find themselves in a position of "free cash flow," where the company has enough money that it can make choices about whether it can find productive internal investments for the funds, or whether it will fiud a way to pay out the money to shareholders, or whether it will use the money to pay bonuses and perquisites to managers. If we agree that lavishing additional benefits on managers is not a socially attractive choice, and if the firm honestly doesn't see  how to use the money productively for internal investments, then paying the funds out to shareholders seems the best choice. 

The public response to firms that pay dividends is often rather different than when a firm does a share buyback--even when the same payout is flowing from the firm to its shareholders. The concern sometimes expressed is that corporate managers have an unspoken additional agenda with stock buybacks, which is to pump up the price of the company's stock--and in that way to increase the stock-based performance bonus for the managers.

Sirio Aramonte also documents the substantial rise in stock buybacks in recent decades. He points out that a primary cause for stock buybacks is for firms to increase their leverage--that is, to increase the proportion of their financing that happens through debt. He writes: "Corporate stock buybacks have roughly tripled in the last decade, often to attain desired leverage, or debt as a share of assets." This pattern especially holds true if the firm finances the stock buyback with borrowed money, rather than out of previously earned profits. He writes: 
In 2019, US firms repurchased own shares worth $800 billion (Graph 1, first panel; all figures are in 2019 US dollars). Net of equity issuance, the 2019 tally reached $600 billion. Net buybacks can turn negative, and they did during the GFC [global financial crisis of 2007-9], as firms issued equity to shore up their balance sheets. ... Underscoring the structural differences between dividends and buybacks, the former were remarkably smooth, while the latter proved procyclical and co-moved with equity valuations ...
Aramonte crisply summarizes the case for share buybacks: 
In a number of cases, repurchases improve a firm’s market value. For instance, if managers perceive equity as undervalued, they can credibly signal their assessment to investors through buybacks. In addition, using repurchases to disburse funds when capital gains are taxed less than dividends increases net distributions, all else equal. Furthermore, by substituting equity with debt, firms can lower funding costs when debt risk premia are relatively low, especially in the presence of search for yield. And, by reducing funds that managers can invest at their discretion, repurchases lessen the risk of wasteful expenditures.
What about the concern that corporate managers are using share buybacks to pump up their stock-based bonuses? Aramonte's discussion suggests that this may have been an issue in the past--say, pre-2005--but that the rules have changed. Companies have been shifting away from bonuses based on short-term stock prices, and toward bonuses based on long-term stock value for executives who stay with the firm. There are increased regulations and disclosure rules to limit this practice. Also, if CEOs were using stock buybacks in a short-term pump-and-dump strategy, then the stock price should first jump after a buyback and then fall back to its earlier level--and we don't see this pattern in the data. Thus, this concern that managers are abusing stock buybacks seems overblown. 

What about the linkages from stock buybacks to rising corporate debt? Aramonte provides some evidence, and also refers to the Kayle/Stulz study: 
[B]uybacks were not the main cause of the post-GFC rise in corporate debt. After 2000, internally generated funds became more important in financing buybacks. For one, economic growth resulted in rising profitability. In addition, firms exhibited a higher propensity to distribute available income. Kahle and Stulz (2020) find that cumulative corporate payouts from 2000 to 2018 were higher than those from 1971 to 1999 and that two thirds of the increase was due to this higher propensity.

In short, the overall level of rising corporate debt in recent years is a legitimate cause for concern (as I've noted here, here, and here). Share buybacks are one of the tools that US firms have used to increase their leverage, but the real issue here is whether the higher levels of debt have made US firms shakier, not the use of share buybacks as part of that strategy. The pandemic recession is likely to provide a harsh test of whether firms with more debt are also more vulnerable. As Aramonte writes: 

There is, however, clear evidence that companies make extensive use of share repurchases to meet leverage targets. The initial phase of the pandemic fallout in March 2020 put the spotlight on leverage: irrespective of past buyback activity, firms with high leverage saw considerably lower returns than their low-leverage peers. Thus, investors and policymakers should be mindful of buybacks as a leverage management tool, but they should particularly beware of leverage, as it ultimately matters for economic activity and financial stability.

Wednesday, September 16, 2020

Why Foreign Direct Investment Was Already Sagging

Foreign direct investment (FDI) involves a management component. In other words, it's not just a financial investment in stocks and bonds ("portfolio investment"), but involves partial or in some cases complete management responsibility. This distinction matters for a couple of reasons. One is that for developing countries in particular, FDI from abroad is a way of gaining local access to management skills, technology, and supply chains that might be quite difficult to do on their own. Another reason is that pure financial investments can come and go, sometimes in waves that bring macroeconomic instability in their wake, but FDI is typically less volatile and more of a commitment. 

FDI seems certain to plummet in 2020, given that so many global ties have weakened during the pandemic recession. But as the World Bank points out in its Global Investment Competitiveness Report 2019/2020: Rebuilding Investor Confidence in Times of Uncertainty, a decline in FDI was already underway. Here, I'll quote from the "Overview" of the report by Christine Zhenwei Qiang and Peter Kusek. They write (footnotes omitted): 

Even before the COVID-19 pandemic upended the global economy, global FDI was sliding to levels even below those last seen in the aftermath of the global financial crisis a decade ago (figure O.1, panel a). The decline was more concentrated in high-income countries, where inflows of FDI fell by nearly 60 percent in recent years. Although FDI to developing countries did not decline as steeply, it nonetheless fell to its lowest levels in decades relative to gross domestic product (GDP).  Compared with the mid-2000s, when FDI reached nearly 4 percent of GDP in developing countries, that share fell to under 2 percent in 2017 and 2018 (figure O.1, panel b).

What were the main drivers of this decline before 2020? Qiang and Kusek write that it's been a combination of economic, business, and political factors. They write: 

More specifically, worsening business fundamentals have driven much of the decline in FDI since 2015, when FDI flows reached their post-crisis peak. The global average rate of return on FDI decreased from 8.0 percent in 2010 to 6.8 percent in 2018 (UNCTAD 2019). While the rates of return have dropped in both developing and developed countries, the declines have been especially large in developing countries.

Furthermore, changing business models resulting from technological advances have driven declines in FDI levels and returns. In particular, increases in labor costs and the rise of advanced manufacturing technologies have eroded or decreased the significance of many developing countries’ labor cost advantages. At the same time, the increasing importance of the digital economy and services is shifting businesses toward more asset-light models of investment (UNCTAD 2019). In addition, commodity price slumps have adversely affected returns on FDI in more commodity-dependent markets (such as many economies in Latin America and the Caribbean, the Middle East and North Africa, and Sub-
Saharan Africa)
Countries around the world, including developing countries, have also become less supportive of FDI in recent years. This figure is based on actions by 55 countries, and whether those countries are changing their rules to be more or less favorable to FDI in a given year.

Much of the rest of the report is made up of case studies of the effects of FDI, including how governments can take full advantage of its potential benefits and cushion any resulting disruptions. But for now, that side of the argument seems to be losing ground.

Tuesday, September 15, 2020

Africa is Not Five Countries

Scholars of the continent of Africa sometimes feel moved to expostulate: "Africa is not a country!" In part, they are reacting against a certain habit of speech and writing where someone discusses, say, the United States, China, Germany, and Africa--although only the first three are countries. More broadly, they are offering a reminder that Africa is a vast place, and that generalizations about "Africa" may apply only to some of the 54 countries in Africa

Economic research on "Africa" apparently runs some risk of falling into this trap. Obie Porteous has published a working paper that looks at published economics research on Africa: "Research Deserts and Oases: Evidence from 27 Thousand Economics Journal Articles" (September 8, 2020). Porteus creates a database of all articles related to African countries published between 2000-2019 in peer-reviewed economics journals. He points out that the number of such articles has been rising sharply: "[T]he number of articles about Africa published in peer-reviewed economics journals in the 2010s was more than double the number in the 2000s, more than five times the number in the 1990s, and more than twenty times the number in the 1970s." His data shows over 19,000 published economics article about Africa from 2010-2019, and another 8,000-plus from 2000-2010. 

But the alert reader will notice how easy, as shown in the previous paragraph, to slip into discussing articles "about Africa." Are economists studying a wide range of countries across the continent, or are they studying relatively few countries. Porteous has some discouraging news here: "45% of all economics journal articles and 65% of articles in the top five economics journals are about five countries accounting for just 16% of the continent's population."

The "frequent 5" five much-studied countries are Kenya, South Africa, Ghana, Uganda, and Malawi. As Porteous points out, it's straightforward to compile the "scarce 7": the seven countries Sudan, D.R. Congo, Angola, Somalia, Guinea, Chad, and South Sudan,with the same population as the frequent 5, but account for only 3.5% of all journal articles and 4.7% of articles in the top 5 journals.

What explains what some countries are common locations for economic research while others are not? Porteous writes: "I show that 91% of the variation in the number of articles across countries can be explained by a peacefulness index, the number of international tourist arrivals, having English as an official language, and population." It's certain easier for many economists to do research in English-speaking countries that are peaceful and popular tourist destinations--and that's what has been happening. There's also evidence that even within the highly-researched countries, some geographic areas are more often researched than others. 

Of course, it's often useful for a research paper to focus on a specific situation. The hope is that as such papers accumulate, broad-based lessons begin to emerge that can apply beyond the context of a specific country (or area within a country). But local and national context is often highly relevant to the findings of an economic study. It seems that a lot of what economic research has learned about "Africa" is actually about a smallish slice of the continent. 

Monday, September 14, 2020

CEO/Worker Pay Ratios: Some Snapshots

Each year, US corporations are required to report the pay for their chief executive officers, and also to report the ratio of CEO pay to the pay of the median worker at the company. Lawrence Mishel and Jori Kandra report the results for 2019 pay in "CEO compensation surged 14% in 2019 to $21.3 million: CEOs now earn 320 times as much as a typical worker" (Economic Policy Institute, August 18, 2020). 

Back in the 1970s and 1980s, it was common for CEOs to be paid something like 30-60 times the wage of a typical worker. In 2019, the ratio was a multiple of 320. 
A result of this shift is that while CEOs used to be paid three times as much as the top 0,1% of the income distribution, now they are paid about six times as much. 
What is driving this higher CEO pay ratio? In an immediate sense, the higher pay seems to reflect changes in the stock market. The left-hand margin shows CEO pay; the right-hand margin shows the stock market as measured by the S&P 500 index. 
This rise in CEO/worker pay ratios has led to a continually simmering argument about the underlying causes. Does the rise reflect the market for talent, in the sense that that running a company in a world of globalization and technological change has gotten harder, and the rewards for those who do it well are necessarily greater? Or does it reflect a greater ability of CEOs to take advantage of their position in large companies to grab a bigger share of the economic pie? One's answer to this question will turn, at least in part, on whether you think CEOs have played a major role in the rise of the stock market since about 1990, or whether you think they have just been riding along on a stock market that has risen for other reasons. For an example of this dispute from a few years ago in the Journal of Economic Perspectives (where I work as Managing Editor), I recommend: 
Without trying to resolve that dispute here, I'd offer this thought: Notice that pretty much all of the increase in CEO/worker pay ratios happened in the 1990s, and the ratio has been at about the same level since then. Thus, if you think that the market for executive talent was rewarding CEOs appropriately, you need an explanation for why the increase happened all at once in about a decade, without much change since then. If you think the reason is that CEOs are grabbing a bigger share of the pie, you need an explanation for why CEOs became so much more able to do that in the 1990s, but then their ability to grab even-larger shares of the pie seemed to halt at that point. To put it another way, when discussing a change that happened in the 1990s, you need an explanation specific to the 1990s. 

I don't have a complete explanation to offer, but one obvious possible cause was in 1993, when  Congress and the Clinton administration enacted a bill with the goal of holding down the rise in executive pay (visible in the first graph above). Up into the 1980s, most top executives had been paid on via annual salary-plus-a-bonus. However, the new law put a $1 million cap on salaries for top executive, and instead required that other pay be linked to performance--which in practice meant giving stock options to executives. Although this law was intended to hold down executive pay, the was The stock market more-or-less tripled in value from late 1994 to late 1999, and so those who had stock options did very well indeed. My own belief is that combination of events reset the common expectations for what top executives would be paid, and how they would be paid, in a way that is a primary driver of the overall rise in inequality of incomes in recent decades. 

Friday, September 11, 2020

100 Million Traffic Stops: Evidence on Racial Discrimination

 A primary challenge in doing research on racial discrimination is that you need to answer the "what if" questions. For example, it's not enough for research to show that blacks are pulled over by police for traffic stops more often than whites. What if more blacks were driving in a way that caused them to be pulled over more often? A researcher can't just dismiss that possibility. Instead, you need to find a way to think about the available data in a way that addresses these kinds of  "what if" questions. 

When it comes to traffic stops, for example, one approach is to look at such stops in the shifting time window between daytime and darkness. For example, compare the rate at which blacks and whites are pulled over for traffic stops in a certain city during a time of year when it's light outside at 7 pm and at a time of year when it's dark outside at 7 pm. One key difference here is that when it's light outside, it's a lot easier for the police to see the race of the driver. If the black-white difference in traffic stops around 7 in the evening is a lot larger when it's light at that hour than when it's dark at that hour, then racial discrimination is a plausible answer.  Taking this idea a step further, a researcher can look at the time period just before and after the Daylight Savings Time time shifts.

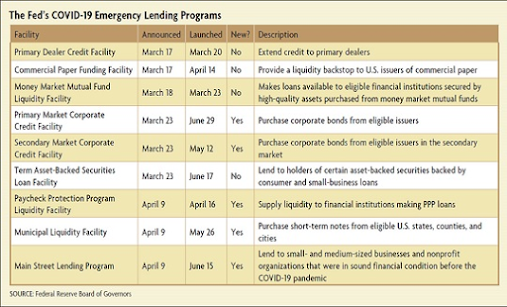
A team of authors use this approach and others in "A large-scale analysis of racial disparities in police stops across the United States," published in Nature Human Behavior (July 2020, pp. 736-745, authors are  Emma Pierson, Camelia Simoiu, Jan Overgoor , Sam Corbett-Davies, Daniel Jenson, Amy Shoemaker , Vignesh Ramachandran, Phoebe Barghouty, Cheryl Phillips, Ravi Shroff and Sharad Goel ). The authors make public records request in all 50 states, but (so far) have ended up with "a dataset detailing nearly 100 million traffic stops carried out by 21 state patrol agencies and 35 municipal police departments over almost a decade." Their analysis sounds like this: 

In particular, among state patrol stops, the annual per-capita stop rate for black drivers was 0.10 compared to 0.07 for white drivers; and among municipal police stops, the annual per-capita stop rate for black drivers was 0.20 compared to 0.14 for white drivers. For Hispanic drivers, however, we found that stop rates were lower than for white drivers: 0.05 for stops conducted by state patrol (compared to 0.07 for white drivers) and 0.09 for those conducted by municipal police departments (compared to 0.14 for white drivers). ... 

These numbers are a starting point for understanding racial disparities in traffic stops, but they do not, per se, provide strong evidence of racially disparate treatment. In particular, per-capita stop rates do not account for possible race-specific differences in driving behaviour, including amount of time spent on the road and adherence to traffic laws. For example, if black drivers, hypothetically, spend more time on the road than white drivers, that could explain the higher stop rates we see for the former, even in the absence of discrimination. Moreover, drivers may not live in the jurisdictions where they were stopped, further complicating the interpretation of population benchmarks.

But here's some data from the Texas State Patrol on the share of blacks stopped in different evening time windows: 7:00-7:15, 7:15-7:30, and 7:30-7:45. A vertical line shows "dusk," considered the time when it is dark. The researchers ignore the 30 minutes before dusk, when the light is fading, and focus on when the period before and after that window. You can see that the share of black drivers stopped is higher in the daylight, and then lower after dark.

Another test for racial discrimination looks at the rate in which cars are searched, and then looks at the success rate of those searches. Interpreting the result of this kind of test can be mildly complex, and it's useful to go through two steps to understand the analysis. The the authors explain the first step in this way: 
In these jurisdictions, stopped black and Hispanic drivers were searched about twice as often as stopped white drivers. To assess whether this gap resulted from biased decision-making, we apply the outcome test, originally proposed by Becker, to circumvent omitted variable bias in traditional tests of discrimination. The outcome test is based not on the search rate but on the ‘hit rate’: the proportion of searches that successfully turn up contraband. Becker argued that even if minority drivers are more likely to carry contraband, in the absence of discrimination, searched minorities should still be found to have contraband at the same rate as searched whites. If searches of minorities are successful less often than searches of whites, it suggests that officers are applying a double standard, searching minorities on the basis of less evidence. ... 

Across jurisdictions, we consistently found that searches of Hispanic drivers were less successful than those of white drivers. However, searches of white and black drivers had more comparable hit rates. The outcome test thus indicates that search decisions may be biased against Hispanic drivers, but the evidence is more ambiguous for black drivers.

This approach sounds plausible, but if you think about it a little more deeply, it's straightforward to come up with examples where might not work so well. Here's an example: 

[S]uppose that there are two, easily distinguishable, types of white driver: those who have a 5% chance of carrying contraband and those who have a 75% chance of carrying contraband. Likewise assume that black drivers have either a 5 or 50% chance of carrying contraband. If officers search drivers who are at least 10% likely to be carrying contraband, then searches of white drivers will be successful 75% of the time whereas searches of black drivers will be successful only 50% of the time. Thus, although the search criterion is applied in a race-neutral manner, the hit rate for black drivers is lower than that for white drivers and the outcome test would (incorrectly) conclude that searches are biased against black drivers. The outcome test can similarly fail to detect discrimination when it is present.
To put it another way, the decision to search a vehicle is binary: you do it or you don't do it. Thus, the key issue is the threshold that a police officer applies in deciding to search. As in this example, you can think of the threshold in this way: if the percentage chance of finding something is above the threshold level, a search happens; if it's below that level, a search doesn't happen. The next step is to estimate these threshold probabilities: 
In aggregate across cities, the inferred threshold for white drivers is 10.0% compared to 5.0 and 4.6% for black and Hispanic drivers, respectively. ... Compared to by-location hit rates, the threshold test more strongly suggests discrimination against black drivers, particularly for municipal stops. Consistent with past work, this difference appears to be driven by a small but disproportionate number of black drivers who have a high inferred likelihood of carrying contraband. Thus, even though the threshold test finds that the bar for searching black drivers is lower than that for white drivers, these groups have more similar hit rates.
A short takeaway from this research is that when blacks complain about being stopped more often by police, there is solid research evidence backing up this claim. The evidence on blacks being searched more often in a traffic stop is real, but probably best-viewed as a little weaker, because it doesn't show up in the basic "success rate of searches" data and instead requires the more complex threshold analysis. 

For other discussions of how social scientists try to pin down evidence the extent to which racial discrimination underlies racial disparities, see: 

Wednesday, September 9, 2020

Misperceptions and Misinformation in Elections Campaigns

It's an election season, so many people are widely concerned about  how all those other voters are going to be misinformed into voting for the wrong candidate. Brendan Nyhan provides an overview of some research in this area in "Facts and Myths about Misperceptions" (Journal of Economic Perspectives, Summer 2020, 34:3, pp. 220-36). 

To be clear, Nyhan describes misperceptions as "belief in claims that can be shown to be false (for example, that Osama bin Laden is still alive) or unsupported by convincing and systematic evidence (for example, that vaccines cause autism)." Thus, he isn't talking about issues of shading or emphasis. Nyhan writes: "Misperceptions present a serious problem, but claims that we live in a `post-truth' society with widespread consumption of `fake news' are not empirically supported and should not be used to support interventions that threaten democratic values." 

So why is the belief that everyone on the other side of the political fence is subject to dramatic misperceptions so widespread. One reason is that both academic research and examples of that research in the media tend to focus on examples with partisan distinctions. 
Public beliefs in such claims are frequently associated with people’s candidate preferences and partisanship. One December 2016 poll found that 62 percent of Trump supporters endorsed the baseless claim that millions of illegal votes were cast in the 2016 election, compared to 25 percent of supporters of Hillary Clinton (Frankovic 2016). Conversely, 50 percent of Clinton voters endorsed the false claim that Russia tampered with vote tallies to help Trump, compared to only 9 percent of Trump voters. But not all political misperceptions have a clear partisan valence: for example, 17 percent of Clinton supporters and 15 percent of Trump supporters in the same poll said the US government helped plan the terrorist attacks of September 11, 2001.

One of my favorite examples is a study which showed respondents pictures of the Inauguration Day crowds for  President Obama in 2009 and President Trump in 2017.: "When the pictures were unlabeled, there was broad agreement that the Obama crowd was larger, but when the pictures were labelled, many Trump supporters looked at the pictures and indicated that Trump’ crowd was larger, an obviously false claim that the authors refer to as `expressive responding.'” (I love the term "expressive responding.")

Sometimes that people are aware of slanting their answers in this way. When people give these kinds of answers to poll questions, they often know (and will say when asked) that some of their answers are based on less evidence than others. One study offered small financial incentives (like $1) for accurate answers, and found that the partisan divide was reduce by more than 50%.  

But other times, people make meaningful real-world decisions based on these kinds of partisan feelings. as one example with particular relevance just now, evidence from the George W. Bush and Barack Obama administrations suggests that when the president you supported is in office, people "express more trust in vaccine safety and greater intention to vaccinate themselves and their children than opposition partisans," which shows up in actual patterns of school vaccinations. 

An underlying pattern that comes up in this research is that if people are exposed to an concept many times (an example is the false statement “The Atlantic Ocean is the largest ocean on Earth”), they become more likely to rate it as true. The underlying psychology here seems to be that when a claim seems familiar to people, because of repeated prior exposure, they become more likely to view it as true. An implication here is that while those who marinate themselves in social media discussions of news may be more likely to think of themselves as well-informed, they are also probably more likely to have severe misperceptions. Indeed, people who are more knowledgeable are also the same people who have become aware of how to deploy counterarguments so that they believe their misperceptions even more strongly. 

Nyhan's paper mentions many intriguing studies along these lines. But do we need public action to fight misperceptions? It's not clear that we do. A common finding in these studies is that if someone discovers and admits that they have a misperception on a certain issue, it doesn't actually change their partisan beliefs.  "Fact-checking" websites have some use, but they can also be another way of expressing partisanship--and those who hold misperceptions most strongly are not likely to be reading fact-checking sites, anyway. Even general warnings about "fake news" can backfire. Some research suggests that when people are warned about fake news, they become skeptical of all news, not just part of it. One interesting study warned a random selection of candidates in nine states who were running for office in 2012 that the reputational effects of being called out by fact-checkers could be severe, and found that candidates who received the warnings were less likely to have their accuracy publicly challenged. 

Nyhan concludes with this response to suggestions for more severe and perhaps government-based interventions against misperceptions: 

Calls for such draconian interventions are commonly fueled by a moral panic over claims that “fake news” has created a supposedly “post-truth” era. These claims falsely suggest an earlier fictitious golden age in which political debate was based on facts and truth. In reality, false information, misperceptions, and conspiracy theories are general features of human society. For instance, belief that John F. Kennedy was killed in a conspiracy were already widespread by the late 1960s and 1970s (Bowman and Rugg 2013). Hofstadter (1964) goes further, showing that a “paranoid style” of conspiratorial thinking recurs in American political culture going back to the country’s founding. Moreover, exposure to the sorts of untrustworthy websites that are often called “fake news” was actually quite limited for most Americans during the 2016 campaign—far less than media accounts suggest (Guess, Nyhan, and Reifler 2020). In general, no systematic evidence exists to demonstrate that the prevalence of misperceptions today (while worrisome) is worse than in the past.
Or as I sometimes say, perhaps the reason for disagreement isn't that the other side has been gulled and deceived, and if they just learned the real true facts then they would agree with you. Maybe the most common reason for disagreement is that people actually disagree.

Tuesday, September 8, 2020

Shifts in How the Fed Perceives the US Economy

For the first time since 2012, the Federal Reserve  has updated its "Statement on Longer-Run Goals and Monetary Policy Strategy," and has produced a useful "Track Changes" version of the alterations. A set of 12 notes and background papers for these changes is available, too. Perhaps the main substantive change is that the specifies that if inflation has run below its 2% annual target rate for a time, it will then expect inflation to run above that 2% rate for a time. Thus, the Fed's 2% annual rate of inflation should not be viewed as an upper bound on the inflation it will allow, but rather as a long-run average. I have nothing against this change, but I strongly suspect that it is not a fix for ails the US economy.  

Here, I want to focus instead on a different set of changes that have been happening since 2012: specifically, changes in how the Fed sees the long-run future of the US economy. To put it another way, when short-run fluctuations work themselves out, where is the US economy headed? In his speech describing the Fed's new policy statement, Fed chair Jerome Powell ("New Economic Challenges and the Fed's Monetary Policy Review, August 27, 2020) described how the Fed's view have been shifting toward an expectation of slower long-run growth.

From Powell's speech, Here are some estimates of long-run economic growth from the Federal Open Market Committee (the committee within the Fed that sets monetary policy), as well as the private forecast summarized by the Blue Chip indicators and the Congressional Budget Office. Eight years ago, it was common to think that long-run growth in real US GDP would be about 2.5%; now, the long-run growth rates is more commonly estimated at 1.75%.
It's worth remembering that these growth rates are annual, and accumulate over time. Thus, a seemingly small difference in growth rates of 0.75%, accumulated over a decade, will mean a GDP that is about 7.5% smaller at that time. In very round numbers, the US GDP would be $2 trillion smaller in a decade as a result of this slower growth rate--which in turn means lower average incomes and less tax revenue for the government.

Another big shift is an expectation of a lower unemployment rate. Back in 2012, the common belief was that the unemployment rate wouldn't fall much lower than 6%; now, the sense is that it will eventually fall to about 4%. 

Powell also points out that the Fed believes interest rates have fallen around the world. The Fed calculates a "neutral" interest rate--that is, the interest rate which emerges from supply and demand and isn't either a stimulant or a drag on the economy in the long run. Powell says (footnotes and references to figures omitted): 
[T]he general level of interest rates has fallen both here in the United States and around the world. Estimates of the neutral federal funds rate, which is the rate consistent with the economy operating at full strength and with stable inflation, have fallen substantially ... This rate is not affected by monetary policy but instead is driven by fundamental factors in the economy, including demographics and productivity growth—the same factors that drive potential economic growth. The median estimate from FOMC participants of the neutral federal funds rate has fallen by nearly half since early 2012, from 4.25 percent to 2.5 percent.

As Powell points out, the lower interest rate means that the Fed has less power to stimulate the economy by reducing interest rates--because the interest rate is already closer to zero percent. Powell writes: "This decline in assessments of the neutral federal funds rate has profound implications for monetary policy. With interest rates generally running closer to their effective lower bound even in good times, the Fed has less scope to support the economy during an economic downturn by simply cutting the federal funds rate."

In my own view, these changes in beliefs about the long-run direction of the US economy have at least two main implications. One is that a serious economic agenda for the future needs to focus on how to improve productivity and long-run economic growth. Another is that when (not if) the economy goes bad the next time, the Federal Reserve will be in a weakened position to provide assistance, so thinking in advance about what policies could kick in very quickly seems worth consideration

Monday, September 7, 2020

What is a "Good Job"?

On the surface, it's easy to sketch what a "good job" means: having a job in the first place, along with good pay and access to benefits like health insurance. But that quick description is far from adequate, for several interrelated reasons. When most of us think about a "good job," we have more than the paycheck in mind. Jobs can vary a lot in working conditions and predictability of hours. Jobs also vary according to whether the job offers a chance to develop useful skills and a chance for a career path over time. In turn, the extent to which a worker develops skills at a given job will affect whether that worker worker is a replaceable cog who can expect only minimal pay increases over time, or whether the worker will be in a position to get pay raises--or have options to be a leading candidate for jobs with other employers.

[This essay was originally published back in 2016, but it seemed worth revisiting with some minor updates on this Labor Day holiday.] 

A majority of Americans do not consider themselves to be "engaged" with their jobs. According to Gallup polling, the share of US workers who viewed themselves as "engaged" in their jobs had risen to 35% in 2019, while 52% were "not engaged" and 13% were "actively disengaged." One suspects this level of engagement will drop after the pandemic recession

What makes a "good job" or an engaging job? The classic research on this seems to come from the Job Characteristics Theory put forward by Greg R. Oldham and J. Richard Hackman back in a series of papers written in the the 1970s: for an overview, a useful starting point is their 1980 book Work Redesign. Here, I'll focus on their 2010 article in the Journal of Organizational Behavior summarizing some findings from this line of research over time, "Not what it was and not what it will be: The future of job design research" (31: pp. 463–479).

Oldham and Hackman point out that from the time when Adam Smith described making pins and back in the eighteenth century up through when Frederick W. Taylor led a wave of industrial engineers doing time-and-motions studies of workplace activities in the early 20th century, and up through the assembly line as viewed by companies like General Motors and Ford, the concept of job design focused on the division of labor. In my own view, the job design efforts of this period tended to view workers as robots that carried out a specified set of physical tasks, and the problem was how to make those worker-robots more effective.

Whatever the merits of this view for its place and time, it has clearly become outdated in the last half-century or so. Even in assembly-line work, companies like Toyota that cross-trained workers for a variety of different jobs, including on-the-spot quality control, developed much higher productivity than their US counterparts. And for the swelling numbers of service-related and information-related jobs, the idea of an extreme division of labor, micro-managed at every stage, often seemed somewhere between irrelevant and counterproductive. When worker motivation matters, the question of how to design a "good job" has a different focus.

By the 1960s, Frederick Herzberg is arguing that jobs often need to be enriched, rather than simplified. In the 1970s, Oldham and Hackman develop their Job Characteristics Theory, which they describe in the 2010 article like this:
We eventually settled on five ‘‘core’’ job characteristics: Skill variety (i.e., the degree to which the job requires a variety of different activities in carrying out the work, involving the use of a number of different skills and talents of the person), task identity (i.e., the degree to which the job requires doing a whole and identifiable piece of work from beginning to end), task significance (i.e., the degree to which the job has a substantial impact on the lives of other people, whether those people are in the immediate
organization or the world at large), autonomy (i.e., the degree to which the job provides substantial freedom, independence, and discretion to the individual in scheduling the work and in determining the procedures to be used in carrying it out), and job-based feedback (i.e., the degree to which carrying out the work activities required by the job provides the individual with direct and clear information about the effectiveness of his or her performance).
Each of the first three of these characteristics, we proposed, would contribute to the experienced meaningfulness of the work. Having autonomy would contribute to jobholders felt responsibility for work outcomes. And built-in feedback, of course, would provide direct knowledge of the results of the work. When these three psychological states were present—that is, when jobholders experienced the work to be meaningful, felt personally responsible for outcomes, and had knowledge of the results of their work—they would become internally motivated to perform well. And, just as importantly, they would not be able to give themselves a psychological pat on the back for performing well if the work were devoid of meaning, or if they were merely following someone else’s required procedures, or if doing the work generated no information about how well they were performing.
 Of course, not everyone at all stages of life is looking for a job that is wrapped up with a high degree of motivation. At some times and places, all people want is a steady paycheck. Thus, Oldham and Hackman added two sets of distinctions between people:
So we incorporated two individual differences into our model—growth need strength (i.e., the degree to which an individual values opportunities for personal growth and development at work) and job-relevant knowledge and skill. Absent the former, a jobholder would not seek or respond to the internal ‘‘kick’’ that comes from succeeding on a challenging task, and without the latter the jobholder would experience more failure than success, never a motivating state of affairs.
There has been a considerable amount of follow-up work on this approach: for an overview, interested readers might begin with the other essays in the same 2010 issue of the Journal of Organizational Behavior that contains the Oldham-Hackman essay. Their overview of this work emphasizes a number of ways in which the typical job has evolved during the last 40 years. They describe the change in this way:
It is true that many specific, well-defined jobs continue to exist in contemporary organizations. But we presently are in the midst of what we believe are fundamental changes in the relationships among people, the work they do, and the organizations for which they do it. Now individuals may telecommute rather than come to the office or plant every morning. They may be responsible for balancing among several different activities and responsibilities, none of which is defined as their main job. They may work in temporary teams whose membership shifts as work requirements change. They may be independent contractors, managing simultaneously temporary or semi-permanent relationships with multiple enterprises. They may serve on a project team whose other members come from different organizations—suppliers, clients or organizational partners. They may be required to market their services within their own organizations, with no single boss, no home organizational unit, and no assurance of long-term employment. Even managers are not immune to the changes. For example, they may be members of a leadership team that is responsible for a large number of organizational activities rather than occupy a well-defined role as the sole leader of any one unit or function.
In their essay, Oldham and Hackman run through a number of ways in which jobs have evolved in ways that they did not expect or undervalued back in the 1970s. For example, they argue that the opportunities for enrichment in front-line jobs is larger than they expected, that they undervalued the
social aspects of jobs, that they didn't anticipate the "job crafting" phenomenon in which jobs are shaped by workers and employers rather than being firmly specified. They point out that although working in teams has become a phenomenon, employers and workers are not always clear on the different kinds of teams that are possible: for example, "surgical teams" led by one person with support; "co-acting teams" in which people act individually, but have little need to interact face-to-face; "face-to-face teams" that meet regularly as a group to combine expertise; "distributed teams" that can draw on a very wide level of expertise when needed, but don't have a lot of interdependence or a need to meet with great regularity; and even "sand dune" teams that are constantly remaking and re-forming themselves with changing memberships and management.

When you start thinking about "good jobs" in these broader terms, the challenge of creating good jobs for a 21st century economy becomes more complex. A good job has what economists have called an element of "gift exchange," which means that a motivated worker stands ready to offer some extra effort and energy beyond the bare minimum, while a motivated employer stands ready to offer their workers at all skill levels some extra pay, training, and support beyond the bare minimum. A good job has a degree of stability and predictability in the present, along with prospects for growth of skills and corresponding pay raises in the future. We want good jobs to be available at all skill levels, so that there is a pathway in the job market for those with little experience or skill to work their way up. But in the current economy, the average time spent at a given job is declining and on-the-job training is in decline.

I certainly don't expect that we will ever reach a future in which jobs will be all about deep internal fulfillment, with a few giggles and some comradeship tossed in. As my wife and I remind each other when one of us has an especially tough day at the office, there's a reason they call it "work," which is closely related to the reason that you get paid for doing it.

But along with a concern for how quickly jobs will return in the aftermath of the pandemic recession, a primary long-term issue in the workforce is how to encourage the economy to develop more good jobs. I don't have a well-designed agenda to offer here. But what's needed goes well beyond our standard public arguments about whether firms should be required to offer certain minimum levels of wages and benefits.