Monday, October 31, 2016

Snapshots of US Competitiveness: From Harvard Business School

Back in 2011, the Harvard Business School launched what it called th US Competitiveness Project. The 2016 report, authored by  Michael E. Porter, Jan W. Rivkin, Mihir A. Desai, and Manjari Ramanis, is called Problems Unsolved and a Nation Divided: The State of U.S. Competitiveness 2016

For the record, the term "competitiveness" can be controversial in a lot of policy discussions, because while being more "competitive" seems like it should be a good thing, the ways in which you are competitive matter. After all, the US would be in some sense more "competitive" in global markets if US wages were lower, but that wouldn't be a desirable policy. The report offers this definition: " A nation is competitive if it creates the conditions where two things occur simultaneously: businesses operating in the nation can (1) compete successfully in domestic and international markets, while (2) maintaining and improving the wages and living standards of the average citizen. When these occur together, a nation prospers. When one occurs without the other, a nation is not truly competitive
and prosperity is not sustainable. If business succeeds but the average worker is losing ground, or when worker incomes rise but businesses can no longer compete, the nation is not competitive. A hallmark of a competitive economy, then, is prosperity that is widely shared."

Some of the discussion in the report is an overview of themes that will be familiar to readers of this blog: how US productivity growth has slowed, labor force participation has fallen, and the like. There are also survey result from HBS alumni about how they see the economy and the policy environment. Here, I'll make no effort to review the report as a whole and I'll ignore the opinions of HBS alumni, but instead will just point to some facts and figures that jumped out at me.

For example, this figure divides up total US jobs into those in industries which compete in international markets (like machinery and IT equipment), and industries which are "local" in the sense that  they face relatively little international competition (like health care and business services). Two facts emerge. One is that the total number of US jobs in internationally competitive sectors has been essentially flat at about 40 million since 1990, while all the growth in US jobs in the last 25 years is due to the "local" industries. The other fact is that the jobs in internationally competitive industries tend to pay a lot higher wages.
The report offers some figures showing the decline in "labor force participation," which refers to the share of the population that is either employer or unemployed--but leaves out those who are detached from the labor force and neither working nor looking for work. Given the different workforce patterns of men and women in recent decades, it's conventional to separate labor force participation rates by gender. This figure shows "cohorts," which refers to the share of "prime-age" US men working at different ages. For example, the top line shows for the cohort of men born from 1933-1942, labor force participation was near 98% at age 30, before declining to 86% by age 54. However, for each cohort of men born since then, the labor force participation rate has dropped. For those born from 1983-1992, for example, about 90% were in the labor force at age 30.

This decline in labor force participation is an international phenomenon, but it is especially pronounced in the US. In this figure, the circles show labor force participation in 1990, while the bars show labor force participation in 2014. The US is shown in red.
Small businesses are also playing a lesser role in the US economy. The share of all US businesses that is less than 5 years old has been dropping over time, going back several decades.

In addition, the share of jobs being generated by small businesses is dropping. The figure shows that the total number of jobs at firms with 1-9 employees, or with 10-99 employees, is about the same now as it was back in the late 1990s. US job growth since the late 1990s is all at larger firms.

One final snapshot is to point out that the household distribution of income has large stagnated for the last 15 years or so. As I've argued in the past (for example, here and here), the big surge of rising inequality was a 1980s and 1990s phenomenon.
Wisely, the report doesn't try to dig very deeply into these patterns of slow economic growth, effects of a globalizing economy, labor force participation, small business, and incomes that are stagnating at a much more unequal level than several decades ago. It just puts the topics on the table for discussion.

Friday, October 28, 2016

Fall 2016 Journal of Economic Perspectives Available Online

For the past 30 years, my actual paid job (as opposed to my blogging hobby) has been Managing Editor of the Journal of Economic Perspectives. The journal is published by the American Economic Association, which back in 2011 decided--much to my delight--that the journal would be freely available on-line, from the current issue back to the first issue in 1987. Here, I'll start with Table of Contents for the just-released Fall 2016 issue. Below that are abstracts and direct links for all of the papers. I will almost certainly blog about some of the individual papers in the next week or two, as well.

______________________

Symposium: Immigration and Labor Markets

"Immigrants, Productivity, and Labor Markets," by Giovanni Peri
Full-Text Access (Complimentary) | Supplementary Materials

Immigration has been a steady force acting on population and employment within countries throughout human history. Focusing on the last four decades, we show that the mix of immigrants to rich countries has been, overall, rather balanced between college and non-college educated. The growth of immigration has been driven by immigrants from nonrich countries. The economic impact of immigration on receiving economies needs to be understood by analyzing the specific skills brought by immigrants. The complementarity and substitutability between immigrants and natives in employment, and the response of receiving economies in terms of specialization and technological choices, are important when considering the general equilibrium effects of immigration. In the United States, a balanced composition of immigrants between college and noncollege educated, together with the adjustment of demand and technology, imply that general equilibrium effects on relative and absolute wages have been small.

"The Impact of Immigration: Why Do Studies Reach Such Different Results?" by Christian Dustmann, Uta Schönberg and Jan Stuhler
Full-Text Access (Complimentary) | Supplementary Materials

We classify the empirical literature on the wage impact of immigration into three groups, where studies in the first two groups estimate different relative effects, and studies in the third group estimate the total effect of immigration on wages. We interpret the estimates obtained from the different approaches through the lens of the canonical model to demonstrate that they are not comparable. We then relax two key assumptions in this literature, allowing for inelastic and heterogeneous labor supply elasticities of natives and the "downgrading" of immigrants. "Downgrading" occurs when the position of immigrants in the labor market is systematically lower than the position of natives with the same observed education and experience levels. Downgrading means that immigrants receive lower returns to the same measured skills than natives when these skills are acquired in their country of origin. We show that heterogeneous labor supply elasticities, if ignored, may complicate the interpretation of wage estimates, and particularly the interpretation of relative wage effects. Moreover, downgrading may lead to biased estimates in those approaches that estimate relative effects of immigration, but not in approaches that estimate total effects. We conclude that empirical models that estimate total effects not only answer important policy questions, but are also more robust to alternative assumptions than models that estimate relative effects.

"Is the Mediterranean the New Rio Grande? US and EU Immigration Pressures in the Long Run," by Gordon Hanson and Craig McIntosh
Full-Text Access (Complimentary) | Supplementary Materials

How will worldwide changes in population affect pressures for international migration in the future? We examine the past three decades, during which population pressures contributed to substantial labor flows from neighboring countries into the United States and Europe, and contrast them with the coming three decades, which will see sharp reductions in labor-supply growth in Latin America but not in Africa or much of the Middle East. Using a gravity-style empirical model, we examine the contribution of changes in relative labor-supply to bilateral migration in the 2000s and then apply this model to project future bilateral flows based on long-run UN forecasts of working-age populations in sending and receiving countries. Because the Americas are entering an era of uniformly low population growth, labor flows across the Rio Grande are projected to slow markedly. Europe, in contrast, will face substantial demographically driven migration pressures from across the Mediterranean for decades to come. Although these projected inflows would triple the first-generation immigrant stocks of larger European countries between 2010 and 2040, they would still absorb only a small fraction of the 800-million-person increase in the working-age population of Sub-Saharan Africa that is projected to occur over this period.

"Global Talent Flows," by Sari Pekkala Kerr, William Kerr, Çağlar Özden and Christopher Parsons
Full-Text Access (Complimentary) | Supplementary Materials

Highly skilled workers play a central and starring role in today's knowledge economy. Talented individuals make exceptional direct contributions--including breakthrough innovations and scientific discoveries--and coordinate and guide the actions of many others, propelling the knowledge frontier and spurring economic growth. In this process, the mobility of skilled workers becomes critical to enhancing productivity. Substantial attention has been paid to understanding the worldwide distribution of talent and how global migration flows further tilt the deck. Using newly available data, we first review the landscape of global talent mobility. We next consider the determinants of global talent flows at the individual and firm levels and sketch some important implications. Third, we review the national gatekeepers for skilled migration and broad differences in approaches used to select migrants for admission. Looking forward, the capacity of people, firms, and countries to success fully navigate this tangled web of global talent will be critical to their success.

Symposium: What is Happening in Game Theory?

"Game Theory in Economics and Beyond," by Larry Samuelson
Full-Text Access (Complimentary) | Supplementary Materials

Within economics, game theory occupied a rather isolated niche in the 1960s and 1970s. It was pursued by people who were known specifically as game theorists and who did almost nothing but game theory, while other economists had little idea what game theory was. Game theory is now a standard tool in economics. Contributions to game theory are made by economists across the spectrum of fields and interests, and economists regularly combine work in game theory with work in other areas. Students learn the basic techniques of game theory in the first-year graduate theory core. Excitement over game theory in economics has given way to an easy familiarity. This essay first examines this transition, arguing that the initial excitement surrounding game theory has dissipated not because game theory has retreated from its initial bridgehead, but because it has extended its reach throughout economics. Next, it discusses some key challenges for game theory, including the continuing proble m of dealing with multiple equilibria, the need to make game theory useful in applications, and the need to better integrate noncooperative and cooperative game theory. Finally it considers the current status and future prospects of game theory.

"New Directions for Modelling Strategic Behavior: Game-Theoretic Models of Communication, Coordination, and Cooperation in Economic Relationships," by Vincent P. Crawford
Full-Text Access (Complimentary) | Supplementary Materials


In this paper, I discuss the state of progress in applications of game theory in economics and try to identify possible future developments that are likely to yield further progress. To keep the topic manageable, I focus on a canonical economic problem that is inherently game-theoretic, that of fostering efficient coordination and cooperation in relationships, with particular attention to the role of communication. I begin with an overview of noncooperative game theory's principal model of behavior, Nash equilibrium. I next discuss the alternative "thinking" and "learning" rationales for how real-world actors might reach equilibrium decisions. I then review how Nash equilibrium has been used to model coordination, communication, and cooperation in relationships, and discuss possible developments

"Whither Game Theory? Towards a Theory of Learning in Games," by Drew Fudenberg and David K. Levine
Full-Text Access (Complimentary) | Supplementary Materials

Game theory has been a huge success in economics. Many important questions have been answered, and game theoretic methods are now central to much economic investigation. We suggest areas where further advances are important, and argue that models of learning are a promising route for improving and widening game theory's predictive power while preserving the successes of game theory where it already works well. We emphasize in particular the need for better understanding of the speed with which learning takes place.

Articles

"The View from Above: Applications of Satellite Data in Economics," by Dave Donaldson and Adam Storeygard
Full-Text Access (Complimentary) | Supplementary Materials

The past decade or so has seen a dramatic change in the way that economists can learn by watching our planet from above. A revolution has taken place in remote sensing and allied fields such as computer science, engineering, and geography. Petabytes of satellite imagery have become publicly accessible at increasing resolution, many algorithms for extracting meaningful social science information from these images are now routine, and modern cloud-based processing power allows these algorithms to be run at global scale. This paper seeks to introduce economists to the science of remotely sensed data, and to give a flavor of how this new source of data has been used by economists so far and what might be done in the future.

"Village and Larger Economies: The Theory and Measurement of the Townsend Thai Project," by Robert M. Townsend
Full-Text Access (Complimentary) | Supplementary Materials

I have spent close to 20 years cataloging transactions between households in Thai villages, along with a research team. Just this past summer, we documented a number of ways in which even relatively poor villages have money markets not dissimilar in some ways from New York financial markets, with borrowing and repayment passing along links in credit chains. In another project, we have been looking at month-by-month school attendance, grade level completion, and graduation for children in these villages, following them from birth to graduation. The Townsend Thai project is a theory-based data collection endeavor, measuring and mapping village and larger economies into general equilibrium frameworks. This paper reviews a number of findings, implications, applications, and lessons learned, and considers next steps.

"Diversity in the Economics Profession: A New Attack on an Old Problem," by Amanda Bayer and Cecilia Elena Rouse
Full-Text Access (Complimentary) | Supplementary Materials


The economics profession includes disproportionately few women and members of historically underrepresented racial and ethnic minority groups, relative both to the overall population and to other academic disciplines. This underrepresentation within the field of economics is present at the undergraduate level, continues into the ranks of the academy, and is barely improving over time. It likely hampers the discipline, constraining the range of issues addressed and limiting our collective ability to understand familiar issues from new and innovative perspectives. In this paper, we first present data on the numbers of women and underrepresented minority groups in the profession. We then offer an overview of current research on the reasons for the underrepresentation, highlighting evidence that may be less familiar to economists. We argue that implicit attitudes and institutional practices may be contributing to the underrepresentation of women and minorities at all stages of th e pipeline, calling for new types of research and initiatives to attack the problem. We then review evidence on how diversity affects productivity and propose remedial interventions as well as findings on effectiveness. We identify several promising practices, programs, and areas for future research.

Features

"Recommendations for Further Reading," by Timothy Taylor
Full-Text Access (Complimentary) | Supplementary Materials


The Coleman Report on Equal Educational Opportunity: 50 Years Later

In some ways, the "Coleman report" launched the study of how to reform the US K-12 education system that has been going on ever since. The Civil Rights Act of 1964, among its lesser-noticed provisions, required a report "concerning the lack of availability of equal educational opportunity for individuals by reason of race, color, religion, or national origin in public institutions at all levels in the United States, its territories and possessions, and the District of Columbia." James Coleman, a quantitative sociologist at Johns Hopkins University, was signed up to lead the research and writing effort. The Equality of Educational Opportunity report was published in June 1966. The Russell Sage Foundation Journal of the Social Sciences has devoted its September issue to a 13-paper symposium that looks at how the insights of the report have held up, and what the agenda for equal opportunity in education should be moving forward.

The common working assumption at the time was that "equal opportunity in education" referred to educational inputs, like spending on teachers, class size, and other resources. Karl Alexander and Stephen L. Morgan in their introduction, "The Coleman Report at Fifty: Its Legacy and Implications for Future Research on Equality of Opportunity," how the Coleman report challenged these prevailing assumptions. They write: 
"The thinking at the time was that school quality inhered in a school’s facilities and resources, such as modern science laboratories, a well-stocked school library, and highly qualified teachers, all of which were regarded as “school inputs,” in the language of the report. It was expected that the segregated schools attended by black children would be found to be badly lacking in the inputs thought to be educationally important. From that vantage point, gauging “equality of opportunity” would be revealed in comparisons of school resources, black against white. For that part of the agenda, no fancy statistics were needed.
"EEO [Equality of Educational Opportunity] presented evidence on this point, but evidence that many found hard to believe. The report concluded that school resource disparities revolving around race distinctively were not large. There were differences, to be sure—the South lagged behind the rest of the country, and rural areas behind urban—but differences by race within the same geographic space generally were small, too small to account for what today we call the black-white achievement gap.
"This is one of several conclusions that made the EEO report controversial, and for many a disappointment. Other significant conclusions trace to the expansive view of equal educational opportunity that was introduced by the research team. Their reformulation shifted attention from disparities in schooling “inputs” as problematic in themselves to disparities in inputs that had bearing on educational “outcomes”—notably achievement test scores—and to achievement differences across social lines as markers of unequal opportunity. These radical reframings of the issue are undoubtedly among the report’s most profound and lasting contributions.
"Pursuing this line of inquiry, the report compared test scores across racial and ethnic lines, across dimensions of family background (for example, parents’ educational level), by grade level, and across different regions and community contexts (urban or rural). In a more analytical vein, it examined variations in test scores and test score gaps in relation to school resources, focusing on average resource differences across schools. The school resources examined included teacher qualifications, curricular coverage, and facilities and expenditures, along with compositional characteristics of the student body (such as the percentage of minority enrollment and the percentage of families of low socioeconomic background).
"These aspects of the report’s work were truly groundbreaking, and very likely not at all by congressional intent. Here, too, EEO’s main conclusions were both surprising and, for many, disappointing. These conclusions are addressed in detail in several of the papers in this issue. In thumbnail, EEO concluded that
  1. differences across schools in average achievement levels were small compared to differences in achievement levels within schools;
  2. the differences in achievement levels detected did not align appreciably with differences in school resources other than the socioeconomic makeup of the student body; and
  3. family background factors afforded a much more powerful accounting of achievement differences than did any and all characteristics of the schools that children attended.
"The report’s focus on academic achievement (test scores) to assess equality of educational opportunity was revolutionary. Reliance on achievement tests for monitoring and accountability is now routine, and many volumes have been written on how to do such assessments well. But that was not the case a half-century ago.

"The report also was transformative in directing attention to the broader social context of children’s academic development. If school resources were the sole engine, then evaluating the performance of schools in isolation would be fine. But Coleman’s research team understood that resources provided by families and neighborhoods contributed to children’s initial school readiness, their achievement levels, and their learning trajectories. That, too, is taken for granted today—there is much interest, for example, in out-of-school time learning (OTL) opportunities—but at the time education policy was inward-looking: education reform meant school reform. Today it is also routine to pose questions about the social factors in children’s learning and the determinants of the achievement gap across social lines by asking: is it family or it is school? In the 1960s, when the report posed that question, it was not routine.

"The report also established that racial segregation remained the norm throughout the United States, a finding that proponents of school desegregation embraced and used to advance their agenda. The same cannot be said of its conclusions regarding the near-irrelevance of school resources for advancing the cause of educational equity and the imbalance of family and school in children’s learning."
I can't hope to summarize the symposium in a few words, so here, I'll just offer a comment from the paper by Stephen Morgan and Sol Bee Jung called "Still No Effect of Resources, Even in the New Gilded Age?" Morgan is currently a sociologist at Johns Hopkins, as Coleman was 50 years ago, and Jung is a graduate student in the department. They write:

This paper investigates the effects of family background, expenditures, and the conditions of school facilities for the public high school class of 2004, first sampled in 2002 for the Education Longitudinal Study and then followed up in 2004, 2006, and 2012. The results demonstrate that expenditures and related school inputs have very weak associations not only with test scores in the sophomore and senior years of high school but also with high school graduation and subsequent college entry. Only for postsecondary educational attainment do we find any meaningful predictive power for expenditures, and here half of the association can be adjusted away by school-level differences in average family background. Altogether, expenditures and facilities have much smaller associations with secondary and postsecondary outcomes than many scholars and policy advocates assume. The overall conclusion of the Coleman Report—that family background is far and away the most important determinant of educational achievement and attainment—is as convincing today as it was fifty years ago.
For those who would like to surf the issue, here's a table of contents:


The Coleman Report and Educational Inequality Fifty Years Later
2(5), pp. i–iii

The Coleman Report at Fifty: Its Legacy and Implications for Future Research on Equality of Opportunity
Karl Alexander and Stephen L. Morgan
2(5), pp. 1–16

I. The Legacy of EEO and Current Patterns of Educational Inequality
Is It Family or School? Getting the Question Right
Karl Alexander
2(5), pp. 18–33

School Segregation and Racial Academic Achievement Gaps
Sean F. Reardon
2(5), pp. 34–57

Racial and Ethnic Gaps in Postsecondary Aspirations and Enrollment
Barbara Schneider, Guan Saw
2(5), pp. 58–82

Still No Effect of Resources, Even in the New Gilded Age?
Stephen L. Morgan, Sol Bee Jung
2(5), pp. 83–116

First- and Second-Order Methodological Developments from the Coleman Report
Samuel R. Lucas
2(5), pp. 117–140

II. Looking to the Future

Educational Equality Is a Multifaceted Issue: Why We Must Understand the School’s Sociocultural Context for Student Achievement
Prudence L. Carter
2(5), pp. 142–163

What If Coleman Had Known About Stereotype Threat? How Social-Psychological Theory Can Help Mitigate Educational Inequality
Geoffrey D. Borman, Jaymes Pyne
2(5), pp. 164–185


A New Framework for Understanding Parental Involvement: Setting the Stage for Academic Success
Angel L. Harris, Keith Robinson
2(5), pp. 186–201

Necessary but Not Sufficient: The Role of Policy for Advancing Programs of School, Family, and Community Partnerships
Joyce L. Epstein, Steven B. Sheldon
2(5), pp. 202–219

Accountability, Inequality, and Achievement: The Effects of the No Child Left Behind Act on Multiple Measures of Student Learning
Jennifer L. Jennings, Douglas Lee Lauen
2(5), pp. 220–241

Can Technology Help Promote Equality of Educational Opportunities?
Brian Jacob, Dan Berger, Cassandra Hart, Susanna Loeb
2(5), pp. 242–271

Connecting Research and Policy to Reduce Inequality
Ruth N. López Turley
2(5), pp. 272–285


Thursday, October 27, 2016

Is Foreign Direct Investment Mostly Portfolio Flows in Disguise?

What if the very commonly used distinction between foreign direct investment and portfolio investment is basically not supported by existing data? Olivier Blanchard and Julien Acalin raise this possibility in "What Does Measured FDI Actually Measure?" written for the Peterson Institute of International Economics (October 2016, Policy Brief 16-17).  

Here's why the question matters: At an intuitive level, portfolio investment is supposed to be about financial flows, while foreign direct investment is about investments that involve a degree of ownership and responsibility. Thus, when thinking about the possible dangers of international capital flows, it's common to focus on the risks of portfolio investment zooming in and out of a country, and how this can lead to stock market boom and bust, sharp fluctuations in exchange rates, and even banking and financial crises. In contrast, the usual assumption is that foreign direct investment is much less mobile, and that it involves tighter connections across markets and global supply chains, along with transfers of technology and expertise. Thus, discussions of the potential dangers of international capital flows often focus on whether it's possible to put some restraints on portfolio flows, while not hindering foreign domestic investment.

Blanchard and Acalin look at the actual data on foreign direct investment, and find that it's often behaving more like portfolio investment, with some pattern that suggest it is driven by a desire to shift resources across borders in a way that reduces corporate taxes. They write (footnotes omitted):

"Conventional wisdom on capital flows holds that FDI inflows are “good flows,” while assessments of portfolio and other flows are more ambiguous. When considering restrictions on capital flows, the first reaction of researchers and policymakers is to want to exclude FDI inflows.
"In looking, however, at measured FDI flows to emerging markets (in the course of a larger project on capital flows), we have found three facts that suggest that measured FDI is actually quite different from the depiction of FDI above. The first is a surprisingly high correlation between quarterly FDI inflows and outflows. A reasonable prior would be that this correlation should be close to zero or even negative: If a country is for some reason more attractive to foreign investors, it is not obvious why domestic investors would want to invest more abroad, especially within the same quarter. The second is an increase in quarterly FDI inflows to emerging-market countries in response to decreases in the US monetary policy rate. Again, a reasonable prior would be that FDI flows do not respond much, if at all, to changes in the policy rate within a quarter—i.e., the effect should be close to zero.  ... The third fact, closely related to the first two, is an increase in quarterly FDI outflows from emerging-market countries in response to decreases in the US monetary policy rate. Again, a reasonable prior would be that FDI outflows do not respond much, and, if they did, they would decrease in response to a decrease in the US policy rate. This is not the case.
"These facts suggest two conclusions. The first is that, in many countries, a large proportion of measured FDI inflows are just flows going in and out of the country on their way to their final destination, with the stop due in part to favorable corporate tax conditions. This fact is not new, and, as discussed below, countries have tried to improve their measures of FDI to reflect it. But the magnitude of such flows came to us as a surprise.
"The second is that some of these measured FDI flows are much closer to portfolio debt flows, responding to short-run movements in US monetary policy conditions rather than to medium-run fundamentals of the country. ...
"FDI inflows and outflows are highly correlated, even at high frequency and using different methodologies. FDI flows to emerging-market economies appear to respond to the US policy rate, even at high frequency. This suggests that “measured” FDI gross flows are quite different from true FDI flows and may reflect flows through rather than to the country, with stops due in part to (legal) tax optimization. This must be a warning to both researchers and policymakers."
For more inforrmation on these issues, one common  source for foreign direct investment is an annual report from UNCTAD, and I discuss one of their recent reports in "Snapshots of Foreign Direct Investment Flows" (September 8, 2015). The most common source for portfolio investment is an annual report from the IMF, and I discuss one of their reports from a few years back in "International Portfolio Investment in 2012" (December 9, 2013).

Wednesday, October 26, 2016

Some Snapshots of Incarceration and Prisoner Reentry

The arguments over incarceration and crime are well-known: in the last few decades, US crime rates have generally fallen, while incarceration rates have risen. Diane Whitmore Schanzenbach, Ryan Nunn, Lauren Bauer, Audrey Breitwieser, Megan Mumford, and Greg Nantz offer some perspectives on the situation in their short discussion paper, "Twelve Facts about Incarceration and Prisoner Reentry," written for the Hamilton Project at the Brookings Institution (October 2016). Here are a couple of figures that jumped out at me.

States vary considerably in their rates of crime and their rates of incarceration--and not always in predictable ways. The horizontal axis shows the rate of violent crime in each state, while the vertical axis shows the incarceration rate. There are some states with low crime and low incarceration, like Vermont and Maine. There are other states with high rates of crime and high incarceration, like Louisiana. But there are also a number of other cases. For example, Mississippi and Kentucky have lower-than-average rates of violent crime, but higher-than-average incarceration rates. Wyoming, Idaho, and Virginia have lower-than-average crime, but roughly average incarceration. Maryland and California have higher-than-average violent crime, but lower-than-average incarceration rates.


One can come up with various stories for why a state with a high, average, or low crime rate might have high, average, or low incarceration rates. But the variations are considerable, and when you end up telling a few dozen different stories to explain these kinds of patterns, it seems unlikely that all the stories are actually true.

Another figure makes the point that many of those in prison will be re-arrested after leaving prison; of all state prisoners released in 2006, 43$ were re-arrested within year.


By itself, this fact can be used to argue that sentences should be longer (to incapacitate those likely to commit future crimes) or that rehabilitation efforts should be increased (to reduce the chance of committing future crimes). One might also try to focus on those who have been arrested relatively few times in the past. About 40% of this group is not rearrested in the five years after leaving prison. Is it possible to learn some lessons from those who manage to get clear of the criminal justice system?

The difficult social science question is, as so often occurs, figuring out to what extent one of these caused the other. This discussion paper is about providing background and spurring discussion, while not seeking to address the causation-vs.-correlation issues in a direct way.

My own sense of the research is that one can make a good case that the early years of the rise in incarceration in the 1980s and into the 1990s did help bring down crime rates, but that at some point in the late 1990s and into the 2000s, the high incarceration rates started running into diminishing returns. At present, the US could reduce its crime rates if it reallocated some spending away from incarceration and toward more police officers. For discussion, see "Crime and Incarceration: Correlation, Causation, and Policy" (April 29, 2016) or "Inequalities of Crime Victimization and Criminal Justice" (May 20, 2016).

Tuesday, October 25, 2016

Photos of Fisher's Physical Macroeconomic Model

Two extremely prominent economists of the past started off their careers by building physical hydraulic models of the macroeconomy--that is, models that shows consumption, saving, investment, and the rest with water flowing through tubes between different containers until it balances at an equilbrium. 

I wrote a few years ago about "Hydraulic Models of the Economy: Phillips, Fisher, Financial Plumbing" (November 12, 2012). There you can find a more detailed discussion of the MONIAC, the Monetary National Income Analogue Computer, created by Alban William Housego (Bill) Phillips (1914-1975), the author of the famous 1956 paper that drew the "Phillips curve" tradeoff between unemployment and inflation, as well as the earlier machine built by Irving Fisher (1867-1947) as part of what Paul Samuelson called the “greatest doctoral dissertation in economics ever written” -- although the compliment was more because Fisher discovered general equilibrium analysis than for his machine. 

Fisher seems to have been influenced in building his hydraulic model of the economy by one of his 
thesis advisers, Josiah Willard Gibbs, a mathematical physicist and engineer who Albert Einstein once called "the greatest mind in American history." Fisher apparently used this hydraulic model as a teaching tool for 25 years, to give students an intuitive sense of how the economy adjusted when various parameters were changed. 

When I wrote about these models a few years back, I found some photographs and existing versions of the Phillips MONIAC, but only schematic drawings of Fisher's machine. But Calla Wiemer recently pointed out to me that there are a couple of historical photos of Fisher's machine at the start of the 1965 volume that republished both Fisher's 1892 dissertation, Mathematical investigations in the theory of value and price and his 1896 book, Appreciation and interest. For geeks-at-heart, here is a picture of the model as constructed in 1893--that is, a nice neat physical machine soon after the dissertation was written. 

And here's a photo of Fisher's model as constructed in 1925. This one looks more like it's been used for classroom for a decade or two.


I pointed out in my 2012 post that there are some currently working versions of Phillips's MONIAC, but I don't know of any currently working versions of Fisher's earlier hydraulic macroeconomic model.


Monday, October 24, 2016

What Else Can Central Banks Do?

Central banks all over the world took dramatic actions during the Great Recession and its aftermath. For example, the US Federal Reserve took the "federal funds" interest rate down to near-zero in December 2008 and left it there until the small upward bump in December 2015, and also through its "quantitative easing" program has bought about $4 trillion in US Treasury debt and mortgage-backed securities. Other central banks have also dropped their policy target interest rates to near-zero and carried out quantitative easing. As a results, have central banks used up most of their ammunition, potentially leaving them with an inability to act if and when the next recession arrives? Laurence Ball, Joseph Gagnon, Patrick Honohan and Signe Krogstrup make the case that central banks continue to have considerabke power to engage in a loose monetary policy, should they wish to do so, in their monograph What Else Can Central Banks Do?, published as #18 in the Geneva Reports on the World Economy series.

The authors discuss an array of possibilities for central banks (forward guidance, helicopter money, higher inflation targets, and others), but the main focus is on two policies: additional quantitative easing and negative interest rates.  Here are a few of their comments that caught my eye:

On the topic of quantitative easing, Ball, Gagnon, Honohan and Krogstrup give this overall perspective:
"In the United States, for example, it is estimated that QE purchases of long-term bonds between 2008 and 2015 had macroeconomic effects equivalent to those of a sustained reduction of about 200 to 250 basis points in the policy rate. With a greater volume of purchases, the effects could have been almost proportionately greater. Another approach adopted by some central banks is subsidised and targeted lending to the banking system. QE could be expanded further by widening the range of assets that central banks purchase to include risky assets such as corporate debt and equities. For given quantities of asset purchases, this broader version of QE could well have stronger effects on asset prices and costs of funds, and hence on economic activity, than purchases of government bonds." 
Here are a couple of piece of evidence from their discussion. They offer a summary of research evidence that QE does reduce interest rates on long-term bonds. They write: "Table 3.1, taken from Gagnon (2016), displays estimates of the effect of a purchase of long-term bonds equivalent to 10% of GDP on a country’s 10-year government bond yield."

The other piece of evidence, just to give a sense of where their thoughts are tending, is a table that compares central bank assets to the total securities in an economy. In the US, for example, the assets at the Fed are about 25% of GDP, while all financial securities are 300% of GDP. The authors draw the inference that quantitative easing can be expanded quite substantially. They also point out that such policies might involve targeted lending of various kinds, not just purchases of existing securities.

On the topic of negative interest rates, the authors point out that negative real interest rates are not actually an innovation, in the sense that there have been lots of times in the past in lots of countries when the rate of inflation exceeded the nominal interest rate, so that the real interest rate was negative. The change is making the negative interest rates explicit. Here's a figure showing some monetary policy interest rates in five countries:

As the authors discuss, the graph oversimplifies how these policies are conducted. In a number of cases, the negative rates are "tiered," meaning that they apply to some types of deposits rather than others. In some countries, banks are now charging negative interest rates to some corporate and institutional investors.The evidence on whether these negative policy rates cause banks to reduce the interest rates at which they lend seems mixed: sometimes those interest rates drop, but at other times, it has looked as if banks are trying to make up for the money they are losing from negative interest rates on their deposits at the central bank by keeping their lending rates up. So far, the negative rates mostly haven't been passed along to retail bank depositors. As the authors explain:
"However, there is little evidence so far that banks are passing negative interest rates through to their retail depositors. Insured retail deposits are an attractive source of financing for a bank in normal times, and a retail customer can often be cross-sold many other value-added banking products. Banks are reluctant to lose market share for insured deposits, which they may not easily regain when interest rates turn positive. Moving to a negative interest rate could be a salient event that would cause retail customers to ‘shop around’. Given the inertia normally characterising retail bank relationships, the bank that makes the first move into negative deposit rates for retail customers could experience a hard-to-reverse loss of market share.
My own reading of the evidence is that the case for how quantitative easing reduced interest rates is fairly strong, but the evidence for the merits of negative interest rates is at this point less strong. For example, there are a variety of concerns that at a time when a main concern has been to require banks to hold more capital against losses, having the central bank charge negative interest rates may work in the opposite direction. For small open economies like Switzerland or Denmark, negative policy interest rates or negative rates on certain government debt can be a way of keeping their exchange rate low, which for their economies can be quite important. But what works for the Bank of Switzerland or Denmark's central bank doesn't necessarily extrapolate to the much larger Fed or the European Central Bank. After all, not all currencies can be reduced in value relative to each other at the same time. The authors also point out that the public is likely to be quite averse to explicitly negative nominal interest rates. They write:
"Perhaps the strongest de facto impediment to cutting rates further into negative territory is the lack of public acceptance and understanding of such measures. Partly due to pervasive money illusion, negative interest rates seem counterintuitive to the general public and are perceived in many countries as an unfair tax on savings. Taking measures to allow negative retail deposit rates could sharply increase public animosity. A lack of acceptance and understanding of a monetary policy measure can negatively affect confidence in the central bank’s ability to pursue its mandate, and might adversely affect transmission to demand. This constitutes an important communication challenge for central banks as they try to explain why the tool is needed, how it works, and how negative nominal rates will affect real life-time saving and real incomes of regular citizens, once growth and inflation developments are taken into account." 
I'm happy not to be the central bank person working on the public relations campaign for why negative interest rates are a good idea! I worry that these authors are a little too too sanguine about how negative interest rates will not cause other economic problems, but they make their case strongly and clearly, in a way that's worth reading.

When thinking about the much more aggressive use of these kinds of monetary policy tools, I find myself of several minds. In particular, are we talking about what monetary policy should have been enacted back in 2009 and 2010? Or maybe what the European Central Bank should be doing now, given that it unemployment rates in the euro-zone have been above 10% for essentially the entire period since late 2009? Or are we talking about what the US Federal Reserve should be doing today with an unemployment rate that has now been at about 5% or less during the last calendar year?

In looking backward at 2008-2010, researchers can make a technical case that a more aggressive monetary response might have been helpful. But in thinking back to the extreme uncertainty of that time, it isn't obvious to me that if, say, the Federal Reserve had cut the federal funds interest rate to a negative 2 percent (as proposed in one of the authors' scenarios) or had announced that it was going to buy a few trillion dollars worth of US stocks that it would have calmed or quieted the financial markets. In the context of that time, such actions could well have been perceived as desperate gambles, and might even have made a dire situation worse.

But in looking forward, the question of alternative ways of conducting expansionary monetary policy issues raised by this essay are likely to be long-lasting. In the middle term, it seems likely that  real interest rates and rates of inflation are likely to remain low. But in the past, when a central bank has wanted to fight recession, it has often cut its target interest rate by 3-4 percentage points or even more. The problem is that if nominal interest rates are already low, it becomes impossible for central banks to cut interest rates by 3-4 percentage points in the next recession unless the rates become negative. Another alternative is more extensive quantitative easing. There are new and difficult policy questions with negative interest rates and quantitative easing, but these kinds of monetary policy tools in this report are what central banks are going to be discussing when (and it's "when", not "if") the next recession comes.

Friday, October 21, 2016

Will the US Become a Nation of Renters?

The United States has long been a nation of homeowners, but in the aftermath of the housing bubble and the Great Recession, the rate of homeownership has been falling. Are we headed toward becoming a nation of renters. Cityscape, which is published three times each year by the US Department of Housing and Urban Development, asked four groups of experts to argue for or against this claim in its first issue of 2016: “By 2050, the U.S. homeownership rate, currently about 64 percent of households, will have fallen by at least 20 percentage points.”

The short answer to the question is that an additional fall of 10 percentage points in rates of US homeownership is plausible, according to some projections, but a fall of 20 percentage points seems quite unlikely. But let's put that answer in context. Here's the homeownership rate in the US since 1980. The housing boom and corresponding fall are clear. But is the recent decline just part of a cycle, or a sign of what is to come in the next few decades? Answering this question means trying to look past the recent housing bubble and to consider what might affect homeownership in the longer term.


For example, Arthur C. Nelson writes "On the Plausibility of a 53-Percent Homeownership Rate by 2050." He points out that the homeownership rate for white non-Hispanic was 72.5% in 2015, while the homeownership rate for everyone else, who Nelson calls the "New Majority" because this group is expanding as a share of the US population, is 47.1%. Details of his projections are in the paper, but here's the upshot : "I estimate that, by 2050, America’s homeownership rate may be 53.5 percent or roughly what Germany’s rate was in 2015." Nelson also points out that the US homeownership rate was at about 53% back in the 1950s, so such a rate is clearly not unprecedented in US experience.


Dowell Myers and Hyojung Lee instead emphasize, in "Cohort Momentum andFuture Homeownership:The Outlook to 2050,"  that homeownership rates evolve over time with the aging of the population. Older households are more likely to own homes. But it then follows that if younger households are over time becoming less likely to be owners than their predecessors in the same age groups, then as time moves forward the rate of homeownership will fall. They write:

Homeownership for ages 35 to 39 topped out at 69 percent in the 1980 census. From that point forward, homeownership attainment began to very slowly recede, likely under the pressure of growing affordability problems and also the effects of declining marriage and increasing diversity, both of which added people from groups with historically lower homeownership. The decline accelerated dramatically, however, following the financial crisis. Between 2008 and 2015, the homeownership rate of this age group fell from 64.6 to 55.1 percent (-9.5 points). Meanwhile, for those ages 70 to 74, the rate declined only slightly in the same time period, from 81.7 to 80.7 percent (-1.0 point). The low rates among today’s young adults, unless they were to accelerate well beyond the normal pace of increase in future years, have potential to depress the U.S. homeownership rate as these cohorts begin to replace their elders later in the century.
Their mid-range projection, based on this cohort analysis, is for a US homeownership rate below 55% by 2050. But in their pessimistic projection, in which the last few years mark a permanent change in the willingness or ability of younger cohorts to purchase homes, the homeownership rate could fall below 45% by 2050.

The other papers are not as pessimistic about a fall in homeownership. In "A Renter or Homeowner Nation?", Arthur Acolin, Laurie S. Goodman, and Susan M. Wachter offer a projection based on evolution of age and race/ethnicity, and offer a mid-range projection of the homeownership rate falling to 57% by 2050.  In "The Future Course of U.S. Homeownership Rates,"  Donald R. Haurin offers a similar estimate, along with some other insights. He writes:
Why has the homeownership rate recently declined and will it continue to fall? Consider six causal factors. (1) The underlying preference for homeownership or privacy could have decreased—but no evidence supports this hypothesis. (2) The risk premium associated with house price volatility has increased, raising user costs; however, the premium should fall in the future as house prices stabilize. (3) Although mortgage lending practices tightened following the Great Recession, they changed little after 2012. Households take time to adjust to requirements for higher credit quality and larger down payments, but a decade should be sufficient for this adjustment to occur. (4) An increase in households’ expected mobility raises the transaction cost component of user costs, but recent changes indicate mobility has fallen in both the general and the young adult populations. (5) Rents have risen recently, but this rise should increase homeownership rates. (6) Perhaps the most important factor causing the recent decline in agespecific homeownership rates is the hangover of negative credit events, such as foreclosures, short sales, and bankruptcies. The impact on credit scores of these derogatory credit effects, however, is unlikely to last beyond 2020. Consideration of these six factors suggests that age-specific homeownership rates will stabilize no later than 2025, then will rebound, but not to the previous, boom-inspired peaks.
These estimates are all sensible enough in their own ways, but they felt a little unsatisfying to me, because they paid relatively little attention to some other factors that seem likely to shape the future of homeownership. For example, here's some Census Bureau data on differences inside and outside metro areas, and across regions. Notice that homeownship rates tend to be much lower in large cities: indeed, if a homeownership rate below 50% seems implausible to you, you might reflect on the fact that this is already a reality in US cities. Notice also that homeownership rates in the Northeast and West regions are already below 60% (of course, this is in substantial part because there are more large cities in these regions). Thus, one's belief about the future of homeownership is in some ways a statement about where people choose to live in the future.

There are also changes in family structure. For example, US birthrates declined in the 1960s. The share of US family households who have a child living there was about 57% in the early 1960s, but has declined since that time to about 45%. Although fewer households have children, a larger share of young adults are living with their parents. As these young people move toward becoming few-child or no-child families on their own, it's not clear to me that they will be looking to own rather than rent.

Finally, the level of homeownership is in some ways a social choice, related to policies affecting supply of different kinds of homes (like the zoning decisions that affect large detached homes, small detached homes, condos, or rental apartments get built) and demand for homes (like whether the financial and tax system is set up in a way that encourages buying homes. Haurin writes: "Cross-sectionally, the homeownership rate varies substantially among developed countries (2013 data), ranging from 83.5 percent in Norway to 77.7 percent in Spain, 64.6 percent in the United Kingdom, and 53.3 percent in Germany." If the US wants a higher homeownership rate--and doesn't want to go through another housing price bubble (!)--it needs to think about the policies that might move toward that goal.


Thursday, October 20, 2016

Arnold Harberger: Is Growth Yeast or Mushrooms?

Economic growth would be a socially easier process if it was smooth and even across society: that is, if most people could just get steady raises for doing their same jobs a little better each year. When growth benefits some and not others, or even benefits some while imposing losses and costs of transition on others, then controversies arise.

Arnold Harberger offered a nice metaphor thinking about this difference in his Presidential Address to the American Economic Association back in 1998, entitled "A Vision of the Growth Process" and published in the March 1998 issue of the American Economic Review.  Harberger discusses whether economic growth is more likely to be like "mushrooms," in the sense that certain  parts of a growing economy will take off much faster than others, or more like "yeast," in the sense that economy overall expands fairly smoothly overall. He argues that "mushroom"-type growth is more common. Harberger writes:
"The analogy with yeast and mushrooms comes from the fact that yeast causes bread to expand very evenly, like a balloon being filled with air, while mushrooms have the habit of popping up, almost overnight, in a fashion that  is not easy to predict. I believe that a "yeast" process fits best with very broad and general externalities, like externalities linked to the growth of the total stock of knowledge or of  human capital, or brought about by economies of scale tied to the scale of the economy as a whole. A ''mushroom'' process fits more readily with a vision such as ours, of real cost reductions stemming from 1001 different  causes, though I recognize that one can build scenarios in which even 1001 causes could  work rather evenly over the whole economy. Personally, I have always gravitated toward the "mushrooms" side of this dichotomy. I remember being impressed, when I first saw some early industry estimates of TFP [total factor productivity] improvement, by their tendency to industry concentration."
To put this another way, a lot of the policies for encouraging economic growth--like investing in human capital, technology, infrastraucture, and a supportive institutional environment for innovation--seem to suggest the possibility of broadly shared economic gains. But the economic growth that results will often be often mushroom-like and disruptive, affecting certain industries, localities, and kinds of workers more than others.

Paul Romer, who recently accepted the position of Chief Economist at the World Bank, recently  offered on his blog a summary of the social problem that then arises in a pithy aphorism: "Everyone wants progress. Nobody wants change."


Wednesday, October 19, 2016

How Do the French Do it?

From an economic point of view (and doubtless from other points of view, as well), the French present a puzzle. France is often perceived as having a government that practices heavy-handed intervention into the economy, sometimes known as dirigisme, but it is also obviously a high-income economy and has been a high-income economy for decades. So does this mean that France is less heavy-handed in economic interventionism than its reputation suggests? Or that the French have discovered an especially growth-friendly version of heavy-handed interventionism? How does France manage this balancing act?

Pierre Lemieux tackles this question in his essay "France: The end of the road, again?" in the Fall 2016 issue of Regulation magazine  (pp. 34-41). I was also reminded of an essay by Olivier Blanchard, "The Economic Future of Europe," which often uses France as a specific example an appeared in the Fall 2004 issue of the Journal of Economic Perspectives (where I have labored in the fields as Managing Editor since the first issue in 1987).

Both Lemieux and Blanchard point out that concerns about how the French government has a tendency to overcentralize its power and decision-making go back a long time. Lemieux points out that his was a theme of Tocqueville's back in 1856, in The Ancient Regime and the French Revolution. He also mentioned that in 1970, French sociologist Michel Crozier published The Stalled Society. In 1976, Alain Peyrefitte wrote Le mal français (“the French disease”). Blanchard pointed out that in the year before his 2004 article, two books that made the estseller’s list in France were La France qui tombe (The fall of France), by Nicolas Baverezm and Le desarroi Francais (The French disarray), by Alain Duhamel. Lemieus refers to a book published last year by Gilbert Cette and Jacques Barthélémy published Réformer le droit du travail (Reform the Labor Code).

As a starting point, here's some evidence on the higher degree of regulation in the French economy. Lemieux notes: "Public expenditures amount to 57% of French gross domestic product, the fourth-highest percentage in the OECD, after Greece, Slovenia, and Finland. This compares to 45% for the OECD unweighted average and 39% for the United States." In measures of "economic freedom" for the countries of the world, the US tends to rank around 10th, while France tends to rank around 70th.

However, Lemieux also offers some evidence on the other side: "Not all industries are more regulated in France than in America. The OECD’s Services Trade Restrictiveness index shows France as less regulated than the United States in commercial banking, insurance, broadcasting, and many modes of transport. Even the labor market is less regulated in France with regard to many trades and professions. In the United States, nearly 30% of jobs require a license." Moreover, France (like many other economies) has gradually been moving in the direction of less regulation.

But the area of labor market rules, in particular, is one where France stands out as especially heavy-handed. For example, although only about 8% of French workers are officially union members, 98% of French workers are covered by collective bargaining. Lemieux writes:
"[A]ny firm of more than 49 employees must create a “work council” (comité d’entreprise) chaired by a representative of the owners but composed of trade union representatives and representatives elected directly by the employees. Consultation of the work council is compulsory on many business decisions. Even businesses of 11–49 employees are forced to allow the election of employee representatives. To appreciate the spirit of the 2,880-page labor Code, consider that the French government is currently pushing businesses to negotiate with their workers’ representatives a “right to disconnect,” referring to after-hours work-related electronic communications. The Department of labor, Employment, Occupational Training, and Social Dialogue (why they didn’t add “General Happiness” to the name is a mystery) explains that “the employees of a large firm are not obliged to answer emails outside of office hours.”
As another example, here's a figure about "employment protection" from 2015 OECD Economic Survey of France--basically, how hard it is for a firm to fire or lay off workers. The figure shows the US and Canada off on the far left, with little employment protection, while France is off near the far right.

Lemieux notes: "Because of the cost of firing employees, firms are incited to resort to short-term labor contracts, a loophole that further regulations have tried to limit. In France, a short-term contract may not extend beyond 24 months. The employed work force has thus acquired a dual structure: on one side, the “insiders”—regular workers protected against dismissal; on the other side, the “outsiders,” who survive on short-term contracts and hop fromjob to job. Outsiders make up about 15% of the employed, a proportion that climbs over 50% in the 15–24 age category."

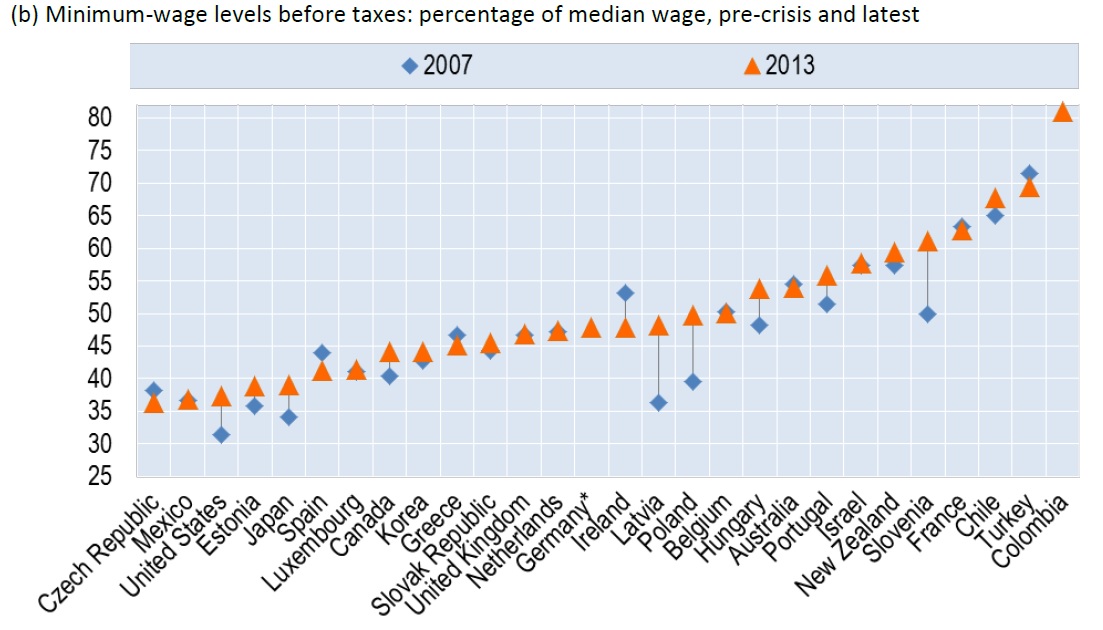
The minimum wage in France is also comparatively high compared to other countries. Here's a figure from a a 2015 OECD report on minimum wages, which shows minimum wages as a percentage of the median wage in the country. Again, the US is off on the left, with a minimum wage about 35% of the US median wage, while France is off near the right, with a minimum wage at about 60% of the median wage.

Here's the unemployment rate in France during the last couple of decades, from the Trading Economics.com website. It seemed for a time in the early 2000s as if France was making some progress on its unemployment rate issues, even if the unemployment rate had only fallen to a still-unsatisfactory 7.5%. But now the unemployment rate is back up around 10% again, and has been there for three years. For comparison, remember that in the aftermath of the Great Recession, the US unemployment rate peaked at 10% in October 2009, before starting a long glide down to the current rate of 5%. Try to imagine the political turmoil in the US if the unemployment rate was higher now, seven years after 2009. That's the situation in France.


France Unemployment Rate

If you focus only on the youth unemployment rate in France, it's been roughly at 24-26%  since 2009. Of course, France's labor market regulations aren't the only cause of unemployment and lower labor force participation in France, the generally torpid European economy bears a large share of the blame. But the many labor market regulations aren't helping, either.

The result of these labor market regulations is that France is running a high-powered modern economy for many of those who have jobs, but with high unemployment or temporary work for many others. Blanchard offered an interesting summary of the situation in his 2004 JEP essay. The table shows that when looking at GDP per capita, France went a little backward compared to the US from 1970 to 2000. However, if one looks at GDP per hour worked during this time, France  caught up to the US level, while if one looks at hours worked per capita, France started at above the US level in 1970 but then declined to 71% of the US level by 2000.

In short, the French are very productive during their working hours. But the French now work many fewer hours per capita, in part because the labor force participation rate (the share of adults either employed or looking for work) is lower in France, in part because of continuing high unemployment rates, and in part because a number of jobs have more vacation per year than is common in the US.

A couple of warnings about those  high rates of productivity in France should be noted. One is that in the US, lower-wage and lower-productivity worker are more likely to have jobs than in France. As a result, France's higher productivity is in part because a substantial share of those who would tend be the lower-productivity workers (like young workers, for example) just aren't working at all.

The other concern is that productivity in France has in fact started to lag, starting in the mid-1990s, especially if one looks at "multifactor" productivity, which doesn't just divide output by hours worked, but also adjusts for other inputs like capital investment. Blanchard had raised this possibility in his 2004 essay, noting that while the evidence at the time of his writing was not yet decisive, "most observers now believe that we have indeed seen a change in relative trends [of productivity growth in the US and continental Europe], starting around 1995." Lemieux cites other evidence and writes:
"Since the mid-1990s, France and many other European countries (but not the UK) have suffered a widening gap with the U.S. standard of living. During that period, the culprit was the slowdown of multifactor productivity growth, especially noticeable in France. According to another paper by Cette and Lopez, the underlying causes were a slower diffusion of the new information technologies, structural rigidities in labor and product markets, and a less educated working population. From 1995 to 2012, French GDP per capita grew at a meager 1% per year."
None of this discussion should be read as a prediction of doom for the French economy, which  seems certain to remain a high-income economy. But it does suggest that French dirigisme is not cost-free: specifically, the costs in the last couple of decades are measured in elevated unemployment, lower labor force participation rates, a larger number of temporary jobs, and sluggish growth in productivity and the standard of living.

Tuesday, October 18, 2016

Global Debt Hits All-Time High

Global debt is at an all-time high: specifically, "nonfinancial debt," which is the combined debt of governments, households, and nonfinancial firms in the 113 countries that make up 94% of world GDP. The IMF discusses the situation in its "Fiscal Monitor" for October 2016, which is subtitled "Debt: Use it Wisely." The report starts (footnotes and citations omitted):
"The global gross debt of the nonfinancial sector has more than doubled in nominal terms since the turn of the century, reaching $152 trillion in 2015. About two-thirds of this debt consists of liabilities of the private sector. Although there is no consensus about how much is too much, current debt levels, at 225 percent of world GDP (Figure 1.1), are at an all-time high. The negative implications of excessive private debt (or what is often termed a “debt overhang”) for growth and financial stability are well documented in the literature, underscoring the need for private sector deleveraging in some countries. The current low-nominal-growth environment, however, is making the adjustment very difficult, setting the stage for a vicious feedback loop in which lower growth hampers deleveraging and the debt overhang exacerbates the slowdown. The dynamics at play resemble that of a debt deflation episode in which falling prices increase the real burden of debt, leading to further deflation."

A few thoughts about this situation:

1) As the figure makes clear, the real debt issue here involves the US and China. The red dashed line, which shows global debt/GDP for the world not counting the US and China, shows only a modest rise over this period, from about 205% of GDP in 2002 to less than 215% of GDP in 2015. As economies grow and develop, one of the standard changes is that a financial sector develops, too. But if one includes the US and China, the global debt/GDP ratio rises from about 200% in 2002 to 225% in 2015, which is a quite substantial bump (remember, we're talking relative to global GDP here!) in 13 years.

2)  Of course, global averages will conceal a number of individual countries which are above-average or below-average in substantial ways. Compared with historical experience, the private sector in the US and other high-income countries has not been deleveraging as quickly as usual since the end of the recession, but for advanced economies the rise in private debt (as a share of GDP) at least leveled off back around 2010 and has even declined a bit.

At present, the bigger worry should be about rising private sector debt in some large emerging market economies. China's debt buildup poses some real concerns: from 2008-2015, its private nonfinancial debt increased by about 70% of China's GDP; in Brazil, the increase over that time is about 30% of GDP; in Russia, 25% of GDP. As the report notes: "In a few systemically  important emerging market economies, private credit has expanded briskly in recent years. The speed  of the increase dangerously resembles that in advanced economies in the run-up to the global financial crisis."

3) The sector that is accumulating debt is shifting. Before the Great Recession, it was primarily households; since then, it's been primarily government. However, this is a shift that has some economic justification. When a society has built up a lot of private sector debt, and then the economy slows dramatically, one of the ways to help a share of that debt get paid off is to get the economy growing again--and public debt can be a way to do that, at least for a time.

4) There's no simple way out of a situation where private debt has gotten excessive, as the world economy learned during the Great Recession and its aftermath. Getting the economy growing again is a huge help, because it means fewer borrowers will end up in default. When cutting a deal to address problems of debt overhand and bad loans, there can sometimes be a role for government loan guarantees when private-sector actors agree to take losses, but the government puts some limit on how large those losses will be.  Restructuring banks and financial institutions so that they are required to address problems of bad loans in the past and hold more capital against the risks of future bad loans is a help. Once a debt overhang situation has occurred, then helping get the bulk of the debt problem into the rear-view mirror  is a legitimate goal of public policy.

Monday, October 17, 2016

How Clones Can Experience Unequal Economic Outcomes

A certain amount of economic inequality is just luck. At the extreme, some people win the lottery, and others don't. But there is also the potential for more subtle kinds of luck, like two equally talented entrepreneurs, where one business happens to take off while the other doesn't. Or two equally talented workers who go to work for similar-looking companies, but one company takes off while the other craters. Richard Freeman discusses the research literature on why this final example might be significant enough to play a role in overall economic inequality in the US in his essay, "A Tale of Two Clones: A New Perspective on Inequality," just published by the Third Way think tank. Freeman sets the stage like this (footnotes omitted):
"[C]onsider two indistinguishable workers, you and your clone. By definition, you/clone have the same gender, ethnicity, years of schooling, family background, skills, etc. In 2006 you/clone graduated with identical academic records from the same university and obtained identical job offers from Facebook and MySpace. Not knowing any more about the future than the analysts who valued Facebook and MySpace roughly equally in the mid-2000s, you/clone flipped coins to decide which offer to accept: heads – Facebook; tails – MySpace. Clone’s coin came up heads. Yours came up tails. Ten years later, Clone is in the catbird’s seat in the job market — high pay, stock options, a secure future. You struggle. Back to university? Send job search letters to close friends? Ask distant acquaintances to help? The you/clone thought experiment may seem extreme, but recent research that I have conducted with colleagues finds that the earnings of workers with near-clone similarity in attributes diverged so much by the place they worked that rising inequality in pay among employers has become the major factor in the trend rise in inequality. ... The labor market has been dominated by economic forces that pull the wages of firms further apart from each other, motivating our analysis of the role of employers in increasing inequality." 
In other words, a lot of inequality is about where you work. The rise in equality is linked to differences across what firms are paying employees who appear to be similarly qualified. As Freeman acknowledges, this argument that this is a quantitatively important cause of rising inequality isn't ironclad at this point, but it's highly suggested in several ways of looking at the data: Freeman  writes:
"This implies that 86% ... of the trend increase in inequality [from 1977-2009] occurs among people with measurably the same skills, whereas just 14% of the trend increase comes from changes in earnings among workers with different skills. The big surprise in the exhibit is that the inequality of average earnings among establishments increased by the same 0.147 points [measuring variance of natural log of earnings, a standard measure of inequality of earnings] as did inequality among workers with the same characteristics. This suggests that all of the increase in inequality among similar workers comes from the increase in earnings at their workplaces." 
Or here is a figure suggesting a linkage from firm earnings to individual inequality of earnings. The blue line shows the change in individual earnings along the income distribution from 1992-2007. As one would expect, given the rise in inequality, those in the bottom percentiles of the income distribution do worse, while those in the top percentiles of the income distribution do better. But now, notice that the blue line for individual earnings almost matches the orange line for firm earnings. That is, there has also been widening inequality in firm earnings, with those at the bottom of the earnings distribution also seeing a decline from 1992-2007 and those at the top seeing an increase. Freeman also offers evidence that those who stayed at firms have seen their earnings change with the fortunes of the firm--thus contributing to overall inequality. As he writes; "In sum, changes in the distribution of earnings among establishments affect the change in earnings along the entire earnings distribution and the increased advantage of top earners compared to other workers."

What makes it possible for successful firms to pay workers more? The answer must be rooted in higher productivity for those firms. Indeed, productivity seems to be diverging across firms, too.

Indeed, as Freeman emphasizes, this figure shows that the equality of revenue per worker--a rough measure of productivity at the firm level--is diverging faster than inequality of wages across firms. Moreover, Freeman argues that a similar pattern of productivity divergence across firms is happening within each sector of the economy.

 Freeman's evidence is consistent with some other studies. For example, last year I pointed to an OECD report on The Future of Productivity, which argued that while cutting-edge frontier firms continue to see strong increases in productivity, the reason for slower overall rates of productivity is that other firms aren't keeping up.

Thinking about inequality between similar workers may alter how one thinks about public policies related to underlying determinants of inequality. For example, it may be important to think about how productivity gains diffuse across industries and how that process may have changed. I suspect there is also some element of geographical separation here, where firms in certain areas are seeing faster productivity and wage increases, and so thinking about mobility of people and firms across geographic areas may be important, too.