Saturday, March 30, 2019

Market Shares for Browsers and Platforms

Teachers of intro economics, as well as industrial organization classes, are often on the lookout for recent examples of market shares that can be used for talking about the extent to which certain markets are concentrated or competitive. The W3 Counter offers a monthly breakdown of market shares for browsers and platforms. For February 2019, here's a figure for internet browser market share:
Here's a figure showing patterns over time, and thus showing the substantial rise of Chrome and the mild rise of Firefox, and the  corresponding falls of Internet Explorer/Edge  and Safari. Depending on whether you are a glass half-full or half-empty person, you will have a tendency to see this either as proof that Google's Chrome has a worrisome level of market dominance, or as proof that even seemingly dominant browser market shares can fall in a fairly short time.


Finally, here's a table with the market share of various platforms in February 2019, but it needs to be read with care, since it lists multiple versions of Windows, Android, and ioS/Mac.


Friday, March 29, 2019

Some US Social Indicators Since 1960

The Office of Management and Budget released President Trump's  proposed budget for fiscal year 2020 a few weeks ago. I confess that when the budget comes out I don't pay much attention to the spending numbers for this year or the five-year projections. Those numbers are often build on sand and political wishfulness, and there's plenty of time to dig into them later, if necessary. Instead, I head for the "Analytical Perspectives" and "Historical Tables" volumes that always accompany the budget. For example, Chapter 5 of the "Analytical Perspectives" is about "Social Indicators": 
The social indicators presented in this chapter illustrate in broad terms how the Nation is faring in selected areas. Indicators are drawn from six domains: economic, demographic and civic, socioeconomic, health, security and safety, and environment and energy. ... These indicators are only a subset of the vast array of available data on conditions in the United States. In choosing indicators for these tables, priority was given to measures that are broadly relevant to Americans and consistently available over an extended period. Such indicators provide a current snapshot while also making it easier to draw comparisons and establish 
This section includes a long table stretching over parts of three pages shows many statistics for ten-year intervals since 1960, and also the last few years. For me, tables like this offer a grounding in basic facts and patterns. Here, I'll offer some comparisons drawn from the table over the last half-century or so, from 1960 or 1970 up to the most recent data.

Economic
  • Real GDP per person has more than tripled since 1960, rising from $18,036 in 1960 to $55,373 in 2017 (as measured in constant 2012 dollars).
  • Inflation has reduced the buying power of the dollar over time such that $1 in 2016 had about the same buying power as 12.3 cents back in 1960, according to the Consumer Price Index.
  • The employment/population ratio rose from 56.1% in 1960 to 64.4% by 2000, then dropped to 58.5% in 2012, before rebounding a bit to 62.9% in 2018.
  • The share of the population receiving Social Security disabled worker benefits was 0.9% in 1960 and 5.5% in 2018. 
  • The net national savings rate was 10.9% of GDP in 1960, 7.1% in 1980, and 6.0% in 2000. It actually was slightly negative at -0.5 in 2010, but was back to 2.9% in 2017.
  • Research and development spending has barely budged over time: it was 2.52% of GDP in 1960 and 2.78% of GDP in 2017, and hasn't varied much in between.
Demographic
  • The foreign-born population of the US was 9.6 million out of a total of 204 million in 1970, and was 44.5 million out of at total of 325.7 million in 2017.
  • In 1960, 78% of the over-15 population had ever been married; in 2018, it was 67.7%.
  • Average family size was 3.7 people in 1960, and 3.1 people in 2018.
  • Single parent households were 4.4% of households in 1960, and 9.1% of all households in 2010, but slightly down to 8.3% of all households in 2018.
Socioeconomic
  • The share of 25-34 year-olds who are high school graduates was 58.1% in 1960, 84.2% in 1980, and 90.9% in 2018.
  • The share of 25-34 year-olds who are college graduates was 11% in 1960, 27.5% in 2000, and 35.6% in 2017.
  • The average math achievement score for a 17 year-old on the National Assessment of Educational Progress was 304 in 1970, and 306 in 2010.
  • The average reading achievement score for a 17 year-old was 285 in 1970 and 286 in 2010.
Health
  • Life expectancy at birth was 69.7 years in 1960, and 78.7 years in 2010, and 78.6 years in 2017.
  • Infant mortality was 26 per 1,000 births in 1960, and 5.8 per 1,000 births in 2017.
  • In 1960, 13.4% of the population age 20-74 was obese (as measured by having a Body Mass Index above 30). In 2016, 40% of the population was obese.
  • In 1970, 37.1% of those age 18 and older were cigarette smokers. By 2017, this has fallen  to 14.1%.
  • Total national health expenditures were 5.0% of GDP in 1960, and 17.9% of GDP in 2017.
Security and Safety
  • The murder rate was 5.1 per 100,000 people in 1960, rose to 10.2 per 100,000 by 1980, but had fallen back to 4.9 per 100,000 in 2015, before nudging up to 5.3 per 100,000 in 2017..
  • The prison incarceration rate in federal and state institutions was 118 per 100,000 in 1960, 144 per 100,000 in 1980, 519 per 100,000 by 2010, and then down to 464 per 100,000 in 2016.
  • Highway fatalities rose from 37,000 in 1960 to 51,000 in 1980, and then fell to 33,000 in 2010, before nudging up to 37,000 in 2017.
Energy
  • Energy consumption per capita was 250 million BTUs in 1960, rose to 350 million BTUs per person in 2000, but since then has fallen to 300 BTUs per person in 2017.
  • Energy consumption per dollar of real GDP (measured in constant 2009 dollars) was 14,500 BTUs in 1960 vs. 5,700 in 2017.
  • Electricity net generation on a per person basis was 4.202 kWh in 1960, had more than tripled to 13,475 kWh by 2000, but since then has declined to 12,326 kWh in 2017. 
  • The share of electricity generation from renewable sources was 19.7% of the total in 1960, fell to 8.8% by 2005, and since then rose to 17.1% of the total in 2017.
Numbers and comparisons like these are a substantial part of how a head-in-the-clouds academic like me perceives economic and social reality. If you like this kind of stuff, you would probably also enjoy my post from a few years back, "The Life of US Workers 100 Years Ago" (February, 5, 2016).

Thursday, March 28, 2019

Interview With Greg Mankiw at the Dallas Fed

In the latest installment of its "Global Perspectives" series of conversations, Robert S. Kaplan of the Dallas Fed, discussed national and global economic issues with Greg Mankiw on March 7, 2019. The full 50 minutes of video is available here.

For a quick sample, here's what Mankiw had do say on what economists don’t understand about politicians, and vice versa:
I don’t think economists fully understand the set of constraints that politicians operate under, probably because we have tenure, so we can say whatever we want. The politicians don’t. They constantly have to get approval by the voters, and the voters have different views of economic issues than economists do. So the politicians are sort of stuck between the voters they have to appeal to and the economists who are giving them advice. I think understanding the difficult constraints that politicians operate under would be useful.
In terms of what politicians don’t understand about economists, I think they often turn to (economists) for the wrong set of questions. My mentor, [Princeton University economist] Alan Blinder, coined what he calls Murphy’s Law of economic policy, which says that economists have the most influence where they know the least, and they have the least influence where they know the most.
Politicians are constantly asking us, ‘What’s going to happen next year?’ But we are really bad at forecasting. I understand why people need forecasting, as part of the policy process, but we’re really bad at it, and we’re probably not going to be good any time soon. On the other the hand, there are certain problems where we kind of understand the answer. We understand that rent control is not a particularly good way to run a housing market. We understand that if you want to deal with climate change, you probably want to put a price on carbon. If you have a city that suffers from congestion, we can solve that with congestion pricing. 

Can Undergraduates Be Taught to Think Like Economists?

A common goal for principles of economics courses is to teach students to "think like economists." I've always been a little skeptical of that  high-sounding goal. It seems like a lot to accomplish in a semester or two. I'm reminded of an essay written by Deirdre McCloskey back in 1992, which argued that while undergraduates can be taught about economics, thinking like an economist is a much larger step that will only in very rare cases happen in the principles class. Here's McCloskey ("Other Things Equal: The Natural," Eastern Economic Journal, Spring 1992):
"Bower thinks that we can teach economics to undergraduates. I disagree. I have concluded reluctantly, after ruminating on it for a long me, that we can't. We can teach about economics, which is a good thing. The undergraduate program in English literature teaches about literature, not how to do it. No one complains, or should. The undergraduate program in art history teaches about painting, not how to do it. I claim the case of economics is similar. Majoring in economics can teach about economics, but not how to do it....
As an empirical scientist I have to conclude from this and other experiences that thinking like an economist is too difficult to be a realistic goal for teaching. I have taught economics, man and boy, for nearly a century, and I tell you that it is the rare, gifted graduate student who learns to think like an economist while still in one of our courses, and it takes a genius undergraduate (Sandy Grossman, say, who was an undergraduate when I came to Chicago in 1968). Most of the economists who catch on  do so long after graduate school, while teaching classes or advising governments: that's when I learned to think like an economist, and I wonder if your experience is not the same. 
"Let me sharpen the thought. I think economics, like philosophy, cannot be taught to nineteen-year olds. It is an old man's field. Nineteen-year olds are, most of them, romantics, capable of memorizing and emoting, but not capable of thinking coldly in the cost-and-benefit way. Look for example at how irrational they are a few years later when getting advice on post-graduate study. A nineteen-year old has intimations of immortality, comes directly from a socialized economy (called a family), and has no feel on his pulse for those tragedies of adult life that economists call scarcity and choice. You can teach a nineteen-year old all the math he can grasp, all the history he can read, all the Latin he can stand. But you cannot teach him a philosophical subject. For that he has to be, say twenty-five, or better, forty-five. ...
In practical terms, the standard principles of economics course is a long march through a bunch of conceptual ideas: opportunity cost, supply and demand, perfect and imperfect competitions, comparative advantage and international trade, externalities and public goods, unemployment and inflation, monetary and fiscal policy, and more. The immediate concern of most students is to master those immediate tools--what McCloskey calls learning "about" economics. But I do think that in the process of learning "about," many principles students get a meaningful feeling for a the broader subject and mindset. In the introduction to my own principles textbook, I write:
There’s an old joke that economics is the science of taking what is obvious about human behavior and making it incomprehensible. Actually, in my experience, the process works in the other direction. Many students spend the opening weeks of an introductory economics course feeling as if the material is difficult, even impossible, but by the middle and the end of the class, what seemed so difficult early in the term has become obvious and straightforward. As a course in introductory economics focuses on one lesson after another and one chapter after another, it’s easy to get tunnel vision. But when you raise your eyes at the end of class, it can be quite astonishing to look back and see how far you have come. As students apply the terms and models they have learned to a series of real and hypothetical examples, they often find to their surprise that they have also imbibed a considerable amount about economic thinking and the real-world economy. Learning always has an aspect of the miraculous.
Thus, I agree with McCloskey that truly "thinking like an economist" is a very rare outcome in a principles course, and unless you are comfortable as a teacher with setting a goal that involves near-universal failure, it's not a useful goal for instructors. But it also seems true to me that the series of topics in a conventional principles of economics course, and how they build on each other, does for many students combine to form a comprehensible narrative by the end of the class. The students are not thinking like economists. But they have some respect and understanding for how economist think.

Wednesday, March 27, 2019

Child Care and Working Mothers

During the 1990s, a social and legal expectation arose in the United States that single mothers would usually be in the workforce, even when their children were young. In turn, this immediately raised a question of how child care would be provided. The 2019 Economic Report of the President. from the White House Council of Economic Advisers,  offers some useful graphs and analysis of this subject.

Here's are some patterns in the labor force for "prime-age" women between the ages of 25 and 54, broken down by single and married, and children or not. Back in the early 1980s, for example, single women with no children (dark blue line) were far more likely to be in the labor force than other women in this age group, and less than half of the married women with children under the age of six (green line) were in the labor force.

But by about 2000, the share of single prime-age women with no children in the labor force has declined, and had roughly converged with labor force participation rates of the other groups shown--except for the labor force participation rates of married women with children under six, which rose but remained noticeably lower. The report notes: "These married mothers of young children who are out of the labor force are evenly distributed across the educational spectrum, although on average they have somewhat less education than married mothers of young children as a whole."
The two especially big jumps in the figure are for labor force participation of single women with children, with the red line referring to single women with children under the age of six and the gray line referring to single women with children over the age of six. Back around 1990, single and married women with children over the age of six were in the labor force at about the same rate, and single and married women with children under the age of six were in the labor force at about the same rate. But after President Clinton signed the welfare reform legislation in 1996 (formally, the
Personal Responsibility and Work Opportunity Reconciliation Act of 1996), work requirements increased for single mothers receiving government assistance.

If single mothers with lower levels of incomes are expected to work--especially mothers with children of pre-school age--then child care becomes of obvious importance. But as the next figure shows, the cost of child care is often a sizeable percentage of the median hourly wage in a given state. And of course, by definition, half of those paid with an hourly wage earn less than the median.
Mothers who are mainly working to cover child care costs face some obvious disincentives. The report cites various pieces of research that lower child care costs tend to increase the labor force participation of women. For example, a 2017 "review of the literature on the effects of child care costs on maternal labor supply ... concludes that a 10 percent decrease in costs increases employment among mothers by about 0.5 to 2.5 percent."

So what steps might government take to make child care more accessible to households with low incomes? Logically, the two possibilities are finding ways to reduce the costs, or providing additional buying power to those households.

When it comes to reducing costs, one place to look is at the variation in state-level requirements for child care facilities. It's often politically easy to ramp up the strictness of such requirements; after all, passing requirements for child care facilities doesn't make the state spend any money, and who can object to keeping children safe? But when state regulations raise the costs of providing a service, the buyers of that service end up paying the higher costs. The report points out some variations across states by staffing requirements.
"For 11-month-old children, minimum staff-to-child ratios ranged from 1:3 in Kansas to 1:6 in Arkansas, Georgia, Louisiana, Nevada, and New Mexico in 2014. For 35-month-old children, they ranged from 1:4 in the District of Columbia to 1:12 in Louisiana. For 59-month-old children, they ranged from 1:7 in New York and North Dakota to 1:15 in Florida, Georgia, North Carolina, and Texas. Assuming an average hourly wage of $15 for staff members (inclusive of benefits and payroll taxes paid by the employer), the minimum cost for staff per child per hour would range from $2.50 in the most lenient State to $5 in the most stringent State for 11-month-old children, from $1.25 to $3.75 for 35-month old-children, and from $1.00 to $2.14 for 59 month-old children."
Here's a figure illustrating the theme.
Staffing requirements aren't the only rules causing variation in child care costs across states of course. The report notes:
Wages are based on the local labor market demand for the employees’ skills and qualifications, as well as the availability of workers in the field. Regulations that require higher-level degrees or other qualifications drive up the wages required to hire and retain staff, increasing the cost of child care. Though recognizing that some facilities are exempt from these requirements, all States set requirements for minimum ages and qualifications of staff, including some that require a bachelor’s degree for lead child care teachers. Other staff-related regulations that can drive up costs include required background checks and training requirements. In addition to standards regarding staff, many States set minimum requirements for buildings and facilities, including regulating the types and frequency of environmental inspections and the availability of indoor and outdoor space.
The report looks at some studies of the effects of these rules. One study estimates "that decreasing the maximum number of infants per staff member by one (thereby increasing the minimum staff-to-child ratio) decreases the number of center-based care establishments by about 10 percent. Also, each additional year of education required of center directors decreases the supply of care centers by about 3.5 percent." The point, of course, is not that states should all move unquestioningly to lower staffing levels. It's that states should question their rules, and look at practices elsewhere, bearing in mind that the costs of rules hit harder for those with lower incomes.

The other approach to making child care more available is to increase the buying power of low-income households with children, which can be done in a variety of ways.  The Economic Report of the President always brags about the current administration, but it was nonetheless interesting to me that it chose to brag about additional support for child care costs of low-income families:

The Trump Administration has mitigated these work disincentives by substantially bolstering child care programs for low-income families. In 2018, the CCDBG [Child Care and Development Block Grant] was increased by $2.4 billion, and this increase was sustained in 2019. The Child Care and Development Fund, which includes CCDBG and other funds, distributed a total of $8.1 billion to States to offer child care subsidies to low-income families who require child care in order to work, go to school, or enroll in training programs. In addition, Federal child care assistance is offered through TANF, Head Start, and other programs.
There are also mentions of how programs like Supplemental Nutrition Assistance Program (SNAP, or "food stamps") and the Earned Income Tax Credit can help to make child care more affordable. The Child Tax Credit, which was increased in the 2017 tax legislation, including "the refundable component of the CTC for those with earnings but no Federal income tax liability." There's also a child and dependent care tax credit.

When it comes to the incentives and opportunities for low-income women to work, child care is of course just one part of the puzzle, and often not the largest part. But it remains a real and difficult hurdle for a lot of households, especially for lower-income women.  An additional issue is that some households will prefer formal child care, and thus will be benefit more from policies aimed directly at formal child care, while others will rely more informal networks of family and friends, and will benefit more from policies that increase income that be used for any purpose. 

For some other gleanings from this year's Economic Report of the President, see:


Tuesday, March 26, 2019

Geoengineering: The Governance Problem

Solar geoengineering refers to putting stuff in the atmosphere that would have the effect of counteracting greenhouse gases. Yes, there would be risks in undertaking geoengineering. However, those who argue that substantial dangers of climate change are fairly near-term must be willing to consider potentially unpleasant answers. Even if the risks of geoengineering are too substantial right now, given the present state of climate change, if the world as a whole doesn't move forward with steps to hold down emissions of greenhouse gases, then perhaps the risks of geoengineering will look more acceptable in a decade or two? 

Thus, the Harvard Project on Climate Agreements and Harvard’s Solar Geoengineering Research Program have combined to publish Governance of the Deployment of Solar Geoengineering, an introduction followed by 26 short essays on the subject. The emphasis on governance seems appropriate to me, because there's not a huge mystery over how to do solar geoengineering. "The method most commonly discussed as technically plausible and potentially effective involves adding aerosols to the lower stratosphere, where they would reflect some (~1%) incoming sunlight back to space." However, one can also imagine more localized versions of solar geoengineering, like making a comprehensive effort so that all manmade structures--including buildings and roads--would be more likely to reflect sunlight. 

The question of governance is about who decides when and what would be done. As David Keith and Peter Irvine write in their essay: "[T]he hardest and most important problems raised by solar geoengineering are non-technical."

For example, what if one country or a group of countries decided to deploy geoengineering in the atmosphere? Perhaps that area is experiencing particular severe weather where the public is demanding that its politicians take action.  Perhaps it's the "Greenfinger" scenario, in which a very wealthy person decides that its up to them to save the planet. Other countries could presumably respond with some mixture of complaints, trade and financial sanction,  counter-geoengineering to reverse the effects of what the first country was doing, or even military force. Thus, it's important to think both about governance of institutions that would consider deploying geoengineering, but it may be even more important to think about governance of institutions that would decide how to respond when someone else undertake geoengineering. 

Perhaps we can learn from other international agreements, like those affecting nuclear nonproliferation, cybersecurity, even international monetary policy. But countries and regions are likely to be affected differently by climate change, and thus are likely to weigh the costs and benefits of geoengineering differently. Agreement won't be easy. But like the nuclear test-ban treaty, one can imagine rules that allow nation to monitor other nations, to see if they are undertaking geoengineering efforts. 

A common argument among these authors is that geoengineering will happen. ItFor example, Lucas Stanczyk writes: "Looking at the limited range of options available to mitigate the coming climate crisis, it is difficult to escape the conclusion that some form of solar geoengineering will be deployed on a global scale this century." 's just a question of when and where, and of trying to arrange an institutional set-up where the benefits are more likely to outweigh the costs. 

Richard J. Zeckhauser and Gernot Wagner make this point in more detail. They write: 
  • Both unchecked climate change and any potential deployment of solar geoengineering (SG) are governed by processes that are currently unknowable; i.e., either is afflicted with ignorance. 
  • Risk, uncertainty, and ignorance are often greeted with the precautionary principle: “do not proceed.” Such inertia helps politicians and bureaucrats avoid blame. However, the future of the planet is too important a consequence to leave to knee-jerk caution and strategic blame avoidance. Rational decision requires the equal weighting of errors of commission and omission. 
  • Significant temperature increase, at least to the 2°C level, is almost certainly in our planet’s future. This makes research on SG a prudent priority, with experimentation to follow, barring red-light findings. ...
Consider the decision of whether to enroll in a high-risk medical trial. Faced with a bad case of cancer, the standard treatment is high-dose chemotherapy. Now consider as an alternative treatment an experimental bone-marrow transplant. the additional treatment mortality of the trial, of say 4 percentage points, is surely an important aspect of the decision – but so should be the gain in long-run survival probability. If that estimated gain is greater than 4 percentage points, say 10 or even “only” 6 percentage points, a decision maker with the rational goal of maximizing the likelihood of survival should opt for the experimental treatment. 
All too often, however, psychology intervenes, including that of doctors. Errors of commission get weighted more heavily; expected lives are sacrificed. The Hippocratic Oath bans the intention of harm, not its possibility. Its common misinterpretation of “first do no harm” enshrines the bias of overweighing errors of commission. To be sure, errors of commission incur greater blame or self-blame than those of omission when something bad happens, a major source of their greater weight. But blame is surely small potatoes relative to survival, whether of a patient or of the Earth. Hence, we assert once again, italics and all: Where climate change and solar geoengineering are concerned, errors of commission and omission should be weighted equally. 
That also implies that the dangers of SG [solar geoengineering] – and they are real – should be weighed objectively and dispassionately on an equal basis against the dangers of an unmitigated climate path for planet Earth. The precautionary principle, however tempting to invoke, makes little sense in this context. It would be akin to suffering chronic kidney disease, and being on the path to renal failure, yet refusing a new treatment that has had short-run success, because it could have long-term serious side effects that tests to date have been unable to discover. Failure to assiduously research geoengineering and, positing no red-light findings, to experiment with it would be to allow rising temperatures to go unchecked, despite great uncertainties about their destinations and dangers. That is hardly a path of caution.
For an earlier post on this topic, see "Geoengineering: Forced Upon Us?" (May 11, 2015).

Monday, March 25, 2019

Time to Abolish "Statistical Significance"?

The idea of "statistical significance" has been a basic concept in introductory statistics courses for decades. If you spend any time looking at quantitative research, you will often see in tables of results that certain numbers are marked with an asterisk or some other symbol to show that they are "statistically significant."

For the uninitiated, "statistical significance" is a way of summarizing whether a certain statistical result is likely to have happened by chance, or not. For example, if I flip a coin 10 times and get six heads and four tails, this could easily happen by chance even with a fair and evenly balanced coin. But if I flip a coin 10 times and get 10 heads, this is extremely unlikely to happen by chance. Or if I flip a coin 10,000 times, with a result of 6,000 heads and 4,000 tails (essentially, repeating the 10-flip coin experiment 1,000 times), I can be quite confident that the coin is not a fair one. A common rule of thumb has been that if the probability of an outcome occurring by chance is 5% or less--in the jargon, has a p-value of 5% or less--then the result is statistically significant. However, it's also pretty common to see studies that report a range of other p-values like 1% or 10%.

Given the omnipresence of "statistical significance" in pedagogy and the research literature, it was interesting last year when the American Statistical Association made an official statement "ASA Statement on Statistical Significance and P-Values" (discussed here) which includes comments like: "Scientific conclusions and business or policy decisions should not be based only on whether a p-value passes a specific threshold. ... A p-value, or statistical significance, does not measure the size of an effect or the importance of a result. ... By itself, a p-value does not provide a good measure of evidence regarding a model or hypothesis."

Now, the ASA has followed up with a special supplemental issue of its journal The American Statistician on the theme "Statistical Inference in the 21st Century: A World Beyond p < 0.05" (January 2019).  The issue has a useful overview essay, "Moving to a World Beyond “p < 0.05.” by Ronald L. Wasserstein, Allen L. Schirm, and  Nicole A. Lazar. They write:
We conclude, based on our review of the articles in this special issue and the broader literature, that it is time to stop using the term “statistically significant” entirely. Nor should variants such as “significantly different,” “p < 0.05,” and “nonsignificant” survive, whether expressed in words, by asterisks in a table, or in some other way. Regardless of whether it was ever useful, a declaration of “statistical significance” has today become meaningless. ... In sum, `statistically significant'—don’t say it and don’t use it.
The special issue is then packed with 43 essays from a wide array of experts and fields on the general theme of  "if we eliminate the language of statistical significance, what comes next?"

To understand the arguments here, it's perhaps useful to have a brief and partial review of some main reasons why the emphasis on "statistical significance" can be so misleading: namely, it can lead one to dismiss useful and true connections; it can lead one to draw false implications; and it can cause researchers to play around with their results. A few words on each of these.

The question of whether a result is "statistically significant" is related to the size of the sample. As noted above, 6 out of 10 heads can easily happen by chance, but 6,000 out of 10,000 heads is extraordinarily unlikely to happen by chance.  So say that you do an study which finds an effect which is fairly large in size, but where the sample size isn't large enough for it to be statistically significant by a standard test. In practical terms, it seems foolish to ignore this large result; instead, you should presumably start trying to find ways to run the test with a much larger sample size. But in academic terms, the study you just did with its small sample size may be unpublishable: after all, a  lot of journals will tend to decide against publishing a study that doesn't find a statistically significant effect--because it feels as if such a study isn't pointing out any new connection or insight.

Knowing that journals are looking to publish "statistically significant" results, researchers will be tempted to look for ways to jigger their results. Studies in economics, for example, aren't about simple probability examples like flipping coins. Instead, one might be looking at Census data on households that can be divided up in roughly a jillion ways: not just the basic categories like age, income, wealth, education, health, occupation, ethnicity, geography, urban/rural, during recession or not, and others, but also various interactions of these factors looking at two or three or more at a time. Then, researchers make choices about whether to assume that connections between these variables should be thought of a linear relationship, curved relationships (curving up or down), relationships are are U-shaped or inverted-U, and others. Now add in all the different time periods and events and places and before-and-after legislation that can be considered. For this fairly basic data, one is quickly looking at thousands or tens of thousands of possible connections relationships.

Remember that the idea of statistical significance relates to  whether something has a 5% probability or less of happening by chance. To put that another way, it's whether something would have happened only one time out of 20 by chance. So if a researcher takes the same basic data and looks at thousands of possible equations, there will be dozens of equations that look like they had a 5% probability of not happening by chance. When there are thousands of researchers acting in this way, there will be a steady stream of hundreds of result every month that appear to be "statistically significant," but are just a result of the general situation that if you look at a very large number of equations one at a time, some of them will seem to mean something. It's a little like flipping a coin 10,000 times, but then focusing only on the few stretches where the coin came up heads five times in a row--and drawing conclusions based on that one small portion of the overall results.

A classic statement of this issue arises in Edward Leamer's 1983 article, "Taking the Con out of Econometrics" (American Economic Review, March 1983, pp. 31-43). Leamer wrote:
The econometric art as it is practiced at the computer terminal involves fitting many, perhaps thousands, of statistical models. One or several that the researcher finds pleasing are selected for re- porting purposes. This searching for a model is often well intentioned, but there can be no doubt that such a specification search in-validates the traditional theories of inference. ... [I]n fact, all the concepts of traditional theory, utterly lose their meaning by the time an applied researcher pulls from the bramble of computer output the one thorn of a model he likes best, the one he chooses to portray as a rose. The consuming public is hardly fooled by this chicanery. The econometrician's shabby art is humorously and disparagingly labelled "data mining," "fishing," "grubbing," "number crunching." A joke evokes the Inquisition: "If you torture the data long enough, Nature will confess" ... This is a sad and decidedly unscientific state of affairs we find ourselves in. Hardly anyone takes data analyses seriously. Or perhaps more accurately, hardly anyone takes anyone else's data analyses seriously."
Economists and other social scientists have become much more aware of these issues over the decades, but Leamer was still writing in 2010 ("Tantalus on the Road to Asymptopia," Journal of Economic Perspectives, 24: 2, pp. 31-46):
Since I wrote my “con in econometrics” challenge much progress has been made in economic theory and in econometric theory and in experimental design, but there has been little progress technically or procedurally on this subject of sensitivity analyses in econometrics. Most authors still support their conclusions with the results implied by several models, and they leave the rest of us wondering how hard they had to work to find their favorite outcomes ... It’s like a court of law in which we hear only the experts on the plaintiff’s side, but are wise enough to know that there are abundant for the defense. 
Taken together, these issues suggest that a lot of the findings in social science research shouldn't be believed with too much firmness. The results might be true. They might be a result of a researcher pulling out "from the bramble of computer output the one thorn of a model he likes best, the one he chooses to portray as a rose." And given the realities of real-world research, it seems goofy to say that a result with, say, only a 4.8% probability of happening by chance is "significant," while if the result had a 5.2% probability of happening by chance it is "not significant." Uncertainty is a continuum, not a black-and-white difference.

So let's accept the that the "statistical significance" label has some severe problems, as Wasserstein, Schirm, and Lazar write:
[A] label of statistical significance does not mean or imply that an association or effect is highly probable, real, true, or important. Nor does a label of statistical nonsignificance lead to the association or effect being improbable, absent, false, or unimportant. Yet the dichotomization into “significant” and “not significant” is taken as an imprimatur of authority on these characteristics. In a world without bright lines, on the other hand, it becomes untenable to assert dramatic differences in interpretation from inconsequential differences in estimates. As Gelman and Stern (2006) famously observed, the difference between “significant” and “not significant” is not itself statistically significant.
But as they recognize, criticizing is the easy part. What is to be done instead? And here, the argument fragments substantially. Did I mention that there were 43 different responses in this issue of the American Statistician?

Some of the recommendations are more a matter of temperament than of specific statistical tests. As Wasserstein, Schirm, and Lazar emphasize, many of the authors offer advice that can be summarized in about seven words: "Accept uncertainty. Be thoughtful, open, and modest.” This is good advice! But a researcher struggling to get a paper published might be forgiven for feeling that it lacks specificity.

Other recommendations focus on the editorial process used by academic journals, which establish some of the incentives here. One interesting suggestion is that when a research journal is deciding whether to publish a paper, the reviewer should only see a description of what the researcher did--without seeing the actual empirical findings. After all, if the study was worth doing, then it's worthy of being published, right? Such an approach would mean that authors had no incentive to tweak their results. A method already used by some journals is "pre-publication registration," where the researcher lays out beforehand, in a published paper, exactly what is going to be done. Then afterwards, no one can accuse that researcher of tweaking the methods to obtain specific results.

Other authors agree with turning away from "statistical significance," but in favor of their own preferred tools for analysis: Bayesian approaches, "second-generation p-values," "false positive risk,"
"statistical decision theory," "confidence index," and many more. With many alternative examples along these lines, the researcher trying to figure out how to proceed can again be forgiven for desiring little more definitive guidance.

Wasserstein, Schirm, and Lazar also asked some of the authors whether there might be specific situations where a p-value threshold made sense. They write:
"Authors identified four general instances. Some allowed that, while p-value thresholds should not be used for inference, they might still be useful for applications such as industrial quality control, in which a highly automated decision rule is needed and the costs of erroneous decisions can be carefully weighed when specifying the threshold. Other authors suggested that such dichotomized use of p-values was acceptable in model-fitting and variable selection strategies, again as automated tools, this time for sorting through large numbers of potential models or variables. Still others pointed out that p-values with very low thresholds are used in fields such as physics, genomics, and imaging as a filter for massive numbers of tests. The fourth instance can be described as “confirmatory setting[s] where the study design and statistical analysis plan are specified prior to data collection, and then adhered to during and after it” ...  Wellek (2017) says at present it is essential in these settings. “[B]inary decision making is indispensable in medicine and related fields,” he says. “[A] radical rejection of the classical principles of statistical inference…is of virtually no help as long as no conclusively substantiated alternative can be offered.”
The deeper point here is that there are situation where a researcher or a policy-maker or an economic needs to make a yes-or-no decision. When doing quality control, is it meeting the standard or not? when the Food and Drug Administration is evaluating a new drug, does it  approve the drug or not? When a researcher in genetics is dealing with a database that has thousands of genes, there's a need to focus on a subset of those genes, which means making yes-or-no decisions on which genes to include a certain analysis.

Yes, the scientific spirit should "Accept uncertainty. Be thoughtful, open, and modest.” But real life isn't a philosophy contest. Sometimes, decisions need to be made. If you don't have a statistical rule, then the alternative decision rule becomes human judgment--which has plenty of cognitive, group-based, and political biases of its own.

My own sense is that "statistical significance" would be a  very poor master, but that doesn't mean it's a useless servant. Yes, it would foolish and potentially counterproductive to give excessive weight to "statistical significance." But the clarity of conventions and rule, when their limitations are recognized and acknowledges, can still be useful. I was struck by a comment in the essay by Steven N. Goodman:
P-values are part of a rule-based structure that serves as a bulwark against claims of expertise untethered from empirical support. It can be changed, but we must respect the reason why the statistical procedures are there in the first place ... So what is it that we really want? The ASA statement says it; we want good scientific practice. We want to measure not just the signal properly but its uncertainty, the twin goals of statistics. We want to make knowledge claims that match the strength of the evidence. Will we get that by getting rid of P−values? Will eliminating P−values improve experimental design? Would it improve measurement? Would it help align the scientific question with those analyses? Will it eliminate bright line thinking? If we were able to get rid of P-values, are we sure that unintended consequences wouldn’t make things worse? In my idealized world, the answer is yes, and many statisticians believe that. But in the real world, I am less sure.

Friday, March 22, 2019

What Did Gutenberg's Printing Press Actually Change?

There's an old slogan for journalists: "If your mother says she loves you, check it out." The point is not to be  too quick to accept what you think you already know.

In a similar spirit, I of course know that the introduction of a printing press with moveable type by to Europe in 1439 by Johannes Gutenberg is often called one of the most important inventions in world history. However, I'm grateful that Jeremiah Dittmar and Skipper Seabold have been checking it out. They have written "Gutenberg’s moving type propelled Europe towards the scientific revolution," for the LSE Business Review (March 19, 2019). It's a nice accessible version of the main findings from their  research paper, "New Media and Competition: Printing and Europe'sTransformation after Gutenberg" (Centre for Economic Perfomance Discussion Paper No 1600 January 2019). They write:

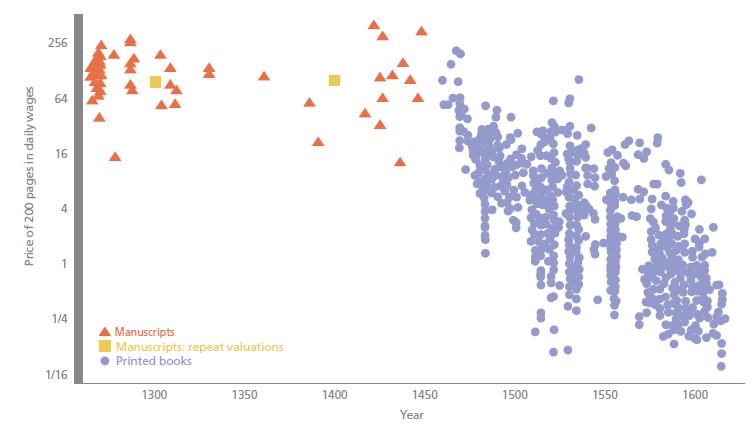
"Printing was not only a new technology: it also introduced new forms of competition into European society. Most directly, printing was one of the first industries in which production was organised by for-profit capitalist firms. These firms incurred large fixed costs and competed in highly concentrated local markets. Equally fundamentally – and reflecting this industrial organisation – printing transformed competition in the ‘market for ideas’. Famously, printing was at the heart of the Protestant Reformation, which breached the religious monopoly of the Catholic Church. But printing’s influence on competition among ideas and producers of ideas also propelled Europe towards the scientific revolution.While Gutenberg’s press is widely believed to be one of the most important technologies in history, there is very little evidence on how printing influenced the price of books, labour markets and the production of knowledge – and no research has considered how the economics of printing influenced the use of the technology."


Dittmar and Seabold aim to provide some of this evidence. For example, here's their data on how the price of 200 pages changed over time, measured in terms of daily wages. (Notice that the left-hand axis is a logarithmic graph.) The price of a book went from weeks of daily wages to much less than one day of daily wages. 


They write: "Following the introduction of printing, book prices fell steadily. The raw price of books fell by 2.4 per cent a year for over a hundred years after Gutenberg. Taking account of differences in content and the physical characteristics of books, such as formatting, illustrations and the use of multiple ink colours, prices fell by 1.7 per cent a year. ... [I]n places where there was an increase in competition among printers, prices fell swiftly and dramatically. We find that when an additional printing firm entered a given city market, book prices there fell by 25%. The price declines associated with shifting from monopoly to having multiple firms in a market was even larger. Price competition drove printers to compete on non-price dimensions, notably on product differentiation. This had implications for the spread of ideas."

Another part of this change was that books were produced for ordinary people in the language they spoke, not just in Latin. Another part was that wages for professors at universities rose relative to the average worker, and the curriculum of universities shifted toward the scientific subjects of the time like "anatomy, astronomy, medicine and natural philosophy," rather than theology and law.
The ability to print books affected religious debates as well, like the spread of Protestant ideas after Martin Luther circulated his 95 theses criticizing the Catholic Church in 1517.

Printing also affected the spread of technology and business.
Previous economic research has studied the extensive margin of technology diffusion, comparing the development of cities that did and did not have printing in the late 1400s ...  Printing provided a new channel for the diffusion of knowledge about business practices. The first mathematics texts printed in Europe were ‘commercial arithmetics’, which provided instruction for merchants. With printing, a business education literature emerged that lowered the costs of knowledge for merchants. The key innovations involved applied mathematics, accounting techniques and cashless payments systems.
The evidence on printing suggests that, indeed, these ideas were associated with significant differences in local economic dynamism and reflected the industrial structure of printing itself. Where competition in the specialist business education press increased, these books became suddenly more widely available and in the historical record, we observe more people making notable achievements in broadly bourgeois careers.
It is impossible to avoid wondering if economic historians in 50 or 100 years will be looking back on the spread of internet technology, and how it affected patterns of technology diffusion, human capital, and social beliefs--and how differing levels of competition in the market may affect these outcomes. 

Thursday, March 21, 2019

The Remarkable Renaissance in US Fossil Fuel Production

M. King Hubbert was a big-name geologist who worked much of his career for Shell oil. Back in the 1970s, when OPEC taught the US that the price of oil was set in global markets, discussions of US energy production often began with the "Hubbert curve," based on a 1956 paper in which Hubbert predicted with considerable accuracy that US oil production would peak around 1970. The  2019 Economic Report of the President devotes a chapter to energy policy, and offers a reminder what happened with Hubbert's curve.

The red line shows Hubbert's predicted oil production curve from 1956. The blue line shows actual US oil production in the lower 48 states. At the time of Hubbert's death in 1989, his forecast looked spot-on. Even by around 2010, his forecast looked pretty good. But for those of us who had built up a habit since the 1970s of looking at US oil production relative to Hubbert's prediction, the last decade has been a dramatic shock. .

Indeed, domestic US oil production now outstrips that of the previous world leaders: Saudi Arabia and Russia.

The surge in US fossil fuel production is about natural gas as well as oil. Here's a figure which combines output of all US fossil fuel production, measured by its energy content. You can see that it's (very) roughly constant from the 1980s up through about 2010, and then everything changes.


Many Americans are ambivalent about fossil fuel production. We demonstrate our affection for it by driving cars, riding in airplanes, and consuming products that are shipped over US transportation networks and produced with fossil fuels (for many of us, including electricity). People who live in  parts of the country that are active in fossil fuel production often like the jobs and the positive effects on the local economy. On the other side, many of us worry both about environmental costs of energy production and use, and how they might be reduced.

Big picture, the US economy has been using less energy to produce each $1 of GDP over time, as have other high-income economies like those of western Europe.
My guess is that the higher energy consumption per unit of output in the US economy is partly because the US is a big and sprawling country, so transportation costs are higher, but also that many European countries impose considerably higher taxes on energy use than the US, which tends to hold down consumption.

The US could certainly set a better example for other countries in making efforts to reduce carbon emissions. But that said, it's also worth noting that US emissions of carbon dioxide have been essentially flat for the last quarter-century. More broadly, North America is 18% of global carbon emissions, Europe is 12%, and the Asia-Pacific region is 48%.  Attempts to address global carbon emissions that don't have a heavy emphasis on the Asia Pacific region are missing the bulk of the problem.

Overall, it seems to me that the sudden growth  of the US energy sector has been a positive force. No, it doesn't mean that the US is exempt from global price movements in energy prices. As the US economy has started to ramp up energy exports, it will continue to be clear that energy prices are set in global markets. But the sharp drop in energy imports has helped to keep the US trade deficit lower than it would otherwise have been. The growing energy sector has been a source of US jobs and output. The shift from coal to natural gas as a source of energy has helped to hold down US carbon dioxide emissions. Moreover, domestically-produced US energy is happening in a country which has, by world standards, relatively tight environmental rules on such activities.

Wednesday, March 20, 2019

Wealth, Consumption, and Income: Patterns Since 1950

Many of us who watch the economy are slaves to what's changing in the relatively short-term, but it can be useful to anchor oneself in patterns over longer periods. Here's a graph from the 2019 Economic Report of the President which relates wealth and consumption to levels of disposable income over time.
The red line shows that total wealth has typically equal to about six years of total personal income in the US economy: a little lower in the 1970s, and  a little higher in recent years at the peak of the dot-com boom in the late 1990s, the housing boom around 2006, and the present.

The blue line shows that total consumption is typically equal to about .9 of total personal income, although it was up to about .95 before the Great Recession, and still looks a shade higher than was typical from the 1950s through the 1980s.

Total stock market wealth and total housing wealth were each typically roughly equal to disposable income from the 1950s up through the mid-1990s, although stock market wealth was higher in the 1960s and housing wealth was higher in the 1980s. Housing wealth is now at about that same long-run average, roughly equal to disposable income. However, stock market wealth has been nudging up toward being twice as high as total disposable income in the late 1990s, round 2007, and at present .

A figure like this one runs some danger of exaggerating the stability of the economy. Even small  movements in these lines over a year or a few years represent big changes for many households.

What jumps out at me is the rise in long-term stock market wealth relative to income since the late 1990s. That's what is driving total wealth above its long-run average. And it's probably part of what what is causing consumption levels relative to income to be higher as well. That relatively higher level of stock market wealth is propping up a lot of retirement accounts for both current and future retirees--including my own.

Reentry from Out of the Labor Market

Each year, the White House Council of Economic Advisers published the Economic Report of the President, which can be thought of as a loyalist's view of the current economic situation. For example, if you are interested in a rock-ribbed defense of the Tax Cuts and Jobs Act passed in December 2017 or of the deregulatory policies of the Trump administration looks like, then Chapters 1 and 2 of the 2019 report are for you. Of course, some people will read these chapters with the intention of citing the evidence in support of the Trump administration, while others will be planning to use the chapters for intellectual target practice. The report will prove useful for both purposes.

Here, I'll focus on some pieces of the 2019 Economic Report of the President that focus more on underlying economic patterns, rather than on policy advocacy.  For example, some interesting patterns have emerged in what it means to be "out of the labor market."

Economists have an ongoing problem when looking at unemployment. Some people don't have a job and are actively looking for one. They are counted as "unemployed." Some people don't have a job and aren't looking for one. They are not included in the officially "unemployed," but instead are "out of the labor force." In some cases, those who are not looking for a job are really not looking--like someone who has firmly entered retirement. But in other cases, some of those not looking for a job might still take one, if a job was on offer.

This issue came up a lot in the years after the Great Recession. The official unemployment rate topped out in October 2009 at 10%. But as the unemployment rate gradually declined, the "labor force participation" rate also fell--which means that the share of Americans who were out of the labor force and not looking for a job was rising.You can see this pattern in the blue line below.
There were some natural reasons for the labor force participation rate to start declining after about 2010. In particular, the leading edge of the "baby boom" generation, which started in 1945, turned 65 in 2010, so it had long been expected that labor force participation rates would start falling with their retirements.

Notice that the fall in labor force participation rates levelled off late in 2013. Lower unemployment rates since that time cannot be due to declining labor force participation. Or an alternative way to look at the labor market is to focus on employment-to-population--that is, just ignore the issue of whether those who lack jobs are looking for work (and thus "in the labor force") or not looking for work (and thus "out of the labor force"). At about the same time in 2013 when the drop in the labor force participation rate leveled out, the red line shows that the employment-to-population ratio started rising.

What especially interesting is that many of those taking jobs in the last few years were not being counted as among the "unemployed." Instead, they were in that category of "out of the labor force"--that is, without a job but not looking for work. However, as jobs became more available, they have proved willing to take jobs. Here's a graph showing the share of adults starting work who were previously "out of the labor force" rather than officially "unemployed."
A couple of things are striking about this figure.

1) Going back more than 25 years, it's consistently true that more than half of those starting work were not counted as "unemployed," but instead were "out of the labor force." In other words, the number of officially "unemployed" is not a great measure of the number of people actually willing to work, if a suitable job is available.

2) The ratio is at its  highest level since the start of this data in 1990. Presumably this is because when the official unemployment rate is so low (4% or less since March 2018), firms that want to hire are needing to go after those who the official labor market statistics treated as "not in the labor force."

Tuesday, March 19, 2019

Alternatives to the Four-Year College Track for Everyone Else

As the US goes through one of its periodic paroxysms over how the small minority of high school graduates who attend a selective four-year undergraduate college is chosen, it's worth taking a moment to remember everyone else.  US high schools graduate about 3.6 million students each year. That's a big group, with a wide array of abilities, preparation, and interests. For a substantial number of them, high school was not an especially rewarding academic experience, and no matter what they are told by their college-educated teachers and college-educated counselors, the idea of signing up for a few more years of academic courses is not very enticing.

Oren Cass has written a short essay about this group, "How the Other Half Learns: Reorienting an Education System That Fails Most Students" (Manhattan Institute, August 2018). Here are a couple  of points that caught my eye. 

One study looked back at the students who graduated from high school in 2003, and how the education system had treated them six years later. The data is obviously a few years old, but the overall patterns don't seem to have changed much. For example, about 70% of high school grads enrolled in college in 2003, and about 70% did so in 2016, too.  

Of the 70% who started off to college in 2003, about two-thirds went to a four-year school and one-third to a two years school. Six years later, by 2009, fewer than half of those who started off to college in 2003 had a degree. 

Cass calculates the proportions this way: 
Consider a cohort of 100 students arriving in the ninth grade:
  • Of the 100, 18 of them won’t graduate on time from high school 
  • Of the 82 who do graduate, 25 won’t enroll in higher education
  • Of the 57 who do enroll, 29 won’t earn even an associate’s degree after six years
  • Of the 28 who do graduate, 12 will land in jobs that do not require a degree 
  • Only 16 will successfully navigate the high school to college to career pipeline—the current aim of the education system.
Of course, these problems are fairly well-known. I've written here about "The Problem of College Completion Rates" (June 29, 2018), and about "Some Proposals for Improving Work, Wages and Skills for Americans" (February 19, 2019) like a dramatic expansion of community colleges. But my sense is that the issue here runs deeper. Cass offers one way of thinking about alternatives. 

Of course, this alternative track does require students to make some choices in about 11th grade, but frankly, that doesn't worry me too much. By 10th grade, a lot of students have a fairly good grip on where they stand academically. And if a student chooses a career and technical education track, but decides after a couple of years to give college a try, that's of course just fine. 

The bigger hurdle, it seems to me, is that the alternative vision requires a group of employers who are willing to restructure their organizations in a way that will enable a steady stream of 18-20 year-olds to enter a subsidized work program every year. Moreover, these employers need to treat these young workers not just as an unskilled pair of hands, but to think about what kinds of training and certification these young workers should be attaining during this time. Most US employers are not used to thinking of themselves in these roles. 

But it seems to me that a substantial share of the 3.6 million high school graduates each year might prefer something like Cass's "alternative pathway" to a four-year college degree. As the figure illustrates, society would not be investing less in these young adults--it would just be investing differently. Like a lot of people who ended up working in academia, I went off to college eager and enthusiastic about doing things like reading Adam Smith and Plato, and writing papers about topics like the international law ramifications of the UK-Icelandic cod fishery disputes of the 1970s. But I have noticed over time that not everyone shares my enthusiasms. The US needs alternative paths to good jobs at good wages that don't just involve telling all of the 3.6 million high school graduates  they need to keep going to school.  

Monday, March 18, 2019

Paul Cheshire: "Cities are the Most Welfare Enhancing Human Innovation In History"

Hites Ahir interviews Paul Cheshire in the March 2019 issue of his Housing Watch Newsletter (interview here, full newsletter here). Here are a few of Cheshire's comments that caught my eye:

The Economic Gains from Cities
"There are many types of agglomeration economies in consumption and we really know very little about them still but my assessment is that cities are the most welfare enhancing human innovation in history: they empowered the division of labour, the invention of money, trade and technical inventions like the wheel – let alone government, the arts or culture."
Why Land is Regaining Importance in Economic Analysis
"Classical economists devoted far more effort to trying to understand the returns to land than they did to labour or capital: it was both the most important asset and the most important factor of production. When Adam Smith was writing only about 12 percent of Europe’s population lived in cities and even in the most industrialised country, Britain, the value of agricultural land was about 3 times that of annual GDP. But as the value of other assets increased, interest in land diminished so that by about 1970 really only agricultural economists and a few urban economists were interested in it: and they did not talk to each other. But by 2010 residential property, mostly the land on which houses sat, was worth three times as much as British GDP. By the end of 2013 houses accounted for 61 percent of the UK’s net worth: up from 49 percent 20 years ago. Land, now urban land, is valuable, so there is renewed interest."
Urban Policy Often Misses the Problems of the Modern City
"Luckily cities are so resilient because urban policy is generally so bad! ... Policy has been dominated by physical and design ways of thinking: great for building those fantastic innovations of the 19th Century – sewers or water supply. But not useful for facilitating urban growth and offsetting for the costs of city size. We know cities keep on getting more productive the bigger they are but some costs – the price of space, congestion, for example – also increase with city size. So urban policy should offset for those costs. Instead it mainly increases them. Popular policies of densification and containment restrict the supply of space, increasing its price as cities grow so we forego socially valuable agglomeration economies. Another popular policy – height restrictions – reduces gains from ‘vertical’ agglomeration economies."

Friday, March 15, 2019

Some Peculiarities of Labor Markets: Is Antitrust an Answer?

Labor markets are in some ways fundamentally different from markets for goods and services. A job is a relationship, but in general, the worker needs the relationship to begin and to last more than the employer does/ John Bates Clark , probably the most eminent American economist of his time, put it this way in his 1907 book, Essentials of Economic Theory
"In the making of the wages contract the individual laborer is at a disadvantage. He has something which he must sell and which his employer is not obliged to take, since he [that is, the employer] can reject single men with impunity. ... A period of idleness may increase this disability to any extent. The vender of anything which must be sold at once is like a starving man pawning his coat—he must take whatever is offered."
In the last few years, an idea has emerged that the same government agencies that are supposed to be concerned about monopoly power--that is, when dominant firms in an industry can take advantage of the lack of competition to raise the prices paid by consumers--should also be concerned about "monopsony" power--that is, when dominant firms in an industry can take advantage of the lack of competition to reduce the wages paid to workers. Eric A. Posner, Glen Weyl and Suresh Naidu offer a useful overview of this line of thought in "Antitrust Remedies for Labor Market Power," published in the Harvard Law Review. (132 Harv. L. Rev. 536, December 2018). My own sense is that their discussion of the power imbalance in labor markets is fully persuasive, but it also seems to me that antitrust is at most a very partial and incomplete way of addressing these issues. 

Here's a nice explanation from Posner, Weyl, and Naidu of why workers have reason to feel vulnerable to the monopsony power of employers in labor markets (footnotes omitted):

But there is reason to believe that labor markets are more vulnerable to monopsony than products markets are to monopoly, thanks to a different literature in economics. This literature, for which Professors Lloyd Shapley and Alvin Roth were awarded the Nobel Prize, emphasizes the importance of matching for labor markets.The key point is that in labor markets, unlike in product markets, the preferences of both sides of the market affect whether a transaction is desirable. 
Compare buying a car in the product market and searching for a job. Both are important, high-stakes choices that are taken with care. However, there is a crucial difference. In a car sale, only the buyer cares about the identity, nature, and features of the product in question — the car. The seller cares nothing about the buyer or (in most cases) what the buyer plans do with the car. In employment, the employer cares about the identity and characteristics of the employee and the employee cares about the identity and characteristics of the employer. Complexity runs in both directions rather than in one. Employers search for employees who are not just qualified, but also who possess skills and personality that are a good match to the culture and needs of that employer. At the same time, employees are looking for an employer with a workplace and working conditions that are a good match for their needs, preferences, and family situation. Only when these two sets of preferences and requirements “match” will a hire be made. 
This two-sided differentiation is why low-skill workers may be as or even more vulnerable to monopsony than high-skill workers, despite possibly being less differentiated for employers. Low-skill workers may have less access to transportation, well-situated housing markets, child care options, and job information, and be more dependent on local, informal networks, all of which make jobs less substitutable and employers more differentiated. 
This dual set of relevant preferences means that labor markets are doubly differentiated by the idiosyncratic preferences of both employers and workers. In some sense this dual set of preferences “squares” the differentiation that exists in product markets, naturally making labor markets thinner than product markets. This relative thinness means that the cost of entering a transaction — in relation to the gains from trade — is on average greater in employment markets than in product markets because people are not as interchangeable as goods. 
These matching frictions both cause and reinforce the typically long-term nature of employment relationships compared to most product purchases, leading to significant lock-in within employment relationships. They are also reinforced by the more geographically constrained nature of labor markets. In our increasingly digital and globalized world, products are easily shipped around the country and world; people are not. While traveling is easier than in the past, and telecommuting has become more common, labor markets remain extremely local while most product markets are regional, national, or even global.Most jobs still require physical proximity to the employer, greatly narrowing the geographic scope of most labor markets, given that many workers are not willing to move away from family to take a job. Two-income families further complicate these issues because each spouse must find a job in the area in which the other can, further narrowing labor markets. Together these factors naturally make labor markets highly vulnerable to monopsony power, much more vulnerable than most product markets are to monopoly power.
To what extent might antitrust be a remedy for these kinds of issues? There are certainly situations where it seems appropriate. For example,  the authors discuss "the revelation that high-profile Silicon Valley tech firms, including Apple and Google, entered nopoaching agreements, in which they agreed not to hire each other’s employees. This type of horizontal agreement is a clear violation of the
Sherman Act. The firms settled with the government [in 2018], but the casual way in which such major firms, with sophisticated legal staffs, engaged in such a blatant violation of the law appears to have alarmed antitrust authorities. The government subsequently issued guidelines to human resources offices warning them that even implicit agreements not to poach competitors’ employees are illegal." 

Another set of examples involve the growth of "non-compete" agreements, in which a worker is required to sign an agreement to not to work for a competing firm for some period of time (for additional discussion, see "The Economics of Noncompete Agreements," April 19, 2016). It's also true that about 25% of the US workforce is now in jobs that require a government license, and these licenses often appear to be at least as much about limiting competition in a certain area of the labor market--for example, blocking movement across state lines-- as ensuring quality and information for consumers
One can also imagine that standard merger investigations might take labor market effects into account. For example, say that three hospitals in a local area propose a merger. The standard analysis would look at the reduction in competition that is likely to occur, along with the possibility of higher prices for consumers, and then balance that against whether the merger is likely to produce efficiency gains or synergies that would benefit consumers. This analysis might also take into account not just effects on consumers, but whether the monopsony power of the merged hospitals might push down labor wages in that local market.

But at least for me, it's not clear that there are a lot of standard merger cases, focused on product market competition and effects on consumers, where including the labor market effects would alter the outcome. Perhaps more to the point, conventional antitrust doesn't seem likely to do much at all about the deeper pecularities of labor markets, like the issues pointed out above of two-sided differentiation, moving costs, two-earner couples looking for a job in the same place, and so on.

Perhaps one answer is to expand our notion of how the competition authorities might address the issue of labor market power of large employers. The authors write in a somewhat speculative tone:
Our present business landscape exhibits a number of extremely powerful employers as a result of the neglect of mergers and other anticompetitive behavior in labor markets. While a more detailed examination would be needed to draw any firm conclusions, antitrust investigations into massive employers (such as Compass Group, Accenture, Amazon, Uber, and Walmart), as well as platform-based firms that receive vast flows of valuable data services without any compensation (such as Facebook and Google), seem warranted. It may be that some of these firms have achieved such powerful monopsonies that they should be broken up.
Again, the argument here is not that consumers would benefits from breaking up these firms, but that it should be considered on behalf of workers, with the belief that if these firms operated with more competitors, they would need to pay higher wages. I'm open to more evidence on this point, but I'm unpersuaded by the existing evidence. It seems to me that the more direct approach to addressing the generalized power imbalance against workers is to pursue various "active labor market policies" that provide assistance with job search, relocation, and retraining, as well as doing whatever we can to run a "high pressure" economy where unemployment rates are low, so that workers are both in demand and have some plausible alternative options if they want or need to switch employers.

Postscript: For a discussion of how an economist and a classics scholar came up with teh terminology of "monopsony" back in 1933, see Thornton, Robert, J. 2004. "Retrospectives: How Joan Robinson and B. L. Hallward Named Monopsony." Journal of Economic Perspectives, 18 (2): 257-261.)

Thursday, March 14, 2019

Greg Mankiw on Textbooks, and Some Reactions

Greg Mankiw is the author of two leading undergraduate economics textbooks: one for the introductory principles of economics course and the other for intermediate macro. At his blog, he linked an essay he has just written, "Reflections of a Textbook Author" (March 6, 2019).  Those teaching or taking either principles or intermediate macro will find it of interest, as well as those who have contemplated writing a textbook of their own.

I've had experiences to build up some views about intro economics pedagogy over the years. I've been involved in several introductory textbooks: first as a commenter and editor for the first edition of the introductory Economics textbook by Joseph Stiglitz published in 1993, and more recently as the authors of my own Principles of Economics textbook (first edition published in 2008, and of course I commend the most recent high-quality and affordable edition to your attention), which was used in a  revised, shortened, and reorganized form as the backbone for the freely downloadable Principles of Economics book available through OpenStax. I've taught intro econ at Stanford and the University of Minnesota. I've also done some non-textbook, non-classroom introductions to economics. For example, back in the mid-1990s I recorded the first edition of an Economics course, explaining terminology and trends without graphs, for the Teaching Company back in 1995--the most recent edition is here. Those lectures became the basis for my 2012 book The Instant Economist. Last year, I did a series of 90 podcasts, 15 minutes each, for the Chinese company Ximalaya, explaining intro economics terms in a nontechnical way with examples and context from China's economy.

Here, I'll pass along a few thoughts from Mankiw's essay that caught my eye, with some reactions of my own, but Greg is a lovely and insightful writer, so there's lots more at the essay itself.

Principles Instructor as Ambassador
"Just as ambassadors are supposed to faithfully represent the perspective of their nations, the instructor in an introductory course (and intermediate courses as well) should faithfully represent the views shared by the majority of professional economists. ... This perspective of instructor as ambassador raises the question of what instructors should do if they hold views far from the mainstream of the economics profession. If you are an Austrian or Marxist economist, for example, what should you do if asked to teach an introductory course? In my view, there are only two responsible courses of action. One is to sublimate your own views and spend most of the course teaching what the mainstream believes, even if you disagree with it. Because many introductory students will take only one or two courses in economics throughout their educations, it would be pedagogical malpractice, in my judgment, to focus on an idiosyncratic minority viewpoint. The other responsible course of action is to avoid teaching introductory (and even intermediate) courses entirely." 
I very much agree with this sentiment. But I'd also add that there should be some room, at least at larger universities, for some nonstandard overviews of economics. For example, many schools have  freshman seminars taught by regular faculty that focus on writing, but with content specific to the professor. Or departments could offer some intro-level courses, without prerequisites, that aren't the standard course. One would probably need to specify that these alternative courses would not be a good preparation for intermediate micro and intermediate macro to follow. But carving out and preserving some room for experimentation at the intro level seems potentially useful.

From Supply and Demand to Consumer and Producer Surplus
"Haven’t supply and demand always been at the center of the introductory course? Surprisingly, no. The first edition of Paul Samuelson's great text, published in 1948 and 608 pages long, did not introduce supply and demand curves until page 447. That is in part because Samuelson, writing in the shadow of the Great Depression, began his book by emphasizing Keynesian macroeconomics. As the book was revised over many editions, standard microeconomic tools became more prominent. But even today, many introductory courses do not develop the framework of supply and demand as fully as they should. In particular, welfare economics is sometimes not given sufficient coverage. The basic tools of welfare economics are consumer surplus and producer surplus, which are natural extensions of supply and demand."
Pretty much all modern intro textbooks are the intellectual children of Samuelson's 1948 text, just revised and updated in various ways. My understanding is that if you go back before that textbook, it was common for intro economics courses to have almost no graphs at all--whether supply-and-demand or otherwise. Following Samuelson, it was also standard to do macro before micro, which seemed based on the assumption that macro had more of a connection to current events and would be an easier way to hook intro students into the subject.

I confess that I'm more dubious than Mankiw when it comes to bringing consumer and producer surplus into the intro class. In my experience, triangular areas under curves are hard for a lot of intro students, and I'm not sure the payoff is very high for the intro student--which is most of them--who aren't ever going to take another econ class. In the great struggle over what to include and what to leave out, I'd put less emphasis on on this topic than Mankiw--and I wouldn't quarrel with an instructor who decided just to leave it out.

Including Too Much?
"For many years, Otto Eckstein ran the introductory course at Harvard. Unfortunately, I never met him as he passed away just before I joined the faculty. But I have heard one of his aphorisms. Apparently, Otto often told section leaders, `The less you teach them, the more they learn.' What I believe he meant by this is that instructors should avoid overwhelming introductory students with too much information all at once. ... As economists, we teach our students about scarcity. As instructors and textbook authors, we should remember that student time is a scarce resource. We must avoid making our courses encyclopedic. That means taking out all of the easily ignored details and stressing the big ideas. The main goal of the introductory course is not to produce future economists but to produce well-informed citizens. Any topic that a person does not need to understand to intelligently follow the news is a plausible candidate for omission. One risk when simplifying matters for students is oversimplification, losing too much of the nuance that economists bring to an issue. But given the difficulty some students have learning basic economics, it is a bigger risk to overcomplicate the analysis early in the course."
In writing a book, there are ongoing pressures to add more. Every reader has a pet topic, or a pet example, or a pet caveat, that would only take another page. A standard response is to write a textbook with the idea that certain chapters will be "core," while other instructors can be dropped by professors if they prefer. In my own textbook, for example, there is a chapter on imperfect information and insurance, and another chapter on financial markets, which can be dropped. In one of the macro chapters, I include the Keynesian cross diagram for teaching about macro in the short-run, but I place it as the second half of a chapter so that it can be smoothly omitted if a professor desires.

While the individual choices about what to include are usually defensible, it  seems fair to me to ask whether the current intro model--whether Mankiw's book or my own--is actually aimed at producing well-informed citizens rather than prepping students for the intermediate micro and macro courses that typically follow in the undergrad econ major. As someone who took intro econ awhile back about their memory of the course, and you're likely to get a wry smile and a memory of how there were a bunch of graphical exercises to solve. It's not obvious to me that someone who has taken the standard intro class would have been in a substantially improved position "to intelligently follow the news" about, say, the causes of the Great Recession, or what happens when the policy interest rate targetted by the Federal Reserve went to near-zero, or the arguments about the Patient Protection and Affordable Care Act and the Dodd-Frank bill passed in 2010, or the current arguments over China's economic growth or the Tax Cuts and Jobs Act passed in 2017. It's not clear to me that the standard intro class empowers students to know where and how to look up data and mainstream argument on these subjects and others, either.

Everyone has worried for a long time about the intro course including too much, but at the end of the day, we keep ramming stuff into it.  I'm not sure the current balance is right.

Free textbooks?
"One possibility is to have the fixed costs of production paid by a foundation grant (I am looking at you, Bill Gates) and then make the digital book freely available. This is similar to the common suggestion that newspapers like The New York Times should move from for-profit to non-profit status and then be supported by charitable donors, much like National Public Radio. Yet I am skeptical that this reform would improve on the status quo of the textbook market. After all, the current for-profit educational publishers are not that profitable, and there is no reason to think that a non-profit entity would find cost savings that have eluded existing publishers. I am afraid that the only way to substantially cut costs would be to reduce quality, which would not be in the students’ interests."
OpenStax is an organization that makes digital books freely available for a wide range of college courses, including the Economics book in which I played a role. It is indeed  partly funded by the Gates Foundation.  Mankiw suggests that "free" books may have an undesirable quality tradeoff.

Quality is often in the eye (and the wallet) of the beholder. But the idea behind OpenStax is that a lot of intro books across a lot of subjects are pretty similar: say, think about the likely similarities between intro textbooks in algebra, statistics, accounting, chemistry, and physics.  If instructors for intro econ should be ambassadors representing the common wisdom, books which do this will have a lot of overlap, too. Personally, I prefer my textbook from Textbook Media to the revised, reworked, reorganized, and shortened version that became the OpenStax book. But other instructors may disagree, or may just feel that "free" is worth it.

The bigger quality tradeoff with free books is about the ancillary materials that accompany a book: banks of multiple choice questions that can be organized into quizzes and tests, with machine-scoring; problem sets; slides and videos for the classroom; animated graphics; text-to-audio for those who learn better by listening; structured economic markets and exercises that can be "played" by students, and then mined for underlying lessons; and more. Some ancillaries have been created for the OpenStax free books, but for-profit publishers invest a lot into these ancillaries, and into making sure they function together in a coordinated way. I suspect that that the quality tradeoffs between free and priced textbooks are mild, compared to the quality tradeoffs between ancillary materials for the books.

How Much Do You Like the Act of Writing and Revising?
"If you are thinking about writing a textbook, the most important question to ask yourself is: Do you enjoy the process of writing and revising (and revising and revising and…)? Not just tolerate it, but really enjoy it? ... I actually enjoy the triennial revisions of my textbooks, not only because they allow me to update my texts for the ever-changing world but also because they give me the chance to go through the manuscript and tinker some more. I can change `the curve is upward sloping' to “`he curve slopes upward,' saving one word and two syllables! If that edit does not strike you as a life-affirming victory, you are not a writer at heart."
This comment reminded me of a couple of others. One was from an economist friend of mine who had serious talks with a publisher about writing a textbook and walked right up to the edge of a sizeable advance payment--before deciding not to go through with it. He told me that in looking the reality of a textbook project in the face: "I discovered that there's a big difference between wanting to write a book and wanting to have written a book."

The other is to emphasize that for most of us, good expository writing involves a lot of rewriting. When someone says that the explanations in my textbook are smooth and fluent and easy-to-follow, I always think: "Well, after about the 6th or 10th revision, it became a lot more clear." I remember the advice of "John Kenneth Galbraith on Writing, Inspiration, and Simplicity" (August 25, 2015). Galbraith, who was one of the truly fine prose stylists in economics, wrote: 
"The best place to write is by yourself, because writing becomes an escape from the terrible boredom of your own personality. It's the reason that for years I've favored Switzerland, where I look at the telephone and yearn to hear it ring. ... There may be inspired writers for whom the first draft is just right. But anyone who is not certifiably a Milton had better assume that the first draft is a very primitive thing. The reason is simple: Writing is difficult work. Ralph Paine, who managed Fortune in my time, used to say that anyone who said writing was easy was either a bad writer or an unregenerate liar. Thinking, as Voltaire avowed, is also a very tedious thing which men—or women—will do anything to avoid. So all first drafts are deeply flawed by the need to combine composition with thought. Each later draft is less demanding in this regard. Hence the writing can be better."