Thursday, January 31, 2019

Winter 2019 Journal of Economic Perspectives Available Online

I was hired back in 1986 to be the Managing Editor for a new academic economics journal, at the time unnamed, but which soon launched as the Journal of Economic Perspectives. The JEP is published by the American Economic Association, which back in 2011 decided--to my delight--that it would be freely available on-line, from the current issue back to the first issue. Here, I'll start with the Table of Contents for the just-released Winter 2019 issue, which in the Taylor household is known as issue #127. Below that are abstracts and direct links for all of the papers. I may blog more specifically about some of the papers in the next week or two, as well.

___________________________________
Symposium on Women in Economics
"Women in Economics: Stalled Progress," by Shelly Lundberg and Jenna Stearns
Women are still a minority in the economics profession. By the mid-2000s, just under 35 percent of PhD students and 30 percent of assistant professors were female, and these numbers have remained roughly constant ever since. Over the past two decades, women's progress in academic economics has slowed, with virtually no improvement in the female share of junior faculty or graduate students in decades. Little consensus has emerged as to why, though there has been a renewal of widespread interest in the status and future of women in economics and of the barriers they face to professional success. In this paper, we first document trends in the gender composition of academic economists over the past 25 years, the extent to which these trends encompass the most elite departments, and how women's representation across fields of study within economics has changed. We then review the recent literature on other dimensions of women's relative position in the discipline, including research productivity and income, and assess evidence on the barriers that female economists face in publishing, promotion, and tenure. While differences in preferences and constraints may directly affect the relative productivity of men and women, productivity gaps do not fully explain the gender disparity in promotion rates in economics. Furthermore, the progress of women has stalled relative to that in other disciplines in the past two decades. We propose that differential assessment of men and women is one important factor in explaining this stalled progress, reflected in gendered institutional policies and apparent implicit bias in promotion and tenure processes.
Full-Text Access | Supplementary Materials


"Variation in Women's Success across PhD Programs in Economics," by Leah Boustan and Andrew Langan
We document wide and persistent variation in women's representation and success across graduate programs in economics. Using new data on early career outcomes for recent graduates, including first job placement, publications, and promotion, we rank (anonymized) departments on outcomes for women relative to men graduating from the same program. We then conduct interviews with faculty and former students from five programs with better and worse relative outcomes. We find that departments with better outcomes for women also hire more women faculty, facilitate advisor-student contact, provide collegial research seminars, and are notable for senior faculty with awareness of gender issues. We offer our qualitative evidence as the first step in learning about "what works" in expanding women's representation in economics.
Full-Text Access | Supplementary Materials

"Fixing the Leaky Pipeline: Strategies for Making Economics Work for Women at Every Stage," by
Kasey Buckles

While women comprise over half of all undergraduate students in the United States, they account for less than one-third of economics majors. From there, the proportion of women at each stage of the academic tenure track continues to decrease, creating a "leaky pipeline." In this paper, I provide a toolkit of interventions that could be implemented by individuals, organizations, or academic units who are working to attract and retain women students and faculty at each stage of this pipeline. I focus on smaller-scale, targeted interventions that have been evaluated in a way that allows for the credible estimation of causal effects.
Full-Text Access | Supplementary Materials

Symposium on Financial Stability Regulation
"Financial Regulation: Still Unsettled a Decade after the Crisis," by Daniel K. Tarullo
A decade after the darkest moments of the financial crisis, both the US financial system and the legal framework for its regulation are still in flux. The post-crisis regulatory framework has made systemically important banks much more resilient. They are substantially better capitalized and less dependent on runnable short-term funding. But the current regulatory framework does not deal effectively with threats to financial stability outside the perimeter of regulated banking organizations, notably from forms of shadow banking. Moreover, with the political tide having for the moment turned decisively toward deregulation, there is some question whether the resiliency improvements of the largest banks will be preserved. This article assesses the accomplishments, unfinished business, and outstanding issues in the post-crisis approach to prudential regulation.
Full-Text Access | Supplementary Materials


"Prone to Fail: The Pre-crisis Financial System," by Darrell Duffie
The financial crisis that began in 2007 was triggered by over-leveraged homeowners and a severe downturn in US housing markets. However, a reasonably well-supervised financial system would have been much more resilient to this and other types of severe shocks. Instead, the core of the financial system became a key channel of propagation and magnification of losses suffered in the housing market. Critical financial intermediaries failed, or were bailed out, or dramatically reduced their provision of liquidity and credit to the economy. In short, the core financial system ceased to perform its intended functions for the real economy at a reasonable level of effectiveness. As a result, the impact of the housing-market shock on the rest of the economy was much larger than necessary. In this essay, I will review the key sources of fragility in the core financial system. I discuss the weakly supervised balance sheets of the largest banks and investment banks; the run-prone designs and weak regulation of the markets for securities financing and over-the-counter derivatives; the undue reliance of regulators on market discipline; and the interplay of too-big-to-fail and the failure of market discipline. Finally, I point to some significant positive strides that have been made since the crisis: improvements in the capitalization of the largest financial institutions, a reduction of unsafe practices and infrastructure in the markets for securities financing and derivatives, and a significantly reduced presumption that the largest financial firms will be bailed out by taxpayer money in the future. But I will also mention some remaining challenges to financial stability that could be addressed with better regulation and market infrastructure.
Full-Text Access | Supplementary Materials

"Would Macroprudential Regulation Have Prevented the Last Crisis?" by David Aikman, Jonathan Bridges, Anil Kashyap and Caspar Siegert
How well equipped are today's macroprudential regimes to deal with a rerun of the factors that led to the global financial crisis? To address the factors that made the last crisis so severe, a macroprudential regulator would need to implement policies to tackle vulnerabilities from financial system leverage, fragile funding structures, and the build-up in household indebtedness. We specify and calibrate a package of policy interventions to address these vulnerabilities-policies that include implementing the countercyclical capital buffer, requiring that banks extend the maturity of their funding, and restricting mortgage lending at high loan-to-income multiples. We then assess how well placed are two prominent macroprudential regulators, set up since the crisis, to implement such a package. The US Financial Stability Oversight Council has not been designed to implement such measures and would therefore make little difference were we to experience a rerun of the factors that preceded the last crisis. A macroprudential regulator modeled on the UK's Financial Policy Committee stands a better chance because it has many of the necessary powers. But it too would face challenges associated with spotting build-ups in risk with sufficient prescience, acting sufficiently aggressively, and maintaining political backing for its actions.
Full-Text Access | Supplementary Materials

Symposium on Public Provision of Economic Data
"The Value of US Government Data to US Business Decisions," by Ellen Hughes-Cromwick and Julia Coronado
The US government is a major producer of economic and financial data, statistics, analysis, and forecasts that are gathered, compiled, and published as public goods for use by citizens, government agencies, researchers, nonprofits, and the business community. There is no market transaction in the publication and dissemination of these government data and therefore no market-determined value. The purpose of this paper is to outline and augment our understanding of the value of government data for business decision-making. We provide an overview of the topic, including results from government reports and a private sector survey. We then provide concrete examples of how these government data are used to make business decisions focusing on three sectors: automotive, energy, and financial services. Examples of new initiatives by the federal government to open access to more data, exploiting technology advances associated with the internet, cloud storage, and software applications, are discussed. With the significant growth in the digital economy, we also include discussion and insights around how digital platform companies utilize government data in conjunction with their privately generated data (or "big data") to foster more informed business decisions.
Full-Text Access | Supplementary Materials

"On the Controversies behind the Origins of the Federal Economic Statistics," by Hugh Rockoff
Our federal economic statistics originated in the economic and political divisions in the United States and the bitter debates over economic policy they engendered at the end of the 19th century and during the world wars and Great Depression. Workers were angry because they believed that they were being exploited by robber barons who were capturing all of the benefits of economic growth, while employers were just as sure that the second industrial revolution had brought workers an unparalleled increase in real wages. Other debates centered on the effects of unrestricted immigration on wages and employment opportunities of native-born Americans, on the effects of tariffs on prices paid by consumers, on the effects of frequent financial panics on employment, and, during the world wars, on the effects of wage and price controls on the living standards of workers. Participants on all sides of these debates believed that nonpolitical and accurate statistics constructed by experts would help to win support for the policies they favored. In most cases, the development of these statistics was led by individuals, private organizations, and state governments, although the federal government eventually took over the role of producing these statistics on a regular basis. Here I provide brief histories of the origins of US statistics on prices, national income and product, and unemployment to illustrate this story.
Full-Text Access | Supplementary Materials

"Evolving Measurement for an Evolving Economy: Thoughts on 21st Century US Economic Statistics," by Ron S. Jarmin
The system of federal economic statistics developed in the 20th century has served the country well, but the current methods for collecting and disseminating these data products are unsustainable. These statistics are heavily reliant on sample surveys. Recently, however, response rates for both household and business surveys have declined, increasing costs and threatening quality. Existing statistical measures, many developed decades ago, may also miss important aspects of our rapidly evolving economy; moreover, they may not be sufficiently accurate, timely, or granular to meet the increasingly complex needs of data users. Meanwhile, the rapid proliferation of online data and more powerful computation make privacy and confidentiality protections more challenging. There is broad agreement on the need to transform government statistical agencies from the 20th century survey-centric model to a 21st century model that blends structured survey data with administrative and unstructured alternative digital data sources. In this essay, I describe some work underway that hints at what 21st century official economic measurement will look like and offer some preliminary comments on what is needed to get there.
Full-Text Access | Supplementary Materials

Articles

"Environmental Justice: The Economics of Race, Place, and Pollution," by Spencer Banzhaf, Lala Ma and Christopher Timmins
The grassroots movement that placed environmental justice issues on the national stage around 1980 was soon followed up by research documenting the correlation between pollution and race and poverty. This work has established inequitable exposure to nuisances as a stylized fact of social science. In this paper, we review the environmental justice literature, especially where it intersects with work by economists. First we consider the literature documenting evidence of disproportionate exposure. We particularly consider the implications of modeling choices about spatial relationships between polluters and residents, and about conditioning variables. Next, we evaluate the theory and evidence for four possible mechanisms that may lie behind the patterns seen: disproportionate siting on the firm side, "coming to the nuisance" on the household side, market-like coordination of the two, and discriminatory politics and/or enforcement. We argue that further research is needed to understand how much weight to give each mechanism. Finally, we discuss some policy options.
Full-Text Access | Supplementary Materials

"Economists (and Economics) in Tech Companies." by Susan Athey and Michael Luca
As technology platforms have created new markets and new ways of acquiring information, economists have come to play an increasingly central role in tech companies-tackling problems such as platform design, strategy, pricing, and policy. Over the past five years, hundreds of PhD economists have accepted positions in the technology sector. In this paper, we explore the skills that PhD economists apply in tech companies, the companies that hire them, the types of problems that economists are currently working on, and the areas of academic research that have emerged in relation to these problems.
Full-Text Access | Supplementary Materials


"Parag Pathak: Winner of the 2018 Clark Medal." by Ariel Pakes and Joel Sobel
The American Economic Association awarded Parag Pathak the 2018 John Bates Clark Medal for his research on the impacts of educational policies. Both the theory and the empirical research take the constraints facing administrators seriously. As a result, Parag's research led directly to educational reforms in many large US cities and abroad. The leading example is Parag (and co-authors') research on school assignment mechanisms that led many school districts to institute fairer and more efficient procedures for allocating students to schools. The institutional detail Parag learned in working on the assignment problem led to innovative empirical work on the impacts of different types of schools, most notably of charters, which was suggestive of the characteristics of both successful schools and of the types of students who gained from being enrolled in them. Using the data generated by the new assignment rules, his recent work provides complete frameworks for the quantitative analysis of the benefits of different assignment mechanisms and has measured those benefits in New York high schools.
Full-Text Access | Supplementary Materials

"Recommendations for Further Reading," by Timothy Taylor
Full-Text Access | Supplementary Materials

Tuesday, January 29, 2019

Do We Even Know If the Gig Economy Is Growing?

The concept of the "gig economy" clearly captures something real, but it can be hard to measure define in the statistical sense that brings joy to my heart. For example, it clearly refers to those who drive for Uber and Lyft. But does it refer more broadly to all workers with "alternative work arrangements," who are hired for a short-term job with no serious expectation that it will become a longer-term employment connection? Does it cover people who obtain jobs through a temp agency and work for a series of employers, for example?

Conventional labor statistics don't draw these kinds of distinctions very clearly, so researchers have looked for clues in less traditional kinds of data. The results are less clear-cut than one might like.

For example, back in 2015 two prominent labor economists, Lawrence Katz and Alan Krueger, noted that the usual tool for the U.S. Bureau of Labor Statistics in looking at alternative and nonstandards work arrangements is called the Contingent Work Survey (CWS). But this survey has only been carried out occasionally, and in fact had not been done since 2005. So Katz and Krueger tried to carry out a survey in Fall 2015, attaching the questions to a nationally representative survey regularly done by the RAND think-tanks called the American Life Panel.

The results were striking. As I noted at the time, they found:
[T]he percentage of workers engaged in alternative work arrangements – defined as temporary help agency workers, on-call workers, contract company workers, and independent contractors or freelancers – rose from 10.1 percent in February 2005 to 15.8 percent in late 2015. ... We further find that about 0.5 percent of workers indicate that they are working through an online intermediary, such as Uber or Task Rabbit ... Thus, the online gig workforce is relatively small compared to other forms of alternative work arrangements, although it is growing very rapidly  ... A striking implication of these estimates is that all of the net employment growth in the U.S. economy from 2005 to 2015 appears to have occurred in alternative work arrangements.
Well, Katz and Krueger have now revisited the subject four years later, and their latest reuslts suggest that the number of workers in alternative jobs actually has not been growing at all. The more recent paper is "Understanding Trends in Alternative Work Arrangements in the United States," published as a working paper from the National Bureau of Economic Research (#25425, January 2019, an ungated version is here).

The Bureau of Labor Statistics did get funding to do a follow-up of the official Contingent Workers Survey in May 2017. They write: "The ... findings were released in June 2018 and indicate, in seeming contrast to our earlier findings ... a slight decline in the incidence in alternative work arrangements from 10.7 percent in 2005 to 10.1 percent in 2017 ..."

 What's going on here? Part of the answer seems to be that the labor market was improving from 2015 to 2017, and so more people moved into traditional jobs. Other differences have to do with the extent to which surveys were answered by workers directly, or by others in the family, and whether the 2015 survey for some reason ended up with an oversample of people holding multiple jobs. But bottom line, the current view is that the number of alternative workers may have risen during the Great Recession and its aftermath, but has since declined back to about where it was before the recession.

Anat Bracha and Mary A. Burke provide some additional perspective in "The Ups and Downs of the Gig Economy, 2015–2017," written as a working paper for the Federal Reserve Bank of Boston (#18-12, October 2018).

The particular focus on Bracha and Burke is on data from the Survey of Informal Work Participation (SIWP), which was carried out as part of something called the Survey of Consumer Expectations, which is done on a monthly basis by the Federal Reserve Bank of New York. They added questions about the extent of "paid informal work or side jobs," and whether "websites and/or mobile platforms were used in finding and/or performing such work." The survey was not really intended to include professional freelancers or temp workers, but as with any survey, it's not always obvious how respondents interpret the questions. They find:
Considering either our broader or narrower concept of informal work, we find that participation rates did not change significantly on net between 2015 and 2017, while our point estimates suggest that if anything, the participation rates declined during that period. ... Furthermore, conditional on participation in the gig economy, between 2015 and 2017 the average hours among informal workers showed unambiguous declines, and the aggregate amount of informal work as measured in FTEs also fell substantially, while average earnings among informal workers were effectively flat. Our composite measures of informal work would appear to contradict recent popular narratives depicting rapid growth in the independent workforce in response to structural changes in the organization of work. However, we also find some supporting evidence for the story of a rising gig economy ...[P]articipation rates increased across our surveys for selected technology-enabled jobs such as ridesharing and online tasks, and the average ridesharing hours increased dramatically among drivers, although in absolute terms these technology-enabled jobs still account for only a very small segment of the US population of household heads.
In more detailed analysis, they also find hints that the improving labor market from 2015-2017 was tending to  hold down the amount of informal work. But their bottom line is that while ride-sharing is way up, along with AirBnB and various non-labor income-earning opportunities, overall informal work is not on the rise.

Other authors have also found evidence that while participation in ride-sharing jobs is way up, the evidence for more employment in other parts of the gig economy is weak. For example, Katharine G. Abraham, John C. Haltiwanger, Kristin Sandusky James R. Spletzer presented "The Rise of the Gig Economy:Fact or Fiction?" at the annual meetings of the American Economic Association in early January 2019. They point out that some of the main possible data sources on gig economy work are not telling the same story: specifically, the surveys of workers form sources like the Current Population Survey aren't telling the same story as income tax data about self-employment. They write:
This paper provides an overview of what we know and don’t know about the hypothesized surge in the gig economy. There has been phenomenal growth, confirmed by at least three independent data sources, in the number of self-employed passenger drivers since 2013. The pace of this growth illustrates how quickly new technology can affect the labor market. Outside of this sector, however, the picture is considerably murkier. Furthermore, ... there has been a growing discrepancy between self-employment rates as measured in core household surveys such as the Current Population Survey (CPS) versus self-employment rates as measured in tax data. Over the past decade, the former show a slight decline whereas the latter show a notable increase. CPS data also have not captured the surge in passenger driver self-employment that is evident in other data. These facts suggest that, to understand the gig economy, the CPS and other core household surveys will need to be augmented by other types of data
Bracha and Burke from the Boston Fed make a similar point about data on alternative work arrangements from self-employment reported on income taxes. They write:
According to a few different studies, the filing of tax forms indicating self-employment, such as the Schedule C, increased significantly in recent decades (Jackson, Looney, and Ramnath 2017, Katz and Krueger 2016, and Abraham et al. 2018), and one study found that the trends were driven by an increase in independent labor rather than business ownership (Jackson, Looney, and Ramnath 2017). Likewise, an analysis by Dourado and Koopman (2015) of 1099-MISC forms, which are used to report income received outside of traditional employment relationships, indicates an escalation in such filings from 2000 to 2015.
One of the prominent studies of what tax data can tell us on the extent of self-employment is "The Rise of Alternative Work Arrangements: Evidence andImplications for Tax Filing and Benefit Coverage," by Emilie Jackson, Adam Looney, and Shanthi Ramnath written as a working paper for the Office of Tax Analysis at the US Department of the Treasury (#114, January 2017). They note that the category of self-employment is quite broad. However, it is also rising fast, and many of the gains in self-employment seem to be among those who have zero in business expenses--that is, they are just providing labor. They write (footnotes omitted):
In 2014, 24.9 million individuals filed returns reporting the operation of a nonfarm sole proprietorship and 16.8 million earned a profit (and paid self-employment tax) from those activities, representing a 34 percent and 32 percent increase, respectively, from their levels in 2001. The almost 17 million self-employed workers represented 12 percent of all tax filers with earnings. ... Self-employed individuals engage in a wide variety of economic activities ranging from operating businesses like restaurants, law offices, or partnerships; providing contract or consulting labor; earning platform-based or “gig economy” income; to house cleaning and babysitting services. Many earn income from both wages and self-employment. ... Looking at trends over time, we find that essentially all of the increase in self-employment is due to increases in sole proprietors who have little or no business-related deductions, and who therefore appear to almost exclusively provide labor services (i.e. the contractors or misclassified workers). In contrast, the share of filers that were small business owners was essentially unchanged.
It seems clear that more people are receiving income and tax from activities that are outside traditional jobs. But other than ride-sharing jobs, just how to characterize these jobs remains murky, and the question of what rules and regulations might apply to such income-earning activities remains murky, too.  It feels to me as if a shift is happening in US labor markets, in which the expectation of a long-term bond between employers and employees has declined on both sides. But I don't yet feel that I understand the details of this shift.

Monday, January 28, 2019

Budget Deficits and Debt: Background and Tradeoffs

Twice a year the Congressional Budget Office publishes a "just the facts" overview of the federal budget picture and the US economy. The latest version is "The Budget andEconomic Outlook:2019 to 2029 (January 2019). Here, I'll focus on the US budget deficit and debt.

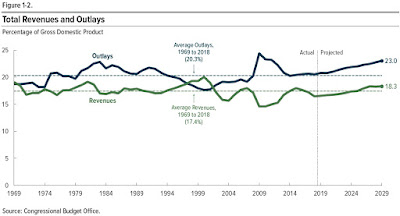
Here's the pattern of US federal government spending and revenues in the last 50 years. Average outlays during that time were 20.7% of GDP. Average revenues were 17.4% of GDP. Contrary to the widespread belief that US government spending and taxes have over time surged ever higher, to me the more obvious pattern here over the half-century is one of stability. Sure, government spending is higher and taxes are lower than the historical averages during the Great Recession. But during boom times like the late 1990s, taxes are above their historical average while spending is below. When President Trump took office early in 2017, US government spending and taxes were--whether for better or worse--almost bang on their long-run averages.

But under the surface, two changes are going on--one medium-term and one longer-term. The medium-term change is that the usual pattern over time has been that when the US economy is proceeding strongly, with sustained growth and a relatively low unemployment rate, the budget deficits are usually lower, or in the late 1990s even turned into surpluses. But at present, the trajectory is a relatively healthy economy but with larger-than-usual budget deficits.

This CBO figures shows that if one looks back at years when the unemployment rate was below 6%, the average budget deficit has been 1.5% of GDP. But although the current unemployment rate has been substantially below 6% for several years, the projected budget deficits for the next decade are projected at 4.4% of GDP.
The longer-term issue involves the rising share of government spending that is going to support benefits for the elderly. Here's an illustrative figure from the CBO on the share of federal (non-interest) spending going to the elderly. Specifically, federal spending on the elderly was 35% of total in 2005, 40% of the total by 2018, and headed for 50% of the total 2029.
The tradeoffs here are a matter of basic arithmetic. If federal spending on the elderly keeps rising, but but there is a goal of keeping total federal spending at about the same level, then other federal spending needs to be slashed. Indeed, overall federal investment has been dropping over time: less for support of R&D, less for infrastructure, less for support of training and employment.  It used to be a half-century ago, that the federal government spent more on investment than on the broad category of paying benefits, but the nature of the federal government has shifted substantially, and over time it has become primarily about paying benefits. As the figure shows, we are rapidly headed toward a situation in which half of all (non-interest) federal spending involves payments of benefits just to the elderly--not even counting benefits paid to those under age 65.

The figure above, showing overall patterns of spending and revenue, show the outcome. Spending keeps rising, driven in the medium-run by the rise in spending on the elderly. Despite the sustained economic growth and low unemployment rate, federal taxes dipped in the last year and will stay relatively low for a situation where the economy is doing fairly well, in substantial part because of the Tax Cuts and Jobs Act passed in December 2017. As this combination of spending and taxes leads to higher budget deficits, more government debt accumulates, and interest payments start climbing, too. For example, the CBO projections show that "net interest" is 1.6% of GDP in 2018, but rises to 2.6% of GDP by 2023.

Don't skip over that rise in interest payments too quickly. The US GDP is about $20 trillion in 2018. So 1% of GDP amounts to $200 billion which is being spent as a price paid for past borrowing--and thus won't be available for spending increases or tax cuts.

Combine these factors, and the US ratio of debt/GDP is headed out of its historical range. There have been spikes in the debt/GDP ratio before, notably in times of war, or during the large budget deficits during the Reagan presidency in the 1980s. But according to the CBO, using current law as its baseline, we are headed well outside those limits in the next couple of decades.
Presumably the answers involve restraints on spending programs for those over-65 or raising additional tax revenue. Those steps need to be phased in energetically even if the only goal is to get off the pathway of an extreme debt/GDP rise. In addition, if you would like to see the pendulum swing back at least a bit--so that the federal government can again take up its role of investing in R&D, infrastructure, and workers--then even greater changes are needed.

This pattern of a rising debt/GDP ratio raises a number of economic concerns. As the CBO report summarizes:
Such high and rising debt would have significant negative consequences, both for the economy and for the federal budget, including these:
  • As interest rates continue to rise toward more typical levels, federal spending on interest payments would increase substantially;
  • Because federal borrowing reduces national saving over time, the nation’s capital stock ultimately would be smaller, and productivity and total wages would be lower than would be the case if the debt was smaller;
  • Lawmakers would have less flexibility than otherwise to use tax and spending policies to respond to unexpected challenges; and
  • The likelihood of a fiscal crisis in the United States would increase. Specifically, the risk would rise of investors’ being unwilling to finance the government’s borrowing unless they were compensated with very high interest rates. If that occurred, interest rates on federal debt would rise suddenly and sharply relative to rates of return on other assets.
As I have said before, I am not someone who argues for sharp immediate reductions in budget deficits. But the long-term trajectory is troubling. And the undebated and de facto shift of the federal government to an institution where the main budgetary action is sending out payments, rather than making investments in the country's future, troubles me as well. 


Thursday, January 24, 2019

Mexico Misallocated

Economic growth in Mexico presents a puzzle. Mexico has followed many of the standard recommendations that are said to support economic growth. For example, it has prevented a recurrence of the inflationary fevers that used to grip Mexico every few years. Rates of national investment are up. Investment in education and human capital is up. Mexican workers have a  high labor force participation rate. Mexico has signed international agreements to reduce trade barriers. It has done a reasonable amount of privatization and deregulation And the result of all these changes has been slow growth.

 Santiago Levy describes this puzzle and offers his own answer in Under-Rewarded Efforts: The Elusive Quest for Prosperity in Mexico, published by the Inter-American Development Bank (July 2018). Here's Levy on Mexico's sluggish growth, which actually implies a negative rate of productivity growth in recent decades.
From 1996 to 2015, the country’s per capita GDP growth averaged only 1.2 percent per year. Moreover, this unimpressive figure arguably overestimates Mexico’s performance, as it reflects the fact that because of the country’s demographic transition, its labor force grew more rapidly than its population during these years (2.2 versus. 1.4 percent). In fact, GDP per worker grew on average by only 0.4 percent on an annual basis, far from what is required to create a prosperous country. ... 
Over the same two decades, accumulated per capita GDP growth in Mexico was 25.7 percent, less than every country in Latin America except Venezuela. ...Over the medium term, growth occurs because the labor force increases (in quantity and quality), because there is more investment in physical capital, and because the productivity of labor and capital (total factor productivity – TFP) increases. Decomposing Mexico’s growth over this period into these three components, one finds that TFP growth averaged only 0.14 percent annually, without any corrections for the quality of the labor force. Considering increases in schooling (that is, taking into account that workers with more years of schooling can potentially contribute more to output than those with fewer years), yields a negative TFP growth rate of 0.53 percent. ... [T]he result is that Mexico’s GDP growth has resulted only from the accumulation of physical capital and growth of the labor force. There have been no improvements in efficiency. Thus, by and large the question of why Mexico grows so slowly is equivalent to the question of why productivity has stagnated.
 Why has Mexico's productivity growth been so poor? Levy looks for clues in data on the productivity of Mexico's firms. In a healthy and growing economy, one expects that average productivity of firms will rise. As part of that process, one expects that firms with higher productivity levels will tend to succeed and expand, while firms with lower productivity will either move to higher productivity, or they will contract and even sometimes go out of business. 

Levy provides data that this expected process isn't happening. In looking at data on firms in Mexico, For example, he points out that in Mexico in 2013 census data, informal firms were 90 percent of the total, "absorbed more than 40 percent of the capital stock and 55 percent of employment," and "constituted the majority in 51 percent of all six-digit sectors in manufacturing, 81 percent in commerce, and 88 percent in services." Levy writes: 
The comparison of the four censuses [from 1998 to 2013]  shows that, contrary to what one would expect, the composition of economic activity shifted over time towards the informal sector, measured by the number of firms, the number of six-digit sectors where these firms are a majority, and the share of capital and labor absorbed by them. In parallel, the average size of formal firms increased, and they became more capital-intensive, but the average size of informal firms fell. The net result of all these trends was a fall in average firm size, and larger differences in capital intensity between formal and informal firms, within informal firms, and across firm sizes. In other words, heterogeneity increased across firm sizes and types. ... 
"[L]arge differences in firm productivity inside each six-digit sector ... widened over this 15-year period. There were more high-productivity firms in 2013 than in 1998. This is welcome news: a subset of Mexican firms over the last two decades have performed very well, which supports the image of a productive Mexico successfully competing in the international arena. But this is not the whole story. There were also more low-productivity firms in 2013 than in 1998. And the unwelcome news is that those firms attracted even more resources than the high-productivity ones. This result
serves to make a key point: simply noting that over time there are more high-productivity firms, and that these firms are growing, is not enough to claim that things are moving in the right direction. One must also consider the left-tail of the productivity distribution, and when this is done, one finds the image of an unproductive Mexico, lagging other regions of the world. ... 
But the main finding, very worrisome to Mexico, is that this large firm churning failed to increase productivity. There are three inter-related problems:
  • The exit process does not distinguish sufficiently between high- and low-productivity firms, so many low-productivity firms survive, and many high-productivity ones die.
  • There is little sorting of entering firms by productivity levels, so many low-productivity firms enter.
  • There is a bias in favor of the entry of new firms and against the growth of existing firms, even if the latter have higher productivity. ... 
What about firms that survived? Many changed size and type between 2008 and 2013. Surprisingly, changes from informal to formal status were almost equally offset by changes in the opposite direction. In parallel, more firms became smaller than larger. This suggests that, in the case of Mexico, the view that informal firms that survive in the market grow and formalize is mostly flawed. ... [S]urviving firms did not create any additional jobs—in fact, their employment fell. Instead, these firms grew by capital deepening. ... 
It is as if in Mexico the Schumpeterian process of creative destruction was countered by a parallel process of destructive creation. A vicious circle is present: misallocation induces dysfunctional firm dynamics, and dysfunctional firm dynamics serve to reproduce misallocation from one year to the next. As a result, on balance, the allocation of capital resulting from new investments, and the allocation of labor resulting from growth in the labor force, fail to increase aggregate productivity. ...
In a broad sense, these patterns suggest that Mexico is misallocating its economic resources. The interaction of competing firms in Mexico is not directing resources to areas of highest productivity and skill. Research into how long-lasting misallocations of resources can occur and persist are a lively current topis in economics. For an overview, see the article by Diego Restuccia and Richard Rogerson, "The Causes and Costs of Misallocation." in the Summer 2017 issue of the Journal of Economic Perspectives

This process of what Levy calls "destructive" creation," with high-productivity firms exiting and low-prioductivtiy firms entering, isn't good for workers:
The other side of the coin of large firm churning is large firm-induced job changes—as firms exit and enter, workers transit from job to job. ... [T]he exit of high-productivity firms caused the loss of high-productivity jobs, and the entry of low-productivity firms implied the creation of low-productivity jobs. As noted, no net jobs were created in surviving firms because these firms grew mostly by capital deepening. All in all, the census data reveal that between 2008 and 2013 job changes associated with firm churning were almost equally balanced between productivity-reducing and productivity- enhancing ones. Useless firm churning translated into useless job changes.
[T]o the extent that the incentives to invest in education depend on the returns that are obtained from doing so, and given that misallocation lowers these returns, Mexican workers invest less in education prior to entering the labor force. This has long-term implications for the stock of human capital available to the country. ... [I]n the last two decades the returns to education in Mexico fell. ... {T]he returns to experience in Mexico are not only lower than in other countries of the OECD, but also  wer than in Chile and Brazil, the other two Latin American countries with comparable data. In addition, ... the returns to experience fell between 2005 and 2015. The implication of this trend is powerful: given whatever education workers acquired while young, their earnings paths once they entered the labor market were basically flat over that decade. Put differently, the returns to their experience were nil. The combination of falling returns to education and falling returns to experience is very disconcerting.

Moreover, Levy argues that the extent of misallocation appears to be rising in Mexico.  What factors might cause this misallocation of resources to arise and to persist? He argues that "the main policies and institutions impeding growth are those related to taxation, labor and social insurance regulations, and enforcement of contracts." The book goes into considerable detail on many related issues: laws about salaried and unsalaried workers differ, both in provision of social insurance and in the ability of firms to fire workers; how workers are taxed differently based on their labor contract and firms are taxed differently based on their size; and how law and institutions "determine the trust that agents (banks, firms, workers) place in the institutions enforcing contracts, and the degree of competition in product markets." Here's a sample: 
In other countries, the distinction between salaried and non-salaried contracts is probably innocuous. But in Mexico it is central because, following constitutional mandates, since the middle of the past century many of Mexico’s policies and institutions have been designed specifically for salaried workers, with obligations imposed on firms only when they hire salaried workers. Among these are the obligations to pay for workers’ social insurance, to comply with dismissal regulations, and to withhold workers’ income taxes. In parallel, other policies have been designed for non-salaried workers, with different obligations on firms. Among these are the provision of free social insurance benefits, and the exemption of firms from dismissal regulations and withholding obligations. As a result, laws with respect to labor taxes, pensions, health, day care, housing, and separation from employment differ depending on the nature of the contract between firms and workers. In parallel, the institutions in charge of enforcing obligations or providing benefits to salaried and nonsalaried workers also differ. ...
Here's one summation of his argument from Levy: 
After the lost decade of the 1980s, Mexico embarked on a program to restore growth focused on macroeconomic stability, an open trade regime, investments in human capital, promotion of domestic competition, and sector-specific reforms to increase efficiency. This program was accompanied by a substantive expansion of social spending ...  [T]he main achievements under this program ... [were]  most of them very welcome, and some very impressive. 
On the other  hand ... this program was unable to deliver growth with social inclusion. The combination of tax, social insurance, and labor regulations deployed to increase social welfare taxed the high-productivity segment of the economy and subsidized the low-productivity segment, impeding productivity growth and thwarting rapid GDP growth. It also failed to provide workers with satisfactory levels of protection and efficient coverage against risks, while limiting their opportunities to get better paid jobs congruent with their increased schooling. Thus, over a quarter of a century later, it is not possible to assert that this program delivered the prosperity expected from it.
This does not mean that this program should be abandoned. In fact, most of its components were right on the mark, and need to be consistently pursued. But it does mean that, with the benefit of hindsight, this program had an Achilles’ heel: it did not address the main reasons for large and persistent misallocation, and in fact exacerbated some of them. And, looking forward, it implies that continuing to pursue only this program will not address this shortcoming, and that prosperity will continue to elude Mexico. ... It is difficult for inclusive growth to occur under exclusive and malfunctioning institutions.
Levy's argument about misallocation of resources in Mexico has a number of intriguing implications. 

1) The causes of economic growth matter. When thinking about the "fundamentals" of economic growth, it's not enough to focus on investment in physical and human capital, a stable macroeconomic environment, and participation in the global economy. The ways in which laws and institutions affect the allocation of resources in an economy can also matter. 

2) Mexico's economy matters. For example, If you are worried about immigration from Mexico, immigration that arrives through Mexico, the strength and the opportunities in Mexico's economy are one of the main factors affecting how many people will want to emigrate from Mexico. 

3) Mexico is a (vivid) example of a country that has drawn legal and regulatory distinctions between salaried and unsalaried workers, and between smaller and larger firms. But in the US and around the world, technology is enabling the possibility of a shift to "gig economy" of alternative work arrangements and how firms organize themselves. In thinking about possible laws will affect treatment of these alternative workers, and the firms that hire them, and the provision of social insurance to these workers, it will be important also to consider the incentives that are being set up for how markets will reward productivity and skills--or not.

Wednesday, January 23, 2019

A Plan to Fix Social Security

Some hard questions defy easy answers. What is the meaning of life? What happens right at the event horizon of a black hole? How can the US substantially reduce health care spending? But for other questions, the answers are fairly clear, and what is lacking is a willingness to choose. Fixing Social Security falls into this category. As I have argued from time to time in the past, the actuaries at Social Security regularly publish a list of possible tax increases and benefit cuts, and its not hard to put together a package that fixes Social Security. I sometimes say that if we locked a group of 100 randomly chosen people in a room, and said they couldn't leave until they had a two-thirds majority for a plan to fix Social Security, they could be out in time for lunch. 

William G. Gale offers his preferred plan in "How Can We Save Social Security?" which appears in the January 2019 issue of  the Milken Institute Review (pp. 36-51). Gale sketches the history and structure of the program, and points out the basic issues. Social Security is financed with payroll taxes. It was going run out of money back in the early 1980s, but a set of reforms at that time combined higher taxes with benefits cuts like a later retirement age and made the system solvent into the 2030s. Part of the reform was to build up surpluses in the Social Security trust fund. But now those past surpluses are being drawn down, and the 2030s are now hovering on the horizon. Gale writes:
"With reserves that accumulated in previous years to supplement annual payroll taxes, Social Security can cover all of the benefits that workers claim through 2034. After that, the reserves will be used up and projected revenues will only cover about three-quarters of the benefits to which workers are legally entitled. Some combination of higher payroll taxes, lower benefits and new revenue sources will be needed to balance the books."

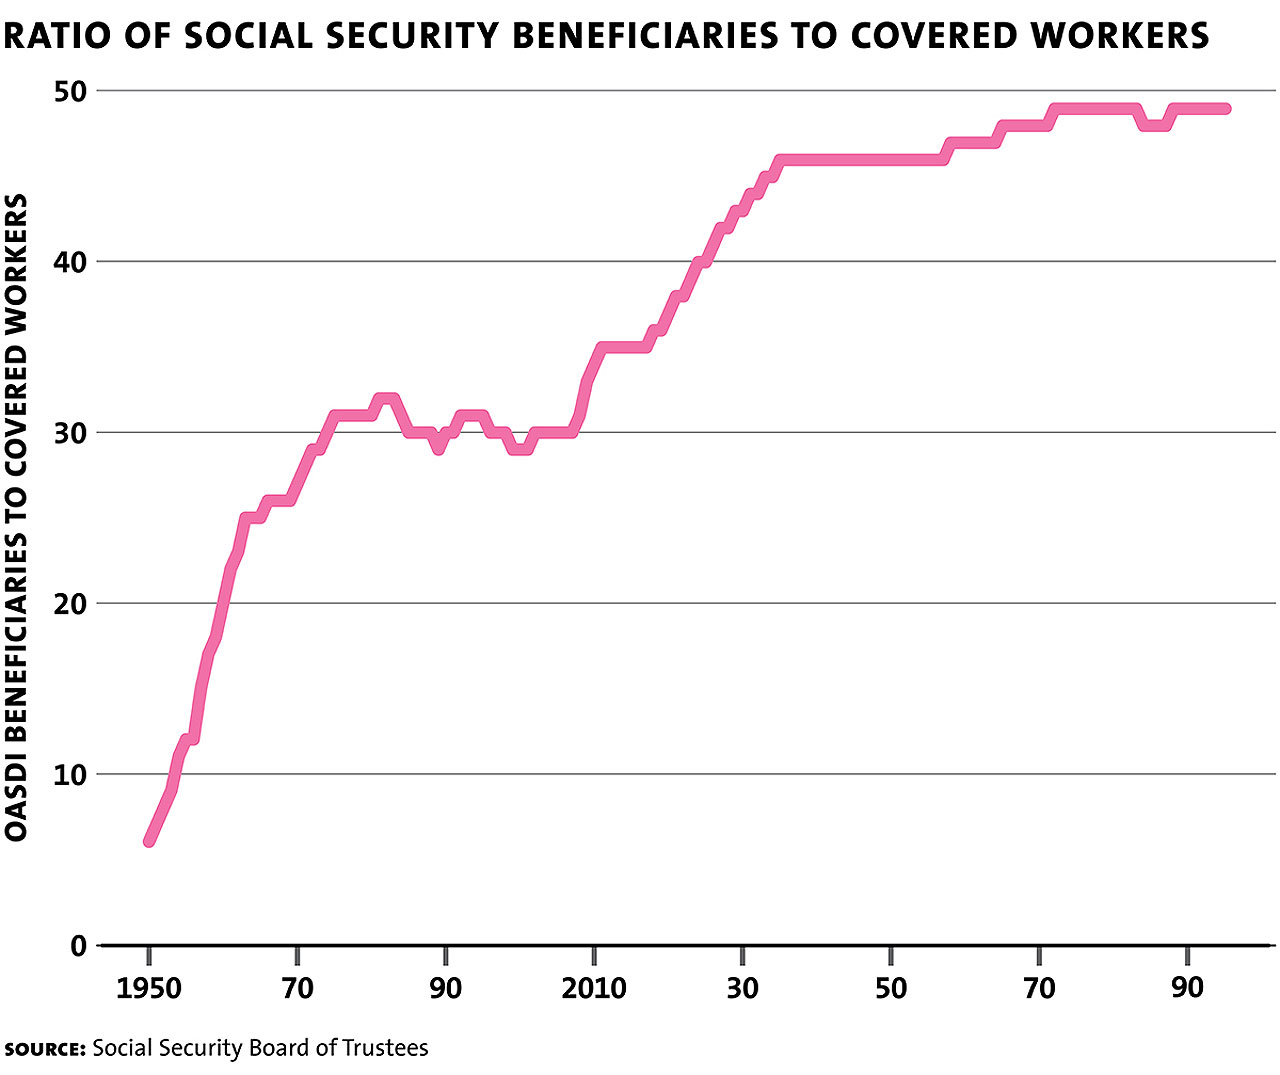
A couple of figures may help to illustrate the underlying problem. The front end of the "baby boom" generation, born from 1946 up through the early 1960s, started hitting retirement age in 2010. Life expectancies are up. From about 1970 to 2010, there were about 30% as many beneficiaries as workers contributing to the system; but by 2030, there will be 45% as many beneficiaries as workers. To put it another way, the ratio of payroll tax contributors to beneficiaries was about 3:1, and it's heading for close to 2:1.

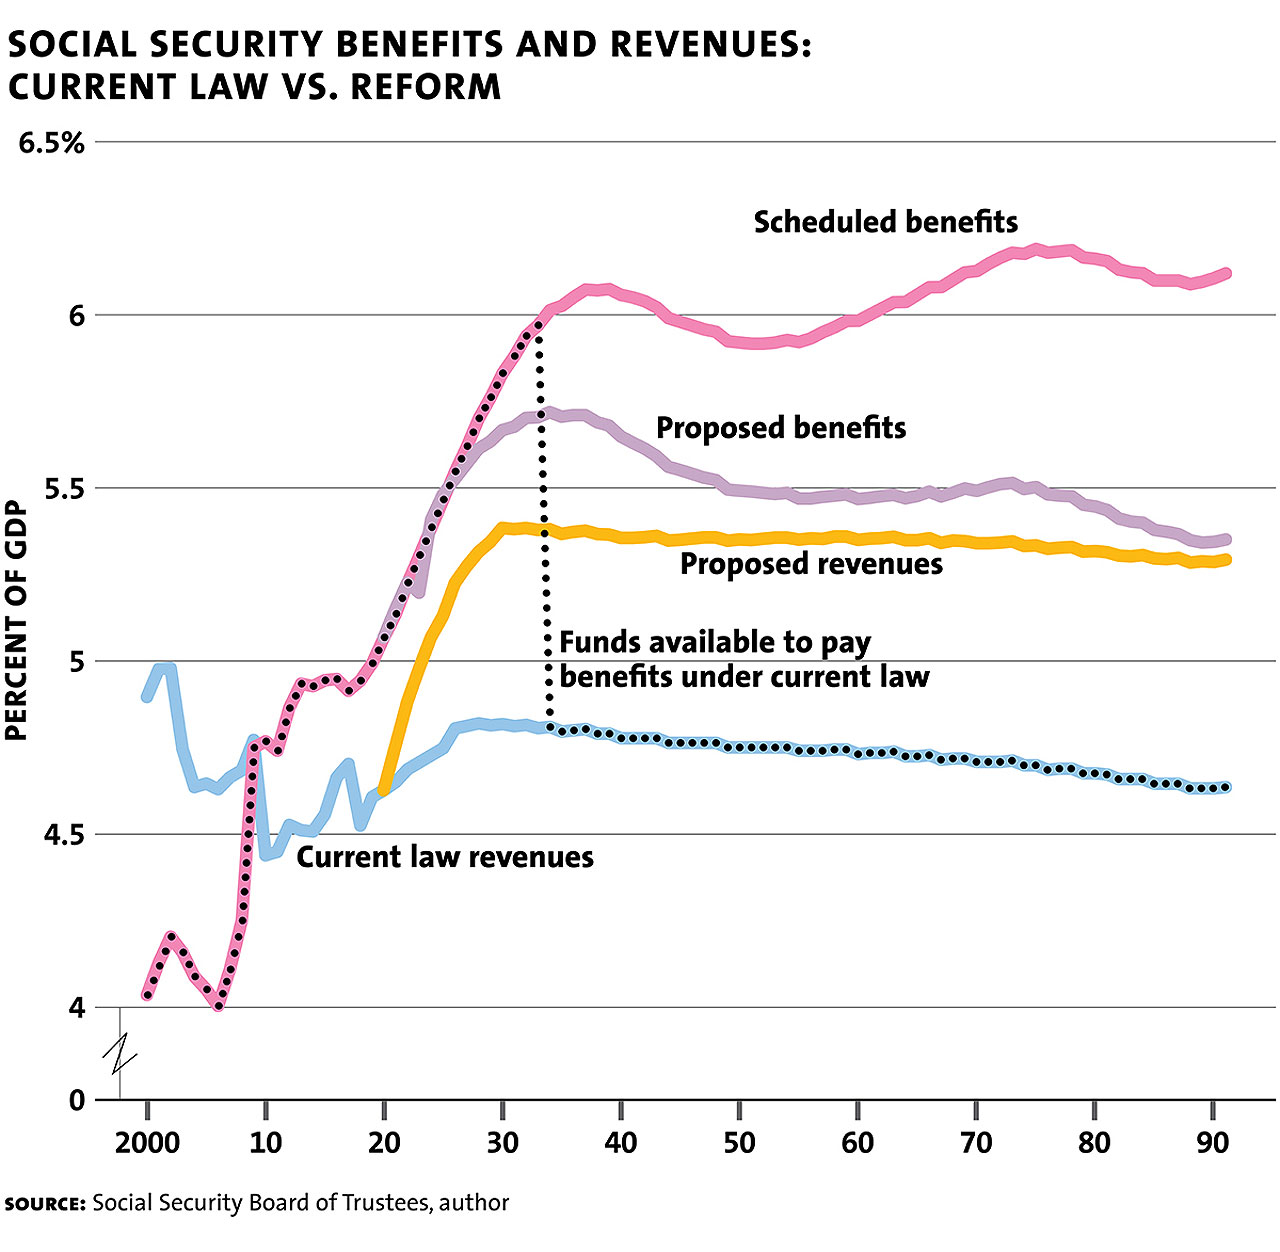
Looking at the path of spending and revenues in Social Security shows the result. Back in 2000, revenues into the system exceeded outflows, which is the period when the trust fund is being built up. But back around 2010, the lines cross, so outflows exceed revenues and the trust fund is being depleted. In 2034, as shown by the vertical dashed line, the trust fund runs out. The figures shows scheduled benefits and revenues, and it also shows Gale's proposed plan for getting them to meet. 
I should note that Gale's plan is, as he notes, actually from a report by the Bipartisan Policy Center, Securing Our Financial Future: Report of the Commission on Retirement Security and Personal Savings, published in June 2016. The five main ingredients include:
Raise the Payroll Tax Cap
In 1977, the payroll tax cap was set at 90 percent of wages in the economy and was indexed to grow in tandem with average wages. Since then, however, average wages have grown only modestly while the wages of high-earners have charged ahead. Consequently, by 2016, Social Security taxes covered only 83 percent of total wages. Under the commission’s proposal, the taxable earnings cap would be raised to cover 86 percent of wages by the end of 2024. Thereafter, the cap would be indexed to the growth in average wages, plus half a percentage point annually. ...
Tax More of the Benefits of High-Income Households

Currently, people with incomes above $25,000 if single ($32,000 if married) owe income taxes on a portion of their Social Security benefits, with the taxable share peaking at 85 percent. The commission proposes to tax high-income households (singles with income above $250,000 and married couples with income above $500,000) on 100 percent of their benefits. ...

Raise the Payroll Tax Rate
The commission would lift the payroll tax rate by 0.1 percentage points each year for the next decade, peaking at 13.4 percent. That is, employees and employers would each eventually pay 6.7 percent of wages below the taxable cap, up from 6.2 percent today. ...
Raise the Full Retirement Age 
The package would increase the full retirement age by one month every two years starting in 2027, until it reaches 69. The rationale is simple: people are living longer. For example, 20-year-olds in 2014 were expected to live to age 80, while 20-year-olds in 1950 were expected to live to just age 71. ,,, [A]s we raise the full retirement age, we should not raise the age (now 62) at which retirees can begin receiving early benefits. Increasing the early retirement age would disproportionally hurt those who find it especially hard to work past age 62 — notably, manual laborers with minor age-related disabilities.
Protect Low-Income Beneficiaries and Make Benefits More Progressive
Because low-income workers would experience benefit cuts resulting from a higher retirement age, the commission’s reforms include several provisions to offset the impact. First, it would make the annual benefit formula more progressive ... Second, it would raise minimum benefits. A single person with a monthly benefit of $500 today would get an increase to $784. The boost would decline as benefits rise, and it would disappear once benefits for a single retiree reached about $900 per month ($1,360 for couples).
For some years, I've thought that fixing Social Security offers the possibility of a big political win for the party that is willing to take the task seriously. The program is very popular, and provides income to about 60 million mostly elderly and disabled Americans. Democrats could have proposed a serious plan in the time window of 2009-2010, when they controlled Congress, and Republicans could have proposed a serious plan from 2016-2018, when they controlled Congress. Surely, being the party that saved Social Security would be worth some political points? 

Perhaps what needs to be defended here is the basic structure of Social Security: that is, a retirement plan that has some linkage from wage contributions to benefits and that offers an inflation-adjusted lifetime stream of payments. The program was intended from the start as a basic building block for retirement, with the idea that people would have other forms of retirement savings. But a certain number of Republicans want to turn the program into a private-sector retirement scheme, where people invest their own funds as they please. Meanwhile, a certain number of Democrats want to make the program much more redistributive from those with high incomes to those with lower incomes, which would mean a higher degree of separation between what is paid into the program and what is received.  

But trying to transform Social Security into something else, so that its baseline function is diminished in pursuit of other goals, is certainly complex, and probably misguided. In comparison, fixing Social Security as it stands is fairly straightforward. If you aren't wild about elements of the Bipartisan Policy Commission suggestions, the specifics can certainly be tweaked. But the kinds of proposals described here have the great advantage that they don't rely on waving any magic wands. They don't claim that Social Security can be fixed by eliminating waste, fraud, and abuse, or by an unexpected surge of economic or stock market growth. The proposals just face the tradeoffs squarely, and suggest one way to proceed. 

Tuesday, January 22, 2019

Some Economics of Foot-Binding

When I have thought of foot-binding in the past, which wasn't all that often, I've tended to view it as just one of those grim social practices, built on a mixture of social positioning and sexism, which disfigured the bodies of women. That's not wrong, but it's an oversimplification. Why did such a practice arise at one time, but not another time? Why did it end? Why did it differ across regions of China? Why feet? Xinyu Fan and Lingwei Wu give a fuller sense of context in "The Economic Motives for Foot-binding," a version of which was given at the meetings of the Allied Social Science Associations in Atlanta in early January. 

Here's a comment on how foot-binding was perceived in China (footnotes and citations omitted):
Originating from a female dancer in imperial palace during the Five Dynasties (907-960), foot-binding persisted for nearly a millennium in historical China. ... Foot-binding decisions by parents were made at girl’s early childhood (i.e. age 5 to 12), and marriage market matching took place in a later stage (i.e. 16-25). The bride’s family used the option to bind daughter’s feet to compete for better marriage opportunities and insure against downward mobility in the future. Regarding the value of foot-binding, men’s preference revealed it as a combination of appreciation of women’s beauty and virtue. For its aesthetic value, there exists a long-standing admiration of women’s small feet and elegant gait, traceable in Chinese poems and prose. In addition, foot-binding was also considered as carrying a “vector of status” , as a symbol of elegance, good breeding and a mark of status and virtue. Since foot-binding is a painful process for women to undertake, well-shaped and tiny bound feet also help to reveal their endurance, obedience and submissiveness. Taken together, as a package of beauty and women’s feminine virtue, foot-binding captured the key elements of men’s moral and aesthetic appreciation of women.
Fan and Wu point out that the foot-binding in China coincided with more widespread use of a national Civil Service Examination, which shook up the possibilities for social mobility in China. They write:
"Foot-binding is modeled as a premarital investment made by girls’ parents for marriage market competition. The heart of our theory is to relate such investment decisions with the dynamics of a gender-specific social mobility system – the Civil Examination System (in Chinese, the Keju, 607-1905). Briefly, the exam system triggered a transition from heredity aristocracy to meritocracy, under which system talented males could climb up the social ladder by passing exams while those who failed the exams would move downwards. As a consequence, the exams introduced greater social mobility, and resulted in a more heterogeneous composition of men compared to that of women on marital quality. This induced greater premarital investments by women for better marriage opportunities and against potential downward mobility. Foot-binding, as a package embodies both aesthetic and moral values of women, was adopted to differentiate themselves in the marriage market and served as a social ladder for women to climb up."
Foot-binding varied by region, and areas where physical mobility for women had greater economic value had less footbinding. 
Given that foot-binding deforms women’s feet, it sharply limits physical mobility thus precludes them from engaging in intensive non-sedentary activities, while having much less of an effect on sedentary activities such as household handicraft production. Therefore, among lower class women who played an active income-earning role, foot-binding prevalence exhibited regional variations driven by different agricultural regimes. In particular, foot-binding of lower class women was highly prevalent in regions where women specialized in sedentary labor (e.g. household handicraft), and less popular in regions requiring labor-intensive farmland work (e.g. rice cultivation). 
Footbinding ended early in the 20th century. Part of the reason was a government campaign against the practice. But economic forces were also at work. The national civil service examination ended in 1905, and educational and job opportunities for women were opening up.
Following the logic of the above model, we characterize the decline of foot-binding as the consequence of two forces: (1) the decreasing benefit of foot-binding in the marriage market, driven by equalization in gender-specific mobility; and (2) the increasing opportunity cost of foot-binding in the labor market. Regarding the first force, the exam system was abolished officially in 1905. During the Republican and following periods, girls had increasing educational, economic and social/public opportunities. The increasing equality of opportunities promoted gendersymmetric mobility, and women’s quality dispersion began to catch up with that of men. ... Another economic force driving women out of foot-binding was the modern industrialization process in textile. Combining data on local transportation, industrialization and economic development, Bossen and Gates (2017) demonstrated that the demise of foot-binding was closely related to the rise of textile industries that gradually replaced traditional household handicraft production, and some of them had to leave home to work in distant factories. Under these circumstances, foot-binding is no longer a desired tool to compete in the marriage market, as its benefits shrank while its opportunity cost increased. 

Monday, January 21, 2019

Some Economics for Martin Luther King Day

On November 2, 1983, President Ronald Reagan signed a law establishing a federal holiday for the birthday of Martin Luther King Jr., to be celebrated each year on the third Monday in January. As the legislation that passed Congress said: "such holiday should serve as a time for Americans to reflect on the principles of racial equality and nonviolent social change espoused by Martin Luther King, Jr.." Of course, the case for racial equality stands fundamentally upon principles of justice, not economics. But here are a few economics-related thoughts for the day clipped from 2018 posts at this blog, with more detail and commentary at the links:

1) "What Causes Inequality to Erupt Into Riots? Revisiting the Kerner Commission" (September 6, 2018)
"The Kerner report was the final report of a commission appointed by the U.S. President Lyndon B. Johnson on July 28, 1967, as a response to preceding and ongoing racial riots across many urban cities, including Los Angeles, Chicago, Detroit, and Newark. These riots largely took place in African American neighborhoods, then commonly called ghettos. On February 29, 1968, seven months after the commission was formed, it issued its final report. The report was an instant success, selling more than two million copies. ... The Kerner report documents 164 civil disorders that occurred in 128 cities across the forty-eight continental states and the District of Columbia in 1967 (1968, 65). Other reports indicate a total of 957 riots in 133 cities from 1963 until 1968, a particular explosion of violence following the assassination of King in April 1968 (Olzak 2015)."
The September 2018 issue of the Russell Sage Foundation Journal of the Social Sciences includes a 10-paper symposium from a range of social scientists concerning "The Fiftieth Anniversary of the Kerner Commission Report." The introductory essay by Susan T. Gooden and Samuel L. Myers Jr., "The Kerner Commission Report Fifty Years Later: Revisiting the American Dream" (pp. 1–17) does an excellent job of setting the historical context and contemporary reactions to the report, along with offering some comparisons that I at least had not seen before how hard it is to explain why some cities experienced riots and others did not.

The opening paragraph above is quoted from the Gooden/Myers paper. As they point out, perhaps the most commonly repeated comment from the report was that it baldly named white racism as an underlying cause. They quote the Kerner report: “What white Americans have never fully understood—but what the Negro can never forget—is that white society is deeply implicated in the ghetto. White institutions created it, white institutions maintain it, and white society condones it.” Although the Kerner report was widely disseminated, it was not popular. As Gooden and Myers report:
"President Johnson was enormously displeased with the report, which in his view grossly ignored his Great Society efforts. The report also received considerable backlash from many whites and conservatives for its identification of attitudes and racism of whites as a cause of the riots. `So Johnson ignored the report. He refused to formally receive the publication in front of reporters. He didn’t talk about the Kerner Commission report when asked by the media,' and he refused to sign thank-you letters for the commissioners (Zelizer 2016, xxxii–xxxiii)."
2) "Black-White Disparities: 50 Years After the Kerner Commission" (February 27, 2018)

Janelle Jones, John Schmitt, and Valerie Wilson offer a useful starting point in the short report, "50 years after the Kerner Commission: African Americans are better off in many ways but are still disadvantaged by racial inequality," from the Economic Policy Institute (February 26, 2018).


3) "Black/White Racial Inequality: A Place-Based Look" (October 5, 2018)

The black population is not equally distributed across the United States: not equally across regions of the country, nor within metropolitan areas. This unequal distribution is in substantial part a result of historical events and policy decisions, many of them rooted in racism. As a result, policies that affect certain regions of the country more than others, or certain parts of metropolitan areas more than others, will inevitably have disparate racial effects. Bradley L. Hardy, Trevon D. Logan, and John Parman lay out the evidence and arguments for these and related claims in "The Historical Role of Race and Policy for Regional Inequality," which appears as a chapter in Place-Based Policies for Shared Economic Growth, edited by Jay Shambaugh and Ryan Nunn (Hamilton Project at the Brookings Institution, September 2018). As one example:

"As of 1880, 90 percent of the black population still lived in the South and 87 percent of the black population lived in a rural area. In contrast, only 24 percent of the white population lived in the South, and 72 percent of the white population lived in rural areas. This meant that black individuals were disproportionately affected by constraints on economic opportunity in the rural South. Over the second half of the 19th century, incomes in the South and the North diverged significantly, with average income in the South only half of the national average by 1900 ,,, The destruction caused by the Civil War and the emergence of northern manufacturing while the southern economy remained predominantly agricultural contributed to these trends. The black population therefore found itself in a region with far less economic opportunity than the rest of the nation."
As the authors also note, the lack of opportunity for rural southern blacks was reinforced by racism by individuals, employers, social institutions and government, which affected education, labor markets, and political participation. This lack of opportunity stirred what is called the "Great Migration" of blacks from the American south to northern cities, a pattern that lasted into the 1960s and which helped to reduce black-white gaps in income and other areas. But when blacks arrived in northern cities, they faced patterns of rising segregation by race. In many ways, the geographic location patterns of the current black population was heavily shaped over the last century-and-a-half by those policies. Moreover, the geographic location patterns of the black population are closely linked to the continuing inequalities of outcomes experienced by the black population.


4) "Black-White Income and Wealth Gaps" (July 2, 2018)

William Darity Jr., Darrick Hamilton, Mark Paul, Alan Aja, Anne Price, Antonio Moore, and Caterina Chiopris discuss  "What We Get Wrong About Closing the Racial Wealth Gap" (April 2018, Samuel DuBois Cook Center on Social Equity at Duke University). The paper is written in the form of myths about the black-white wealth gap, then followed by evidence.
Myth 1: Greater educational attainment or more work effort on the part of blacks will close the racial wealth gap. ...
At every level of educational attainment, black families’ median wealth is substantially lower than their white counterparts. White households with a bachelor’s degree or post-graduate education (such as with a Ph.D., MD, and JD) are more than three times as wealthy as black households with the same degree attainment. Moreover, on average, a black household with a college-educated head has less wealth than a white family whose head did not even obtain a high school diploma. It takes a post-graduate education for a black family to have comparable levels of wealth to a white household with some college education or an associate degree ...
Myth 2: The racial homeownership gap is the “driver” of the racial wealth gap. ...
The data indicates that white households who are not home-owners hold 31-times more wealth than black households that do not. Among households that own a home, white households have nearly $140,000 more in net worth than comparable black households. ...
Myth 3: Buying and banking black will close the racial wealth gap. ...
Black-owned banks also are miniscule in the context of the general scale of American banking. The largest five black owned banks recently were estimated to have assets totaling $2.3 billion, while J.P. Morgan alone had an estimated $2 trillion in assets. 
Myth 4: Black people saving more will close the racial wealth gap. ...
[T]here is no evidence that black Americans have a lower savings rate than white Americans once household income is taken into account ...
Myth 5: Greater financial literacy will close the racial wealth gap...
Meager economic circumstances—not poor decision making or deficient knowledge—constrain choices and leave asset-poor borrowers with little to no other option but to use predatory and abusive alternative financial services. A negligible level of economic resources readily explains why blacks, specifically, use more predatory financial institutions. ...

Myth 6: Entrepreneurship will close the racial wealth gap. ....
Blacks are far less likely to own a business, and for blacks that do own a business they have far less equity. ... In reality the data paints a daunting picture for diversity in entrepreneurship. According to the U.S. Census Bureau’s Survey of Business Owners (SBO), which is conducted every five years, over 90 percent of Latino and black firms do not have even one employee other than the owner. ... No amount of tutorials or online courses from wealth experts can change the reality of the racialized advantages and disadvantages that undergird entrepreneurship in America. ...
Myth 7: Emulating successful minorities will close the racial wealth gap. ...
In short, so-called “successful” immigrant groups actually retrieve a comparable class position as the one they held in their country of origin. Their pre-migration capital, whether embodied in their education and training or their financial resources, is critical in determining their outcomes in the United States. ... To suggest that blacks and racialized Latino, and Native Americans should emulate other supposedly successful “minority” groups perpetuates the false narrative that their asset poverty is due to a lack of hard work, effort, or ambition. ...
Myth 8: Improved “soft skills” and “personal responsibility” will close the racial wealth gap.
Black men already are largely located in service sector jobs that require, or depend, on “soft-skills.” It is not “soft skills” requirements that distinguish black and white male sites of employment. It is relatively lower pay in the jobs held by the former and relatively higher pay in jobs held by the latter.
Myth 9: The growing numbers of black celebrities prove the racial wealth gap is closing. ...
Unfortunately, from “The Cosby Show” to Michael Jackson’s multi-platinum albums to Will Smith’s meteoric rise to the present day mega couple Jay-Z and Beyoncé, black celebrity has masked black poverty, rather than contributed to closing the racial wealth gap. ... Despite recently released 2016 Federal Reserve data showing that the median black family has a net worth of about $17,600, while the median white family has a net worth closer to $170,000 (Jan 2017), black life has come to be seen through the lens of radically exceptional cases, rather than typical ones.
Myth 10: Black family disorganization is a cause of the racial wealth gap. ...
However, marriage does little to help equalize wealth among white and black women with a college degree. For example, married white women without a bachelor’s degree are in households where they have more than two and a half times the wealth of married black women with a degree. Racial wealth disparities widen among married women with a bachelor’s degree; married white women are in households that have more than five times the amount of wealth as their black counterparts. White households with a single white parent have more than two times the net worth of two parent black households ...
Raj Chetty, Nathaniel Hendren, Maggie R. Jones, and Sonya R. Porter have written, "Race and Economic Opportunity in the United States:An Intergenerational Perspective" (March 2018, also available as NBER Working Paper #24441). The authors have written a nice readable summary of main findings for the VoxEU website (June 27, 2018). Here are the main findings:

Finding #1: Hispanic Americans are moving up in the income distribution across generations, while Black Americans and American Indians are not. ... In contrast, black and American Indian children have substantially lower rates of upward mobility than the other racial groups. For example, black children born to parents in the bottom household income quintile have a 2.5% chance of rising to the top quintile of household income, compared with 10.6% for whites.
Finding #2: The black–white income gap is entirely driven by differences in men’s, not women’s, outcomes. ...
Finding #3: Differences in family characteristics – parental marriage rates, education, wealth – and differences in ability explain very little of the black–white gap. ...
Finding #4: In 99% of neighbourhoods in the United States, black boys earn less in adulthood than white boys who grow up in families with comparable income.
Finding #5: Both black and white boys have better outcomes in low-poverty areas, but black-white gaps are bigger in such neighbourhoods. ...
Finding #6: Within low-poverty areas, black–white gaps are smallest in places with low levels of racial bias among whites and high rates of father presence among blacks. ...
Finding #7: The black–white gap is not immutable: black boys who move to better neighbourhoods as children have significantly better outcomes.
5) "Moral Licensing: When Doing Good Frees You to do Bad" (August 17, 2018)

"Moral licensing" is a term from the behavioral psychology literature. Daniel Effron of the London Business School, who has done some of the research in this area, describes it this way: "[T]he ability to point to evidence of past virtue can ironically make people more willing to act less-than-virtuously." Or as the title of one article puts it "being good frees us to be bad." Some of the examples in this literature describe how those who have participated in an action that seems virtuous then become more prone to display racist attitudes.

One study done back in 2008 asked whether a white person or a black person would be more qualified for a certain job. They were also asked about whether they favored Barack Obama for president--but some were asked before the question about job suitability and some were asked after. "[T]he opportunity to endorse Barack Obama made individuals subsequently more likely to favor Whites over Blacks." The results are in Effron, D.A., Cameron, J.S., Monin, B., Endorsing Obama Licenses Favoring Whites, Journal of Experimental Social Psychology (2009).

Sometimes just anticipating the prospect of doing good in the future can free you you up to do bad in the present. Jessica Cascio and E. Ashby Plant study "Prospective moral licensing: Does anticipating doing good later allow you to be bad now?" Journal of Experimental Social Psychology (2015, 56, pp. 110-116):
"Across four studies we explored whether anticipating engaging in a moral behavior in the future (e.g., taking part in a fundraiser or donating blood) leads people to make a racially biased decision (Studies 1 and 2) or espouse racially biased attitudes (Studies 3 and 4) in the present. Participants who anticipated performing a moral action in the future displayed more racial bias than control participants. ... These results demonstrate that anticipating a future moral act licenses people to behave immorally now and indicate that perceptions of morality encompass a wide variety of concepts, including past as well as anticipated future behavior."

Friday, January 18, 2019

Trump, Year Two: The Economic Record

When President Trump took office January 20, 2017, I asked "What if Trump Skeptics, Like Me, Turn Out to be Wrong? I wrote then:
If a Trump presidency turns out badly in various ways, then Trump skeptics like me will certainly say so. But if matters don't go wrong, then in fairness, then it seems to me that Trump skeptics should take a pledge to admit and acknowledge in a few years that at least some of our doubts and suspicions were incorrect--and indeed, we should be pleased that we were wrong. Here's my version of that pledge on a few economic issues.
  • If the US economy experiences a resurgence of manufacturing jobs, I will say so. 
  • If US economic growth surges to a 4% annual rate, I'll say so.
  • If the US economy does not actually retreat from foreign trade during four years of Trump presidency (which may well happen, given that globalization is driven by underlying economic forces, not just trade agreements), I will say so.
  • If US carbon emissions fall during a Trump presidency (which may happen with the resurgence of cleaner-burning natural gas and the larger installed base of noncarbon energy sources), I will say so.
  • If the budget deficit does not explode in size during a Trump administration, despite all the promises for tax cuts and a huge boost in infrastructure spending, I will say so. 
  • If the Federal Reserve has maintained its traditional independence after 3-4 years, I will say so. 
  • If the number of Americans without health insurance is about the same in 3-4 years, or even lower, I will say so. 
Well, President Trump has been in office two years.  What's the economic record? The US economy in 2018 continued the economic upswing that started in June 2009,  and by mid-2019, it will become the longest period without a recession in US economic history. However, The unemployment rate has been 4% or below for the last 10 months, and 5% or below for the last 37 months since December 2015. Inflation has stayed low. Despite its drop since late September, stock market values (like the S&P 500 index) are still up by abut 15% since January 20, 2017.

In short, it seems clear that the more dire predictions made back in 2017 about how the economy would immediately tank were based more in animus to Trump than in prescient analysis. Indeed, a lot of the economic patterns like growth and unemployment for the first two year of the Trump presidency look a lot like a continuation of patterns from the last few years of the Obama presidency. What about the specific questions I asked back in January 2017?

On the issue of manufacturing jobs,  total US manufacturing jobs bottomed out at 11.4 million in January 2010, had risen to 12.3 million by January 2017, and were up to 12.9 million by the end of 2018. A pattern set in the Obama administration has continued along with the continued growth of the US economy. .

On the rate of economic growth, the pattern looks much the same as it did in Obama's second term. Trump has had one quarter of growth at a rate faster than 4% (2018, Q2), but there is no particular sign of a jump in growth rates or productivity.

On trade issues, Trump just talked about protectionism in 2017, but actually started implementing it in 2018. However, one of the ironies here is that with the threat of greater protectionism about to kick in, it appears that a number of companies have accelerated their trade plans, boosting their imports ahead of future tariffs. Thus, the US trade deficit will probably grow in 2018 compared to 2017.  I'm not someone who thinks the bilateral US trade deficit with China should much of a focus, but for those who do, 2018 will mark the biggest such deficit ever. Thus, by one of President Trump's preferred measures, the size of the trade deficit, his policies are not a success in 2018. For those of us who worry about a disruption of global trade patterns, the bigger worries are coming in 2019.

On carbon emissions, US carbon emissions have been falling, not rising, while much of the rest of the world has been headed in the other direction. The lesson I would draw here is that too many people put too much faith in signing international agreements as the path to reducing carbon emissions. Focusing on government and industry actions, and how they shape prices, is considerably more important. For the US, I'd trade all the signatures on international climate change agreements for an actual carbon tax.

The ratio of federal debt held by the public to GDP doubled from 36% back in 2008 to about 72% by early 2013, This debt/GDP ratio edged up only a little more to 75% of GDP when Trump took office in early 2017, and had reached 76% by late 2018. But the Historical Tables released from Trump's Office of Management and Budget a year ago estimated that the budget deficit would rise from 3.5% of GDP in 2017 to 4.2% of GDP in 2018 and 4.7% of GDP in 2019 (Table 1.3). The real concern here is that in the middle run, starting about a decade from now, US spending is likely to rise substantially with the aging of the US population, and rather than address or postpone that issue, the $100 billion or so per year in tax cuts in the 2017  Tax Cuts and Jobs Act will make that middle-run debt crisis come a little sooner and be harder to address.

On the issue of the Federal Reserve, it seems fair to say that it has maintained its independence, but also to say that President Trump has challenged its independence in a way that hasn't been seen in the US since President Nixon pressured then-Fed chair Arthur Burns in the lead-up to the 1972 election--and Nixon's pressure was exerted mostly behind the scenes. The Fed has been systematically raising interest rates since December 2015, and if economic growth continues through 2019, I'd expect at least one more increase in 2019, too.

The number of Americans without health insurance hasn't budged much since President Trump took office. 

Looking ahead at 2019 and 2020, it seems to me that the US economy faces several meaningful sources of near-term risk.  Any of these would have a certain irony for the Trump presidency, because they would result in part from issues that President Trump has played a role in creating.

1) A recession could occur if the Federal Reserve raises interest rates too far, too fast. The Fed is fully aware of this danger, and has clearly signaled that it intends to look quite carefully at the evolution of the economy before raising interest rates further. But when President Trump openly criticizes the Fed, he inevitably reduced its perceived independence. If the Fed does not increase rates further, it creates a possibility--which clear-minded and hard-eyed financial markets will take into account--that the Fed is bowing to political pressure. Thus, if the Fed feels a need to assert its independence from President Trump's criticisms, it might feel a need to raise interest rates, rather than be  perceived as under political control.

2) President Trump has emphasized the importance of deregulation.  However, there is a strong case to be made that when it comes to financial regulation, additional steps need to be taken. The Dodd-Frank legislation back in 2010 was heavily focused on banks: having banks hold more capital, having regulators do stress-test scenarios of bank balance sheets, limiting certain risks banks could take, and so on. But banks are a diminishing part of the overall financial system. The so-called "shadow banking" sector is a broad category describing all the ways that borrowers can raise money outside of the banking sector, and investors can then purchase these loans. As a simple example, a money market mutual fund receives money from investors, who can be thought of as "depositors," and then invest the money in bonds, which can be thought of as lending the money to whatever government or private entity issued the bonds. But it isn't a bank.

I've written about the potential risks from "leveraged loans" and corporate debt more broadly. As another example, the new financial rules require many financial derivatives to be traded through a "central clearinghouse"--a company lilke the National Securities Clearing Corporation or the Options Clearing Corporation--but whether these clearinghouses will remain solvent in a financial emergency, and how they should be regulated, is not as clear as it should be. Some countries have the ability to impose rules that might impose, say, loan-to-income ratios if it seems that borrowing is getting out of hand. If that seems like a good idea for the US economy at some point, no US financial agency has that power. In short, whatever the broad merits of reducing the regulatory burden on the US economy, some parts of the financial sector could use a close and proactive look from regulators.

3) President "I am a tariff man" Trump has expressed strong concerns that interactions with the rest of the world are hurting the US economy. I disagree, but set aside the cosmic arguments over free trade and just think about the adjustment issues for a moment. A major pattern in the US and world economy in recent decades has been a shift to "global supply chains." This isn't just a matter of goods, but also international movements of data, services, and e-commerce more generally. A modern supply chain isn't a simple thing: it involves negotiations between sellers and buyers over technical specifications, delivery of output, as well as accounting, legal, and managerial issues. It isn't yet clear to me whether President Trump intends to settle his trade disputes by negotiating small changes and then declaring victory--which is the pattern with the proposed shift from the North American Free Trade Agreement (NAFTA) to a US-Mexico-Canada Trade Agreement (USMCA)--or if he truly intends to deliver a good swift kick to the global trading system as a whole. Even if the Trumpist argument that the US should become less involved in international trade is correct in the long run, a tectonic disruption of global supply chains built up over several decades will impose large and immediate costs on many US firms and their workers, as well as on US consumers.

Just to be clear, listing these kinds of risks should not be taken as a prediction that they are actually about to happen. The most likely prediction for 2019 is that it will be a lot like 2018, or perhaps a bit slower, unless something dramatic happens.