The last time the U.S. Department of Agriculture did a detailed "Overview of the U.S. Turkey Industry" appears to be back in 2007, although an update was published in April 2014 Some themes about the turkey market waddle out from those reports on both the demand and supply sides.
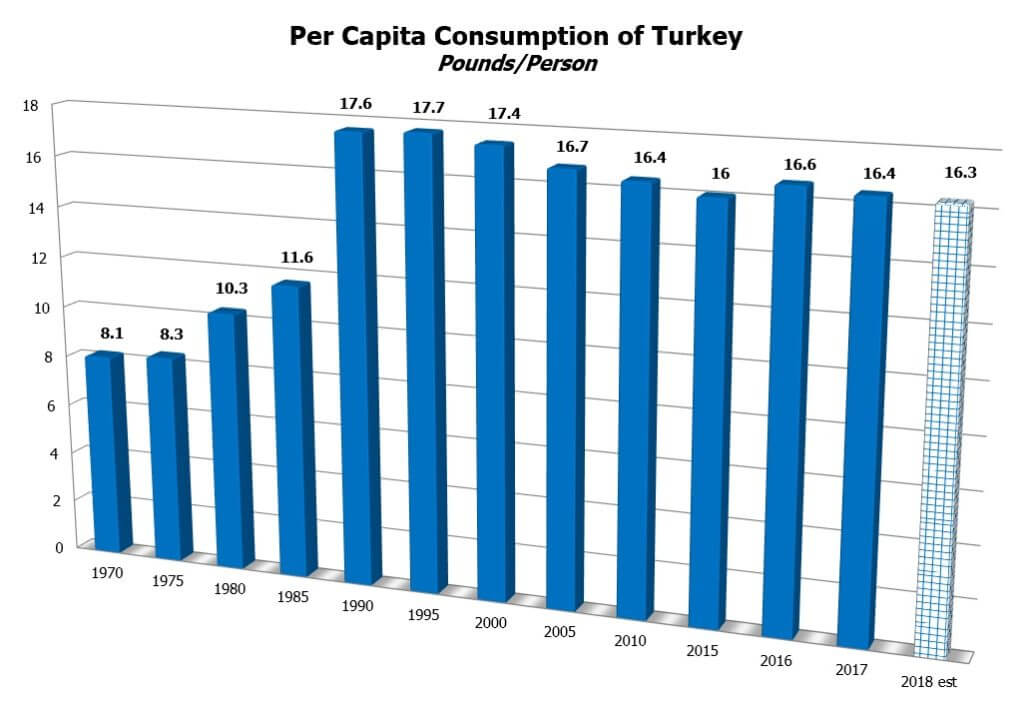
On the demand side, the quantity of turkey per person consumed rose dramatically from the mid-1970s up to about 1990, but then declined somewhat, but appears to have made a modest recovery in the last few years The figure below is from the Eatturkey.com website run by the National Turkey Federation.
On the production side, the National Turkey Federation explains: "Turkey companies are vertically integrated, meaning they control or contract for all phases of production and processing - from breeding through delivery to retail." However, production of turkeys has shifted substantially, away from a model in which turkeys were hatched and raised all in one place, and toward a model in which the steps of turkey production have become separated and specialized--with some of these steps happening at much larger scale. The result has been an efficiency gain in the production of turkeys. Here is some commentary from the 2007 USDA report, with references to charts omitted for readability:
"In 1975, there were 180 turkey hatcheries in the United States compared with 55 operations in 2007, or 31 percent of the 1975 hatcheries. Incubator capacity in 1975 was 41.9 million eggs, compared with 38.7 million eggs in 2007. Hatchery intensity increased from an average 33 thousand egg capacity per hatchery in 1975 to 704 thousand egg capacity per hatchery in 2007.
Some decades ago, turkeys were historically hatched and raised on the same operation and either slaughtered on or close to where they were raised. Historically, operations owned the parent stock of the turkeys they raised while supplying their own eggs. The increase in technology and mastery of turkey breeding has led to highly specialized operations. Each production process of the turkey industry is now mainly represented by various specialized operations.
Eggs are produced at laying facilities, some of which have had the same genetic turkey breed for more than a century. Eggs are immediately shipped to hatcheries and set in incubators. Once the poults are hatched, they are then typically shipped to a brooder barn. As poults mature, they are moved to growout facilities until they reach slaughter weight. Some operations use the same building for the entire growout process of turkeys. Once the turkeys reach slaughter weight, they are shipped to slaughter facilities and processed for meat products or sold as whole birds.
Turkeys have been carefully bred to become the efficient meat producers they are today. In 1986, a turkey weighed an average of 20.0 pounds. This average has increased to 28.2 pounds per bird in 2006. The increase in bird weight reflects an efficiency gain for growers of about 41 percent."The 2014 report points out that the capacity of eggs per hatchery has continued to rise (again, references to charts omitted):
"For several decades, the number of turkey hatcheries has declined steadily. During the last six years, however, this decrease began to slow down. As of 2013, there are 54 turkey hatcheries in the United States, down from 58 in 2008, but up from the historical low of 49 reached in 2012. The total capacity of these facilities remained steady during this period at approximately 39.4 million eggs. The average capacity per hatchery reached a record high in 2012. During 2013, average capacity per hatchery was 730 thousand (data records are available from 1965 to present)."
U.S. agriculture is full of examples of remarkable increases in yields over perionds of a few decades, but they always drop my jaw. I tend to think of a "turkey" as a product that doesn't have a lot of opportunity for technological development, but clearly I'm wrong. Here's a graph showing the rise in size of turkeys over time from the 2007 report.

The production of turkey remains an industry that is not very concentrated, with three relatively large producers and then more than a dozen mid-sized producers. Here's a list of top turkey producers in 2017 from the National Turkey Federation, as measured by millions of pounds of liveweight processed.

Given this reasonably competitive environment, it's interesting to note that the price markups for turkey--that is, the margin between the wholesale and the retail price--have in the past tended to decline around Thanksgiving, which obviously helps to keep the price lower for consumers. However, this pattern may be weakening over time, as margins have been higher in the last couple of Thanksgivings Kim Ha of the US Department of Agriculture spells this out in the "Livestock, Dairy, and Poultry Outlook" report of November 2018. The vertical lines in the figure show Thanksgiving. She writes: "In the past, Thanksgiving holiday season retail turkey prices were commonly near annual low points, while wholesale prices rose. ... The data indicate that the past Thanksgiving season relationship between retail and wholesale turkey prices may be lessening."

In the past, the US turkey industry has at some times suffers from outbreaks of HPAI
(Highly Pathogenic Avian Influenza): for discussion of the 2015 outbreak, see the November 17, 2015 issue of the "Livestock, Dairy, and Poultry Outlook" from the US Department of Agriculture, where Kenneth Mathews and Mildred Haley offer some details. But for Thanksgiving 2019, supply seems to have remained strong and wholesale turkey prices have stayed low.

The production of turkey remains an industry that is not very concentrated, with three relatively large producers and then more than a dozen mid-sized producers. Here's a list of top turkey producers in 2017 from the National Turkey Federation, as measured by millions of pounds of liveweight processed.


In the past, the US turkey industry has at some times suffers from outbreaks of HPAI
(Highly Pathogenic Avian Influenza): for discussion of the 2015 outbreak, see the November 17, 2015 issue of the "Livestock, Dairy, and Poultry Outlook" from the US Department of Agriculture, where Kenneth Mathews and Mildred Haley offer some details. But for Thanksgiving 2019, supply seems to have remained strong and wholesale turkey prices have stayed low.
For some reason, this entire post is reminding me of the old line that if you want to have free-flowing and cordial conversation at dinner party, never seat two economists beside each other. Did I mention that I make an excellent chestnut stuffing?
Anyway, the starting point for measuring inflation is to define a relevant "basket" or group of goods, and then to track how the price of this basket of goods changes over time. When the Bureau of Labor Statistics measures the Consumer Price Index, the basket of goods is defined as what a typical U.S. household buys. But one can also define a more specific basket of goods if desired, and since 1986, the American Farm Bureau Federation has been using more than 100 shoppers in states across the country to estimate the cost of purchasing a Thanksgiving dinner. The basket of goods for their Classic Thanksgiving Dinner Price Index looks like this:

The cost of buying the Classic Thanksgiving Dinner was essentially unchanged from 2018 to 2019, rising by a penny from $48.90 in 2018 to $48.91 in 2019. The top line of the graph that follows shows the nominal price of purchasing the basket of goods for the Classic Thanksgiving Dinner. The lower line on the graph shows the price of the Classic Thanksgiving Dinner adjusted for the overall inflation rate in the economy. The lower line is relatively flat, which means that inflation in the Classic Thanksgiving Dinner has actually been a pretty good measure of the overall inflation rate.

Thanksgiving is a distinctively American holiday, and it's my favorite. Good food, good company, no presents--and all these good topics for conversation. What's not to like?