Tuesday, May 2, 2017

Furman Reflects on Eight Years of Economic Policy-Making

Jason Furman was an economic policy insider through all eight years of the Obama administration, with "oughly the first half of them as Deputy Director of the National Economic Council and the second half of them as Chairman of the Council of Economic Advisers." In the Arnold C. Harberger Distinguished Lecture on Economic Development at the UCLA Burkle Center for International Relations, Furman reflects on "The Role of Economists in Economic Policymaking" (April 27, 2017).

Furman has a pleasantly wry and discursive tone, with lots of anecdotes that mix together stories of success and failure. At least for readers like me, it's a tone that carries far more appeal and persuasive power than feverish oratory set to the sound of trumpets. For example, here are some of Furman's thoughts on the four things that economists have to offer when the answer to a policy question is not known.
The first is just describing the data. Describing the data does not tell you what caused what. It does not tell you what is the right policy or what is the wrong policy. But it can help you at least figure out what questions you should be asking, what areas you should be looking at to solve those questions, and what you can do about them. The data can be complicated. The government released two different measures of economic growth in the fourth quarter of 2016, one was 1.0 percent and one as 2.1 percent. The government also released two different measures of job growth in March 2017, 98,000 jobs and 472,000 jobs. Moreover, for the first quarter of this year the data tells a divergent story—with strong employment growth and strong “soft data”, like surveys of confidence, but much weaker GDP growth and weaker “hard data”, like actual sales numbers. I have spent a lot of time on these issues and developed a number of rules of thumb, almost all of which can be summarized by saying that you should look at a wide range of data, ideally smoothed over a longer period of time—without placing too much weight on any given indicator ... Data description can be more sophisticated than just looking at single numbers or even trends. Sometimes it helps to decompose a number into its components to identify what is driving it, at least in an arithmetic sense. 
The second set of techniques we use is economic theory. Economic theory can sometimes give you a very helpful answer to a question. One of the biggest insights in economics is that some items are more valuable to one person than to another person, and if those two people trade things, they can both be better off. These are the basic motivations for a market economy and the basis of the argument for expanding international trade. ... Let me give you one: the example of the allocation of electromagnetic spectrum ...  Spectrum is a scarce resource and in many cases the rights to use it were allocated decades ago. Today, much of the best spectrum is reserved for the exclusive use of television broadcasters while users of smartphones and tablets often face frustrating and economically costly delays in accessing data because of crammed airwaves. In the Los Angeles area, for example, there were more than 25 broadcast stations, some of them with only a handful of viewers, most of whom could watch the shows on cable, online or through other means. A station with only a few thousand viewers might be worth $5 million, but at the same time may own a license for spectrum that a mobile broadband provider would be willing to buy for $50 million. We proposed to deal with this by setting up an incentive auction. Anyone who is a television broadcaster who wants to sell their spectrum can do so, and anyone who is a mobile broadband provider or anything else and wants to buy that spectrum can do so. The auction is entirely voluntary—a station will only sell if it is better off with cash than with spectrum, a mobile broadband provider will only buy if it (and presumably its consumers) benefit more from the spectrum than the cash they pay, and taxpayers get a cut of the difference in the bids to reflect the government’s role in organizing the process, including repackaging the spectrum into contiguous blocks to make it more valuable. Economic theory was enough to motivate and support this proposal—which ultimately resulted in $5 billion for taxpayers as well as profits for television broadcasters, mobile broadband providers, and benefits for their consumers. ... In the last two decades, one of the fastest growing areas of economics has been “behavioral economics,” which relaxes the standard assumption that people are fully rational, and instead pays close attention to the ways people can be myopic, make decisions that depend on framing, and have limited attention spans or ability to incorporate information. One of the big successes of labor economics has been getting policy to focus less on the rate of return to savings and more on making it easier and more automatic to save. 
The third set of techniques we use is empirical work, trying to understand the causes and effects of different economic phenomena. I want to give you an example of a mistake I was involved in because I did not think hard about causation. At the end of 2008, I was working with Congress on legislation to raise the tax on tobacco products in order to pay for an expansion of the Children’s Health Insurance Program (CHIP). The main proposal was to raise the tax on a pack of cigarettes from $0.39 per pack to $1.01 per pack. But we also needed to set tax rates on a wide range of other tobacco products including roll-your-own tobacco, pipe tobacco, small cigars, large cigars, and more. Amidst everything that was going on at the end of 2008 with the Great Recession I did not pay enough attention to this issue, even though I once sat through what felt like an endless meeting on the topic. What came out of that meeting was a proposal to raise the tax rate on roll-your-own tobacco by more than $20 a pound while leaving the tax rate on pipe tobacco largely unchanged. What followed was a huge decline in the sale of roll-your-own tobacco and a huge increase in the sale of pipe tobacco ... It turns out that roll-your-own tobacco and pipe tobacco are highly substitutable—not because people have shifted to smoking pipes, but because you can still put pipe tobacco in a piece of paper, roll it up, and smoke it. This is not just a minor, technical observation. It turns out to be highly consequential for public health. I have estimated that the 2009 tobacco tax increase will reduce the number of premature deaths due to smoking by between 15,000 and 70,000 for each cohort. But it would have reduced them even more if we had harmonized the tax rate on different tobacco products, as we did in a subsequent proposal. In fact, economists in the Treasury Department estimated that the reduction in tobacco consumption under a harmonization proposal would be nearly two and a half times the size it would be under an increase in the cigarette tax alone that raises comparable revenue. 
 
Fourth, we sometimes combine empirical description, theory, and causation to build models that allow us to simulate the impact of different policies. For example, such simulations can tell you how a tax cut will be distributed or affect the economy, how much a particular health plan will cost per person covered, or how much carbon emissions will change as a result of different policy approaches. While any model is limited and imperfect, models can be especially useful in quantifying plausible tradeoffs in designing a policy and communicating the impact of policies to policymakers.

It's interesting to me that of these four approaches, Furman lists basic description of data and basic theoretical insights first, ahead of the more complex modelling approaches. Here are a few more words from Furman:
In the Obama Administration I worked on everything from helping to prevent a second Great Depression to restructuring the post office—although I confess that we were only successful on one of these. Many of the topics I worked on are standard fare for economics, like the minimum wage, international trade, or environmental regulation. Others might be topics you do not associate with economists, like criminal justice reform, immigration, and sanctions. And on none of these did economists fully get their way which, ceteris paribus, is a good thing ...

After the election many people expressed frustration that facts and analysis did not matter anymore. Paul Krugman cited the statistic that the three major networks spent a cumulative total of 32 minutes covering policy issues in the 2016 election. ... I certainly share the sentiment that facts and analysis play too small a role not just in campaigns but in governing. And I think there is a role for many types of communication and persuasion. For myself, I am not someone who could give a rousing speech at a rally so I will stick to my comparative advantage. And I do believe that the right response to the lack of sufficient weight for facts and analysis is to embrace more facts and analysis.

For those who are interested in the Council of Economic Advisers and the role of academic economists in policy-making, here are a few more links: 


Monday, May 1, 2017

Snapshots of Merger and Acquisition Activity

Here's a figure showing seven waves of corporate mergers in the US since the 1851, according to the Institute for Mergers, Acquisitions & Alliances (a not-for-profit think tank that does research and workshops, and runs an educational certificate program, with main offices in New York, Vienna, Zurich, and Ho Chi Minh City). As the figure shows, the first three waves of merges have substantial periods of time between them. The most recent four waves are all since 1985.

Looking more closely at recent years, here is some additional information on these patterns. In this figure, the blue bars (and the left-hand axis) show the number of announced deals in each year, while the red line (and right axis) show the total value of the deals. For example, the number of deals rose from 2011 to 2014, but not all that sharply, while the value of the deals jumped considerably. I

In both this figure, and the one above, the "wave" of mergers in the 1980s doesn't look to me so much like a separate wave, but rather just a time of transition to the higher levels of mergers that would follow. In addition, from a longer historical perspective, it looks more as if the US economy has entered  period since the 1990s when mergers are generally at high levels--although sometimes higher than others.

For another perspectives, here is the number and value of mergers and acquisitions on a worldwide basis since 1985, which again shows either three "waves" or just a generally higher level of mergers since the late 1990s, depending on how you interpret it.

Of course, patterns like these don't prove anything by themselves, and I try not to be someone who over-extrapolates. But I'll just say that these merger and acquisition patterns are certainly consistent with a vision of the US and the global economy in which large companies seem relatively more focused on spending their funds and their managerial time on financial maneuvers that allow them to reduce their exposure to market pressures (either by combining with direct competitors or combining with firms along the supply chain), and thus relatively less focused on seeking to improve their competitive position by internal investments in capital, skills, and innovation.

Saturday, April 29, 2017

"But When, Friend, Dost Thee Think?"

As final exams draw near at many colleges and universities (at least for those on a semester schedule), it seems appropriate to pass along this old story as told by Nicholas Murray Butler, President of Columbia University, at the 143rd Annual banquet of the Chamber of Commerce of the State of New York., 1911 (pp. 43-55), and available through the magic of the HathiTrust Digital Library
"I cannot help recalling an admirable story which is told of ROBERT SOUTHEY, once Poet Laureate of England. SOUTHEY was boasting to a Quaker friend of how exceedingly well be occupied his time, how he organized it, how he permitted no moment to escape; how every instant was used; how he studied Portuguese while he shaved, and higher mathematics in his bath.

"And then the Quaker said to him softly: `But when, friend, dost thee think? 
"My impression is that we need now some time to think, in order that reflection and study of principle, and grasp upon realities, may take the place of perpetual discussion and exposition, partly of what is, partly of what never was, partly of what never can be."

Friday, April 28, 2017

Digital Forces and the Other 70% of the US Economy

For those feeling the need for a bracing dose of optimism about the prospects for US productivity growth, I recommend "The Coming Productivity Boom: Transforming the Physical Economy with Information," written by Michael Mandel and Bret Swanson (March 2017), and published by the Technology CEO Council (which is more-or-less what it sounds like, a "public policy advocacy organization comprising Chief Executive Officers from America’s leading information technology companies, including Akamai, Dell, IBM, Intel, Micron, Oracle, Qualcomm and Xerox.")

Mandel and Swanson split the US economy into two big chunk, which they call the "digital economy" and the "physical economy." In the digital economy, which accounts for about 30% of US GDP, they argue that investment in information technology and productivity growth are doing fairly well. But in the physical economy, investment in information technology and productivity growth have been low. Thus, they argue that there is potential for rapid productivity growth in more than two-thirds of the US economy.

What are the industries in these two economic groupings? The digital economy is: "Computer and electronics production; publishing; movies, music, television, and other entertainment; telecom; Internet search and social media; professional and technical services (legal, accounting, computer programming, scientific research, management consulting, design, advertising); finance and insurance; management of companies and enterprises; administrative and support services." The physical economy is: "All other industries, including agriculture; mining; construction; manufacturing (except computers and electronics); transportation and warehousing; wholesale and
retail trade; real estate; education; healthcare; accommodations and food services; recreation." Obviously, their notion "physical" isn't just material goods, but also includes a number of the biggest service industries like health care and education--as long as what is ultimately being delivered is not actually digital in nature. 

After dividing up the economy in this way, here are a couple of the patterns they find. The first figure compares investment in information technology in the digital and physical sector; the other compares productivity growth in these two sectors.


They argue in some detail that with appropriate investments in  information technology, and the associated rethinking of production and output, substantial productivity growth is  possible in manufacturing, transportation, education, health care, wholesale/retail sales and other areas. One recent example is how how information technology, by allowing dramatically mapping of underground geological formations, has boosted production of natural gas from shale. 

What about manufacturing in particular? They write:
Government data shows that most domestic factories have not added much to their stock of information technology equipment and software over the past 10 years. Between 2004 and 2014, manufacturing IT capital stock increased by just $46 billion, and more than 65% of that gain was in the computer and electronics industry. ... Leaving out the computer and electronics industry, the capital stock of IT equipment in the rest of manufacturing has barely grown since 2000. The capital stock of software in manufacturing is, likewise, barely higher now than in 2000. ...
What about robots? According to trade  association data, 31,000 robots valued at
$1.8 billion were shipped to North American  customers in 2016. The spending on robots
pales next to the $300 billion in industrial equipment and manufacturing buildings that
corporations spent in the United States in 2016. In many cases, robots help the United
States retain jobs. Consider a modern semiconductor fab, which has installed a proprietary network of wafer-handling robots. This system probably reduced the number of wafer-handling jobs by several dozen. Yet the robots allowed the new fab to be built in the United States, instead of in a low-cost overseas location, thus saving or creating some 1,200 high-paying American jobs. 
The upside of robots in manufacturing spreading out into new industries is thus enormous. That’s crucial for increasing the productivity of existing manufacturing processes and  creating new processes altogether. In many ways manufacturing is the classic case where atoms will be boosted by bits. The process is already underway—but the diffusion of the Industrial Internet across the manufacturing sectors will take place over the next two decades. New, IT-enabled product categories, combined with design and customization that increasingly treats manufacturing as a service, will not necessarily bring back “old  jobs” but instead create new and better ones. ... 
Economists are constitutionally suspicious of claims that large gains are out there, just waiting to be achieved. As economists like to say, " If there's a $20 bill out there on the sidewalk, why hasn't someone already picked it up?" Mandel and Swanson offer this answer: 
"Why has it taken so long? It sounds like a tautology, but industries whose output is information are inherently more amenable to digitization. ... But when we examine industries whose output is primarily physical, the game gets far more difficult. To digitize a complex physical object such as a spinning jet engine, an unknown natural environment such as a buried oil field, or a rapidly changing manmade environment such as the traffic and work patterns of a large city, requires a level of sophisticated technology that was not available until fairly recently. Low-cost sensors that can be widely distributed; high-bandwidth wireless networks capable of collecting the information from the sensor; computing systems capable of analyzing terabytes of data in real time; artificial vision that can make sense of images and artificial intelligence that can make decisions—each of these are necessary parts of applying IT to the physical industries. Continued advances and price reductions in sensing, cloud computing, and broadband connectivity, combined with new thinking and new focus about how to apply these technologies to physical problems, are finally about to open up the other four-fifths of the economy to the magical laws of Moore and Metcalfe. ... Moore’s law, named after Intel founder Gordon Moore, refers to the tendency of silicon microchips to roughly double in cost performance (because of the industry’s remarkable ability to scale transistors and other chip features) every 18 months to two years. ... Metcalfe’s law refers to the observation by Ethernet inventor Robert Metcalfe that the power or value of networks rises not by the number of connected nodes but by something resembling the square of the number of nodes. This is one reason “network effects” can be
so powerful.
My own sense is that the answer to "why has it taken so long" goes beyond technology. In the first decade of the 20th century, many firms in the physical economy were often focused on how to cut costs by outsourcing or setting up global production chains, The leading providers in industries like health care and education seem exceptionally set in their traditional ways, with practices are hard for either internal executives or external entrepreneurs to uproot. The Great Recession discouraged firms across the economy from investing for a time. But it does seem at least imaginable to me that these patterns are shifting. The most important infrastructure for encouraging economic productivity during  the first half of the 21st century won't be isn't roads and bridges, but a combination of secure information communication network and a reliable energy supply. 

Mandel in particular has a track record here. Back in the mid-1990s, when he was writing for Business Week, he wrote about the potential for real economic growth in what he called the "new economy" (for example, here) before it became evident to everyone else in the official statistics. 

Thursday, April 27, 2017

Demand and the Frac Sand Example

Most people who teach economics are on a continual lookout for current examples of supply and demand. Otherwise, you end up falling back on  hypothetical goods like "widgets" and "leets" (which is "steel" spelled backward), at which point you can almost see the life and brightness fade out of the eyes of students.  nice lively example of shifts in demand comes from the demand for sand used in hydraulic fracking operations. As the Wall Street Journal recently reported, "Latest Threat to U.S. Oil Drillers: The Rocketing Price of Sand: The market for a key ingredient in fracking is again surging,"
(by Christopher M. Matthews and Erin Ailworth, March 23, 2017).

A couple of years ago, the USGS published "Frac Sand in the United States—A Geological and Industry Overview," by Mary Ellen Benson and Anna B. Wilson, with a section on "Frac Sand Consumption History" contributed by Donald I. Bleiwas (Open File Report 2015-1107, posted July 30, 2015). The report includes this useful figure, in which the bars show the metric tons of sand used for fracking (measured on the left axis); the numbers above the bars show the number of horizontal drilling rigs in operation in the US during any given week of the year; and the line shows the value of the sand (right axis).


The basic lesson is fracking is up and it is using a lot more sand. If you look a little more closely at teh years from 2010 to 2012, you can see that the number of horizontal drilling rigs rose from 822 to 1,151, but the quantity of sand being used more than doubled.  This data can be updated a bit. According to the Baker Hughes North American Rotary Rig Count, the number of horizontal rigs dropped in 2015 and stayed fairly at this lower level in 2016, as the price of oil dropped, but more recently the number of horizontal rigs is rising again. 


For an update through 2016 on production levels and price, the USGS publishes an annual fact sheet on various minerals. Fracking sand falls into the category of "Industrial Sand and Gravel," of which more than 70% is used for fracking. Here's the relevant table from the 2017 factsheet. Thus, back in 2012 there was about 50 million tons of total sand production, with about 70% of it going to fracking. By 2014, output of sand had doubled--mostly due to increased demand from fracking. The price per ton rose from $52 in 2010 to $106 per ton in 2014. Then output and price sagged in 2015 and 2016.


The Wall Street Journal story reports rising prices for sand this year. It also notes: "In Louisiana, Chesapeake Energy Corp. recently pumped a record 50.2 million pounds of sand into a horizontal well roughly 1.8 miles long, piquing the interest of some rivals who are now weighing whether they can do the same." And here's a figure showing quantities of sand being used in different fields.

No world-changing lessons here. The higher prices for sand don't seem likely to make much difference in the quantity of fracking, least for now, because sand is a fairly small slice of the overall cost. Environmental concerns are being already being raised in some US locations about the extent of sand-mining, and those concerns are likely to become more acute as the demand for fracking sand rises. But my guess is that if it becomes difficult to increase the supply of fracking sand, then those doing the fracking will either find ways to economize on sand or will figure out some alternative substances that would fill a similar purpose.

Postscript: Some readers might want to revisit my post on  "Demand for Sand" (April 16, 2014), which has some additional background on international demand for sand (mostly for concrete and construction purposes) and some environmental effects of sand-mining.


Wednesday, April 26, 2017

The Global Systemically Important Banks: An Update

"The large global banks were at the heart of the global financial crisis. In response to the crisis, the international Financial Stability Forum was upgraded to the Financial Stability Board (FSB) in 2009, with the full participation of finance ministers and even heads of government. The newly established FSB then published an integrated set of policy measures, such as capital surcharges and resolution plans, to address the systemic and moral hazard risks associated with global systemically important banks (G-SIBs). Eight years later, it is time to take stock of the impact of these measures. We answer three questions on what happened to the G-SIBs. First, have they shrunk in size? Second, are they better capitalised? Third, and in reference to the reported end of global banking, have they reduced their global reach?"

Thus writes Dirk Schoenmaker in "What happened to global banking after the crisis?" written as a Policy Contribution for the Bruegel think-tank (2017, Number 7), The short answers to his three question are: 1) No; 2) Yes; 3) Yes. 

Schoenmaker offers a list of 33 global systemically important banks--that is, the banks that governments feel compelled to rescue out of fear that their failure could crash the financial systems of a country or two. Some examples of the larger ones include BNP Paribas, Deutsche Bank, and Groupe CrĂ©dit Agricole in Europe; Bank of America, JP Morgan Chase, Citigroup, and Wells Fargo in the US; Bank of China, China Construction Bank, and Industrial and Commercial Bank of China, all of course in China; HSBC and Barclays in the UK; and Mitsubishi UFJ FG and Sumitomo Mitsui FG in Japan. 

Here's a summary chart, with the top panel showing assets, reserves, and international reach of these 33 G-SIBs in 2007 and in 2015. From the bottom line of the two panels, the total assets of these institutions rose slightly from 2007 to 2015; their capital reserves rose fairly dramatically; and the share of their business done at home rather than regionally or globally declined. 


Schoenmaker has lots more to say about these patterns. For example, assets for these institutions have risen in China, Japan, and the United States, but fallen in the euro area and the UK. Capital reserves are quite a bit higher in the US and China than in the euro area. Bottom line: "We conclude that reports on the death of global banking are greatly exaggerated."

Tuesday, April 25, 2017

When Restrictions on House-Building Meet Growing Demand: Interview with Joseph Gyourko

For a few years now, Joseph Gyourko has been doing research and writing essays with a focus on housing supply, and in particular, how a collision between local restrictions that hinder home-building combined with growing demand in those localities lead to differences in prices. In an interview with Hites Amir, Gyourko lays out these views in the April 2017 issue of the Global Housing Watch Newsletter. (The newsletter is produced by Amir, who works fo the International Monetary Fund, but it is not an official IMF document).
"In forthcoming work, Ed Glaeser and I conclude that most housing markets in the interior of the country function so that the price of housing is no more than the sum of its true production costs (the free market price of land plus the cost of putting up the structure) plus a normal entrepreneurial profit for the homebuilder. That is what we teach should happen in our introductory microeconomics courses—namely, that price paid by consumers in the market should equal the real resource cost of producing the good (housing in this case). These well-functioning housing markets exist in a broad swath of the country outside of the Amtrak Corridor in the Northeast (Washington, D.C. to Boston) and the major West Coast markets from Seattle all the way down to San Diego. The bulk of the population lives in these well-functioning markets, by the way. They just are not focused on by the media. ...
"Restrictions began to be imposed in many west coast markets in the 1970s, with east coast markets in the northeast following the next decade. Thus, it is the people who owned in those markets at those times who enjoyed the most appreciation in their homes. Those people tend to be senior citizens today, and even if they do not earn relatively high incomes, they are wealthy because of the real capital gains on their homes. ...  
"If they limit supply sufficiently relative to demand, then the existing housing units will be rationed by price. Richer households will be able to bid more to live in their preferred markets, so we get the sorting of the rich into the higher priced coastal markets. ... The divergence in home prices between low cost, elastically supplied markets and high cost, inelastically supplied markets has been growing over time—since 1950, at least. ...  This can generate a spiral up in prices, and it can last a long time. In 1950 for example, housing in the most expensive metropolitan areas was about twice as costly as in the average market. At the turn of the century in 2000, the most expensive metros were at least four times more costly than the average market. I expect that gap to widen over the coming decade. ...
"In a well-functioning market with elastic supply, prices should be equal to fundamental production costs. In most American markets, that is no more than $200,000-$250,000."
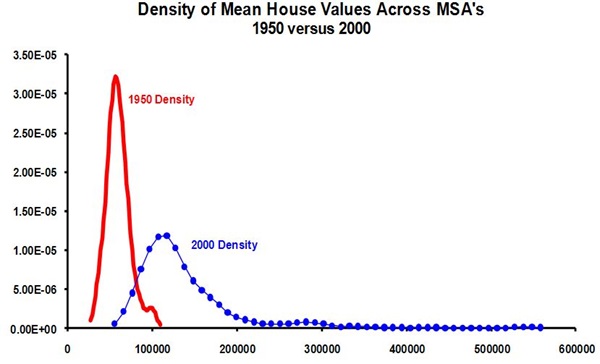
 Here's a figure, which is a version of a diagram that appears in "Superstar Cities," by Joseph Gyourko, Christopher Mayer, and  Todd Sinai in the American Economic Journal: Economic Policy, November 2013 (5:4, pp. 167-99). The figure shows what the distribution of the average house value across US metropolitan statistical areas (MSAs) in 1950 and 2000. Average prices are higher in 2000 than in 1950, which isn't surprising, since the average house is bigger, too. But the key insight here is that the distribution of average housing prices across cities in 1950 is more bunched together, while the distribution across cities in 2000 is much wider, with a long right-hand-tail.

Fig2

This wider distribution of housing prices across cities has broader trade-offs. It becomes harder for those living in cities with lower housing prices to relocate to cities with higher housing prices. It creates a greater level of economic segregation, because those with higher incomes are more likely to end up living in a smaller number of cities where they can afford the high housing prices, while those with middle-level or lower-level incomes struggle to find alternatives.  It adds a dose of bitterness to local arguments over zoning, because current owners of high-priced houses (whether they have owned a house for decades or bought more recently) live in fear that an increase in the supply of housing--or even building more moderately-sized and -price housing--might in some way limit whether their own home will keep rising in price. Gyourko says:
"I am a traditional housing and urban economist in this regard. New construction imposes real costs on its immediate neighbors and the broader community. Pollution is one, with congestion (on the roads, schools, etc.) being another. It is economically efficient to internalize these negative externalities by ‘taxing’ the developer in some way so the full costs of development are priced and paid for by the builder. What I am not in favor of is excessive regulation that imposes costs much higher than could be justified by spillovers. That results in too little development and creates affordability problems for the poor and the middle class."
In this hyperpartisan time in which we live, I feel compelled to add that the goal of rolling back local restrictions that limit house-building is advocated not just by the usual free-market suspects who tend to lean right politically, but was also supported by the Obama administration. For example, President Obama said in a speech to the US Conference of Mayors in January 2016: "We can work together to break down rules that stand in the way of building new housing and that keep families from moving to growing, dynamic cities." The Obama administration also published a "Housing Development Toolkit" (September 2016) to provide strategies for overcoming excessive local barriers to home-building.