Wednesday, September 30, 2015

Exchange Rates Moving

Major exchange rates for countries around the world are in the midst of movement that is large by historical standards. The International Monetary Fund offers some background in its October 2015 World Economic Outlook report, specifically in Chapter 3: "Exchange Rates and Trade Flows: Disconnected?"  The main focus of the chapter is on how the movements in exchange rates might affect trade balances, but at least to me, equally interesting is how the movement may affect the global financial picture.

As a starting point, here's a figure showing recent movements in exchange rates for the United States, Japan, the euro area, Brazil, China, and India. In each panel panel of the figure, the horizontal axis runs from 0 to 36 months. The shaded areas show how much exchange rates typically move over a 36 month period using data from January 1980 through June 2015. The darkest shading for 25th/75th percentile means that exchange rates moved historically within this range from 25-75% of the time. The lighter shading for 10th/90th percentile means that exchange rates move in this area from 10-90% of the time. The blue lines show the actual movement of exchange rates using different but recent starting dates for each country (as shown in the  panels). In every case the exchange rate has moved more than the 25th/75th band, and in most cases it is outside the 10th/90th band, too.


As the figure shows, currencies are getting stronger in the US, China, and India, but getting weaker in Japan, the euro area, and Brazil. The IMF describes the patterns this way:
Recent exchange rate movements have been unusually large. The U.S. dollar has appreciated by more than 10 percent in real effective terms since mid-2014. The euro has depreciated by more than 10 percent since early 2014 and the yen by more than 30 percent since mid-2012 ...  Such movements, although not unprecedented, are well outside these currencies’ normal fluctuation ranges. Even for emerging market and developing economies, whose currencies typically fluctuate more than those of advanced economies, the recent movements have been unusually large.
The report focuses on how movements of exchange rates have historically affected prices of imports and exports (which depends on the extent to which importers and exporters "pass through" the changes in exchange rates as they buy and sell), and in turn what that change in import and export prices means for the trade balance.
The results imply that, on average, a 10 percent real effective currency depreciation increases import prices by 6.1 percent and reduces export prices. in foreign currency by 5.5 percent ... The estimation results are broadly in line with existing studies for major economies. ... The results suggest that a 10 percent real effective depreciation in an economy’s currency is associated with a rise in real net exports of, on average, 1.5 percent of GDP, with substantial cross-country variation around this average ...
The estimates of how movements in exchange rates affect trade seem sensible and mainstream to me, but I confess that I am more intrigued and concerned about how changes in exchange rates can affect the global financial picture. In the past, countries often ran into extreme financial difficulties when they had borrowed extensively in a currency not their own--often in US dollars--and then when the exchange rate moved sharply, they were unable to repay. In the last few years, the governments of most emerging market economies have tried to make sure this would not happen, by keeping their borrowing relatively low and by building up reserves of US dollars to be drawn down if needed.

However, there is some reason for concern that a large share of companies in emerging markets have been taking on a great deal more debt, and because a substantial share of that debt is measured in foreign currency, these firms are increasingly exposed to a risk of shifting exchange rates. A different IMF report, the October 2015 Global Financial Stability Report, looks at this issue in Chapter 3: "Corporate Leverage in Emerging Markets--A Concern?" For a sample of the argument, the report notes:
Corporate debt in emerging market economies has risen significantly during the past decade. The corporate debt of nonfinancial firms across major emerging market economies increased from about $4 trillion in 2004 to well over $18 trillion in 2014 ... The average emerging market corporate debt-to-GDP ratio has also grown by 26 percentage points in the same period, but with notable heterogeneity across countries. ...  Leverage has risen relatively more in vulnerable sectors and has tended to be accompanied by worsening firm-level characteristics. For example, higher leverage has been associated with, on average, rising foreign exchange exposures. Moreover, leverage has grown most in the cyclical construction sector, but also in the oil and gas subsector. Funds have largely been used to invest, but there are indications that the quality of investment has declined recently. These findings point to increased vulnerability to changes in global financial conditions and associated capital flow reversals—a point reinforced by the fact that during the 2013 “taper tantrum,” more leveraged firms saw their corporate spreads rise more sharply ...
The relatively benign outcome from shifts in exchange rates is that they tweak prices of exports and imports up and down. The deeper concern arises if the movements in exchange rates lead to substantial debt defaults, or to "sudden stop" movements where large flows of international financial capital that had been heading into a country sharply reverse direction. In the last few decades, this mixture of debt problems and sudden shifts in international capital flows changes has been the starting point for national-level financial crises in east Asia, Russia, Latin America, and elsewhere.

Tuesday, September 29, 2015

Computer Use and Learning: Some Discomfiting International Experience

Greater use computers to support K-12 education sometimes sometimes touted as the magic talisman that will improve quality and control costs. But the OECD provides some discomfiting evidence for such optimism in its recent report: Students, Computers, and Learning: Making the Connection. From the Foreword:
This report provides a first-of-its-kind internationally comparative analysis of the digital skills that students have acquired, and of the learning environments designed to develop these skills. This analysis shows that the reality in our schools lags considerably behind the promise of technology. In 2012, 96% of 15-year-old students in OECD countries reported that they have a computer at home, but only 72% reported that they use a desktop, laptop, or tablet computer at school, and in some countries fewer than one in two students reported doing so. And even where computers are used in the classroom, their impact on student performance is mixed at best. Students who use computers moderately in school tend to have somewhat better learning outcomes than students who use computers comparatively rarely. But students who use computers very frequently in school do a lot worse in most learning outcomes, even after accounting for social background and student demographics. 
Here are a couple of sample results from the OECD report. The horizontal index is a measure of the use of information and communications technology in school. The vertical axis is a measure of scores on reading or math tests. The curve that is shown has been adjusted for the socioeconomic status of students. For reading, the result seems to be that some intermediate level of computer use beats too much or too little. For math, the use of computers doesn't seem to have much benefit at all.


The OECD report makes the point in several places that results like these don't prove that computerized instruction can't work, nor that it isn't working well in some places. The report emphasizes that if computerized instruction actually leads to more time spent on studying, or more efficient use of time spent on studying, it would then have potential to increase learning. But at least for now, looking over the broad spectrum of OECD countries, it seems fair to say that there are places where the use of computer in schools should be higher, and places where it should be lower--and we haven't yet developed best practices for how computerized instruction can work best.

For a previous post with evidence for being skeptical about whether computers at home help learning, see this post from March 29, 2013, with evidence from an experiment done in five school districts in California.

Friday, September 25, 2015

Trends in Employer-Provided Health Insurance

Most people in high-income countries are insulated from the actual cost of health care services. When health care is provided by or billed to the government, knowledge and perception about the full cost of that care becomes muffled. In the United States, reports the Kaiser Foundation, "Employer-sponsored insurance covers over half of the non-elderly population, 147 million people in total." Again, when an employer is paying most of the cost of health insurance, knowledge and perception about the full cost become a matter of whether you read articles full of statistics on health care spending, not personal experience. Of course, there are good health and safety reasons why one might prefer that patients and health care providers not be thinking at every moment about how to pinch pennies and cut costs. But for society as a whole, the costs of health care don't vanish just because most patients and health care providers would prefer not to talk about them--or even to know very much about them.

 The Kaiser Foundation along with the Health Research & Educational do an annual annual survey of private and nonfederal public employers with three or more workers, and the results of the "2015 Employer Health Benefits Survey" are available here. In what follows, I'll quote mainly from the "Summary of Findings."
"The key findings from the survey, conducted from January through June 2015, include a modest increase (4%) in the average premiums for both single and family coverage in the past year. The average annual single coverage premium is $6,251 and the average family coverage premium is $17,545. The percentage of firms that offer health benefits to at least some of their employees (57%) and the percentage of workers covered at those firms (63%) are statistically unchanged from 2014. ... Employers generally require that workers make a contribution towards the cost of the premium. Covered workers contribute on average 18% of the premium for single coverage and 29% of the premium for family coverage ..."
Here's how the average employer-sponsored health insurance premium has risen during from 2005 to 2015. The Patient Protection and Affordable Care Act was signed into law by President Obama in March 2010, in the middle of this time period.


This graph is just the worker's contribution to the health insurance premium. In addition, the deductibles and coinsurance payments in employer-provided health insurance are on the rise.

The average annual deductible is similar to last year ($1,217), but has increased from $917 in 2010. ... Looking at the increase in deductible amounts over time does not capture the full impact for workers because the share of covered workers in plans with a general annual deductible also has increased significantly, from 55% in 2006 to 70% in 2010 to 81% in 2015. If we look at the change in deductible amounts for all covered workers (assigning a zero value to workers in plans with no deductible), we can look at the impact of both trends together. Using this approach, the average deductible for all covered workers in 2015 is $1,077, up 67% from $646 in 2010 and 255% from $303 in 2006. A large majority of workers also have to pay a portion of the cost of physician office visits. Almost 68% of covered workers pay a copayment (a fixed dollar amount) for office visits with a primary care or specialist physician, in addition to any general annual deductible their plan may have. Smaller shares of workers pay coinsurance (a percentage of the covered amount) for primary care office visits (23%) or specialty care visits (24%). For in-network office visits, covered workers with a copayment pay an average of $24 for primary care and $37 for specialty care. For covered workers with coinsurance, the average coinsurance for office visits is 18% for primary and
19% for specialty care. While the survey collects information only on in-network cost sharing, it is generally understood that out-of-network cost sharing is higher.
Here's a figure showing the rise over time in share of employer-provided health insurance plans with a substantial deductible.

Of course, the figures given here are national averages, and in a big country, there will be variation around these average. Those who want details on details by large and small firms, type of health care provider (preferred provider organizations, HMOs, high-deductible plans, and others), geography, and other factors can consult the report. That said, here are two of my own takeaway points.

1) For a lot of middle-income workers, the cost of employer-paid health insurance at more than $17,000 per year for family coverage is a big part of your overall compensation--much larger than many people realize. It's also not something that employers do out of the goodness of their hearts. Employers look at what overall compensation they are willing to pay, and when more of it comes in the form of health insurance premiums, less is available for take-home pay.

2) The rise in direct employee contributions to their own health care costs--contributing to the insurance premium, along with deductible and coinsurance--is enormously annoying to me as a patient and a father. On the other side, the economist in me recognizes that cost-sharing plays a useful function, and there is a strong body of evidence showing that when patients face a modest degree of cost-sharing, they use substantially fewer health care services and their health status doesn't seem to be any worse. But at some point--and maybe some people are already reaching that point--high deductibles and copayments could potentially lead people to postpone needed care.

As I've pointed out on this blog in the past, the prevalence of employer-provided health insurance in the US economy is an historical accident, dating back to a time in World War II when wage and price controls were in effect--but employers were allowed to offer a raise by providing health insurance coverage to employees. The amount that employers spend on health insurance for employees is not counted as income to the employees, and the US government estimates that excluding this form of compensation from the income tax costs the government more than $200 billion per year. Moreover, the percentage of firms providing employer-provided health insurance--especially among mid-sized and small firms--seems to be declining slowly over time.
But almost all large employers do provide health insurance benefits,and seem likely to do so into the future. A fair understanding of the US health insurance market and health care policy needs to face up to the social costs and tradeoffs, and not just the benefits, of employer-provided insurance.

Thursday, September 24, 2015

Wage Inequality Across US Metropolitan Areas

Some US urban areas in their level of wage inequality, and in how the level of wage inequality has been changing over time. J. Chris Cunningham provides some data in "Measuring wage inequality within and across U.S. metropolitan areas, 2003–13," which appears in the September 2015 issue of the Monthly Labor Review (which is published by the US Bureau of Labor Statistics).

For his measure of wage inequality, Cunningham focuses on what is sometimes called the 90/10 ratio, which is the ratio between the income of the person in the 90th percentile of the wage distribution to the person in the 10th percentile of the wage distribution. "The most recent data show that the 90th-percentile annual wage in the United States for all occupations combined was $88,330 in 2013, and the 10th-percentile wage was $18,190. In other words, the highest paid 10 percent of wage earners in the United States earned at least $88,330 per year, while the lowest paid 10 percent earned less than $18,190 per year. Therefore, by this measure, the “90–10” ratio in the United States was 4.86 in 2013, compared with 4.54 in 2003, an increase of about 7 percent over that 10-year period."

How does this measure of inequality differ across metro areas? The most unequal metropolitan areas, where the 90/10 ratio is above 5.5, are shown by reddish shading in the map below. They are heavily concentrates from Washington, DC to Boston on the east coast, and then in the San Francisco/San Jose region on the west coast.


What are some of the factors correlated with higher levels of wage inequality? Larger cities tend to have greater wage inequality. Also, areas with a higher proportion of certain high-paying occupations tend to have greater wage inequality, including "management, business and financial operations, computer and mathematical, architecture and engineering; life, physical, and social science; legal; arts, design, entertainment, sports, and media; and healthcare practitioners and technical. Here's a list of the top 10 and bottom 10 cities according to the 90/10 measure of wage inequality--with a breakdown of some of these higher-wage occupations in these urban areas. 


I don't have have any especially deep point to make about these differences between cities. The list of high-inequality urban areas perhaps helps to explain why the Occupy movement was especially prominent in eastern cities and in the San Francisco Bay Area. It's useful to remember that both the issues created by inequality, and the consequences of taking steps to address inequality, will not be perceived or felt equally across urban areas. 

Tuesday, September 22, 2015

A Growing Gap in Life Expectancy by Income

Rising inequality of incomes in the US is being accompanied by a rising gap in life expectancy by income category. Ronald Lee and Peter R. Orzag chaired a recent committee on behalf of the National Academies of Sciences, Engineering, and Medicine that explains these patterns in "The Growing Gap in Life Expectancy by Income: Implications for Federal Programs and Policy Responses." The analysis has broader implications for how one thinks about inequality,  and also specific implications for what this means about old-age support programs like Social Security and Medicare.

One baseline comparison in the report considers those born in 1930, and thus those who entered the labor market during the 1950s and later,with those who were born in 1960, and thus who entered the labor market in the relatively more unequal 1980s and later. The notion is to divide up the income distribution into fifths, or quintiles, based on household earnings from ages 41-50. (Using a decade of income evens out a lot of the year-to-year changes in income that can occur from unemployment.) Then compare life expectancies for the two groups. To be clear, this comparison involves some projections of what life expectancy will be for those who are still alive now, based on patterns of death-by-age up to this point. After all, those born in 1930 would be turning 85 this year, and those born in 1960 would be turning 55 this year.

Here's a comparison for men; green bars show values for those born in 1930; orange bars for those born in 1960. Notice that life expectancy rises with income level: that is, the green bars rise from left to right, and so do the orange bars. However, the gap between the green and orange bars is rising for higher levels of income. More specifically, tThe first bar on the left show that for those men who were born in 1930 and were in the lowest quintile of income for the decade leading up to when they turned 50, their life expectancy at age 50 was 26.6 years. For those born in 1960, the parallel calculation was a life expectancy at age 50 of 26.1 years--which given the uncertainties involved in these calculations can be viewed as basically equal values. However, for those in the top quintile of income, life expectancy at age 50 was 31.7 years for those born in 1930 and 38.8 years for those born in 1960.
Here's the parallel calculation for life expectancies of women. The patterns do differ in some ways. For example, for women born in 1930, life expectancy doesn't rise very much by income over the first four quintiles. However, the gap in life expectancies for those in the top quintile is clearly rising.

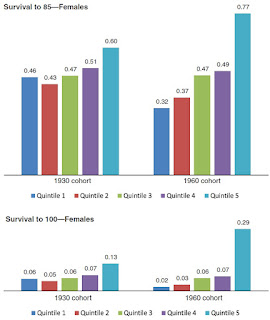
Here's an alternative way of illustrating these calculations using "survival rates"--that is, what share of those in a certain birth cohort will live to a certain age. The top panel shows that in 1930 and in 1960 about 26-27% of those in the bottom income quintile at age 50 survive to age 85. However, at the top income quintile, 45% of those in the 1930 cohort lived to age 85, and the projections are that 66% of those in the top quintile of the 1960 birth cohort will live to age 85.


Here are the survival rate patterns for women, again showing a substantial jump in life expectancies for the top quartile.


As the report acknowledges, the reasons for this growing gap in life expectancy by income are not altogether clear. Some explanations clearly aren't supported by facts. For example, although overall levels of tobacco use are down, the decline seems to have happened in much the same way across income levels, and thus can't explain the life expectancy factors. Obesity levels are up over time, but they seem to be up more among those with higher incomes, so that pattern doesn't explain a growing gap in life expectancy by income, either. One hypothesis recognizes that there is a correlation between education and health, and also between education and income, so perhaps factors related to education and health have become more important over time. For example, perhaps those with higher incomes are better at managing chronic diseases like high blood pressure or diabetes. But again, this is an open question. Other possible explanations are looking at how the nature of jobs and job stress may have changed over time for jobs of different income levels, or whether greater inequality in a society may create stresses that affect health.

Whatever the explanations underlying these patterns, there are some implications worth noting.

One is that although discussions of inequality in society often focus on income, this is of course only one potential dimension of inequality. Other dimensions might include the extent to which families have access to appliances like TV, dishwashers, smartphones; or the extent to which families have access to quality education or health care; or access to public facilities like parks and libraries. The fact that the gaps in life expectancy by income are rising over time is surely a major fact to be taken into account in any broader discussion of inequality.

Another implication involves government programs like Social Security and Medicare. These programs involve people paying into the system during their working lives, and then receiving benefits after they retire. However, if life expectancy for those with high incomes is systematically rising faster, then as a result these programs will tend to offer a substantially better deal for those with higher incomes than previously. Moreover, proposals to raise the age of eligibility for Social Security or Medicare will tend to help those with longer life expectancies--which is disproportionately those with higher incomes. In other words, the finding that life expectancy gaps by income are rising suggests that it would be appropriate to re-think contribution and benefit rates by income level for these old-age-support programs.


Monday, September 21, 2015

The Female/Male Wage Gap

Back in my college days in the late 1970s and early 1980s, the standard statistic was that the average pay of a full-time female worker was 59% of the pay for a male worker. Moreover, that proportion had barely changed over the previous two decades since the enactment of the Equal Pay Act of 1963. Now and again, you saw someone wearing a button to give some visibility to this statistic, like this one:


Here's the most recent data from the US Census Bureau showing the female-to-male earnings ratio from 1960 to 2014 with the red line. The left-hand part of the red line shows the ratio holding steady at about 59% up through 1980. Since then, the ratio has risen more-or-less steadily to its current level of 79%. The figure comes from Income and Poverty in the United States: 2014 , by Carmen DeNavas-Walt and Bernadette D. Proctor (September 2015, P60-252).


The historical patterns raise a number of questions, but here, I'll take a quick shot at two of them: 1) Why did the rise in the female-to-male ratio not start until around 1980? 2) Is the female-to-male ratio likely to level out around the current 79% or to keep rising?

With regard to the first question, there is little reason to believe that legal changes are responsible for why the female-to-male wage ratio started rising around 1980. Many feminists of my acquaintance would be hesitant to accept the proposition that the election of Ronald Reagan in 1980 finally triggered a stronger movement to gender wage equality. The proposed Equal Rights Amendment to the US constitution, which passed Congress in 1972, needed to be ratified by 38 states by 1982 in order to be added to the US Constitution, but fell short by three states.

A more plausible reason for why the 59% ratio remained constant through the 1960s and 1970s, and only started rising later, can be found in labor force participation rates. As the figure shows, the labor force participation rates for women (blue line) started rising sharply in the 1960s, while labor force participation rates for men had started a long-term decline.


As women entered the paid labor force in large numbers (of course, women had already been very equal participants in the unpaid labor force before this), they tended to end up in jobs that required little previous labor market experience and offered relatively low pay. In the meantime, as the labor force participation rate of men dropped, men with relatively low job skills and pay levels were more likely to exit the labor force. These contrasting changes in labor force participation patterns by gender help explain why the 59 percent ratio wasn't rising in the 1960s and 1970s (although I will say from personal experience that this argument was not especially welcome on college campuses circa 1980). After a greater share of women had established a foothold in the paid labor market and the average experience level of women had risen, the pay gap for men and women began to narrow.

My other question is whether the pay gap will continue to narrow over time. In more recent years, the labor force participation rates have shown a continuing downward trend for men, while topping and starting to decline for women. But the more important change in the last 10-20 years is in the underlying causes of the gender pay gap. Researchers can use statistical tools to look at measures of education, years of job market experience, job categories, and see if measures like these can help to explain the remaining female-to-male wage gap. A common finding in these kinds of studies is that the biggest part of the remaining female-to-male wage gap is related to children and families. To put it another way, the remainder of the gender gap is less about men vs. women, and more about mothers vs. non-mothers. For example, here's a 1998 study about the "family gap" from the Journal of Economic Perspectives (where I work as managing editor). Also, here's a prominent study looking at graduates from a high-ranking MBA program, which argues that men and women leave the MBA program on very similar earnings trajectories, but as many of the women become mothers, a gender pay gap emerges.

I have no desire to play at being an amateur sociologist/anthropologist/biologist and spout off on the subject of why women are more likely to end up doing child care than men. But I will say that as long as that pattern continues to hold, a gender pay gap will also continue to be apparent.


Friday, September 18, 2015

Ultra-low Interest Rates: Dangerous or Just a Price?

Two recent reports start by observing that long-term interest rates have been at extraordinarily rock-bottom levels for several years now. But from that common starting point, the analysis of the reports heads in different directions.

The Council of Economic Advisers in a July 2015 report called "Long-Term Interest Rates: A Survey," which notes at the start: "The long-term interest rate is a central variable in the macroeconomy. A change in the long-term interest rate affects the value of accumulated savings, the cost of borrowing, the valuation of investment projects, and the sustainability of fiscal deficits." Ultimately, the CEA report takes the position that the very low long-term interest rates are mostly a matter of supply and demand in the market for loanable funds--and in particular, the result of a high global supply of saving.

In contrast, the Bank of International Settlements in its 85th annual report expresses a concern that long-run interest rates at such low levels for such a long time are not a healthy development. For example, the BIS report states: "Our lens suggests that the very low interest rates that have prevailed for so  long may not be “equilibrium” ones, which would be conducive to sustainable and balanced global expansion. Rather than just reflecting the current weakness, low  rates may in part have contributed to it by fuelling costly financial booms and busts. The result is too much debt, too little growth and excessively low interest rates."

Of course, your view on these two perspectives will in substantial part determine your views about yesterday's decision by the Federal Reserve not to raise its target federal funds interest rate at this time. The short-term federal funds interest rate is a specialized market in which banks and big financial institutions make very short-term loans to each other. The Fed has held that short-term interest rate as near zero percent for seven years now, first as part of its efforts to ameliorate the 2007-2009 recession, and now as part of its effort not to disrupt an upswing. Changing short-run interest rates does not automatically lead to a one-for-one shift in long-run interest rates, because the long-run interest rates are affected by a wide array of supply and demand forces in capital markets. But central bank decisions about short-run rates do have an effect on long-run rates.

For factual background, the CEA report offers a basic graph showing real long-run interest rates, together with the inflation rate. The nominal rate is the rate that is typically quoted in a market transaction, like borrowing for a mortgage or what a bank pays on a savings account. The real interest rate is adjusted for inflation. Thus, a simplified way to think about the real interest rate is to take the nominal interest rate and subtract the inflation rate. But in the real world, this calculation can be more complex. If you consider an financial asset that pays a certain nominal interest rate over the next 10 or 20 or 30 years, you obviously don't know the rate of inflation in advance. When what the "real" interest rate will be is uncertain in the present, and various analytical complications ensue. In this diagram, the real interest rate is calculated by taking the interest rate on a 10-year Treasury bond and subtracting the average of current inflation and inflation during the previous five years. Thus, the implicit assumption here is that when investors purchase these bonds, and form a guess about what future inflation will be, they will look back at recent inflation experience for a guideline.


The CEA writes: "[T]he real 10-year interest rate has been on a steady decline since the mid-1980s, undergoing the longest sustained decline since 1876. ... The real interest rate has recently dipped into negative territory. Negative real interest rates have been observed previously in U.S. history and indeed have been much more negative—reaching almost negative 10 percent in the aftermath of World War I and negative 5 percent after World War II. In those episodes, the exceptionally negative real rate was a consequence of very high inflation. At the current time, it is the low nominal interest rate and not high inflation that is behind a negative real interest rate." Moreover, this decline in long-run interest rates isn't just in the US economy, but also has occurred in other high-income countries. In a globalizing economy, of course, with large international movements of capital, it's not a shock that long-run interest rates should tend to move together, too.

The CEA report offers a detailed and in places somewhat technical analysis of the determinants of long-run interest rates. Here are their key takeaways:

  • Long-term interest rates are lower now than they were thirty years ago, reflecting an outward shift in the global supply curve of saving relative to global investment demand. ...
  • Factors that are likely to dissipate over time—and therefore could lead to higher rates in the future—include current fiscal, monetary, and exchange rate policies; low-inflation risk as reflected in the term premium; and private-sector deleveraging in the aftermath of the global financial crisis.
  • Factors that are more likely to persist—suggesting that low interest rates could be a long-run phenomenon—include lower forecasts of global output and productivity growth, demographic shifts, global demand for safe assets outstripping supply, and the impact of tail risks and fundamental uncertainty.

For those not familiar with the Bank of International Settlements, it's been around since 1930. It's membership is made up of central banks, and it's mission is to provide a forum in which those central banks can discuss, collaborate, and interact.

 The factual starting point for the BIS report is the same as the CEA report, but the perspective is different. The BIS report opens in this way (references to graphs omitted):
Interest rates have never been so low for so long. They are low in nominal and real (inflation-adjusted) terms and low against any benchmark. Between December 2014 and end-May 2015, on average around $2 trillion in global long-term sovereign debt, much of it issued by euro area sovereigns, was trading at negative yields. At their trough, French, German and Swiss sovereign yields were negative out to a respective five, nine and 15 years. Such yields are unprecedented. Policy rates are even lower than at the peak of the Great Financial Crisis in both nominal and real terms. And in real terms they have now been negative for even longer than during the Great Inflation of the 1970s. Yet, exceptional as this situation may be, many expect it to continue. There is something deeply troubling when the unthinkable threatens to become routine.
The gist of the BIS report is that the ultra-low interest rates are being encouraged by central banks in pursuit of the short-run economic goal of stimulating their domestic economies. However, the BIS fears that the low interest rates are creating other dangers. Here are some of the concerns expressed by the BIS report:

Ultra-low long-term interest rates lead to disruptions in the rest of the financial system. As one example, pension funds can be much worse off. BIS writes:

"Such [low interest rates] rates sap banks’ interest margins and returns from maturity transformation, potentially weakening balance sheets and the credit supply, and are a source of major one-way interest rate risk. Ultra-low rates also undermine the profitability and solvency of insurance companies and pension funds. And they can cause pervasive mispricing in financial markets: equity and some corporate debt markets, for instance, seem to be quite stretched. Such rates also raise risks for the real economy. ...  Over a longer horizon, negative rates, whether in inflation-adjusted or in nominal terms, are hardly conducive to rational investment decisions and hence sustained growth."
Another risk is that when low long-term interest rates make borrowing very cheap, it often seems easier for government to address their structural budgetary and economic issues by borrowing more, rather than, well, actually trying to fix them. In the euro area, for example, a focus on how to borrow more and restructure govenment debts in that way seems easier, while dealing with the underlying economic issues underpinning the problems of the euro gets continually postponed. Yet another issue is that low interest rates in high-income countries raise economic risks in emerging markets.
 "As monetary policy in the core economies has pressed down hard on the accelerator but failed to get enough traction, pressures on exchange rates and capital flows have spread easy monetary and financial conditions to countries that did not need them, supporting the buildup of financial vulnerabilities. A key manifestation has been the strong expansion of US dollar credit in EMEs [emerging market economies], mainly through capital markets. The system’s bias towards easing and expansion in the short term runs the risk of a contractionary outcome in the longer term as these financial imbalances unwind. ... One thing is for sure: gone are the days when what happened in EMEs largely stayed there."
Notice that none of the BIS concerns are about the risk of a rise in inflation--which it does not think of as a substantial risk. However, the BIS makes a discomfiting comparison. Before the financial crisis, interest rates were low to stimulate the economy and inflation was also low. As we all now know, financial imbalances were building up, in a way that brought a deep recession to the high-income countries around the world. Now, we are again in an environment of low interest rates to stimulate the economy together with low inflation. The argument at the Federal Reserve and other central banks for today's low interest rates is that they are needed because of events that were triggered in part by the low interest rates before the financial crisis. The BIS writes:

After all, pre-crisis, inflation was stable and traditional estimates of potential output proved, in retrospect, far too optimistic. If one acknowledges that low interest rates contributed to the financial boom whose collapse caused the crisis, and that, as the evidence indicates, both the boom and the subsequent crisis caused long-lasting damage to output, employment and productivity growth, it is hard to argue that rates were at their equilibrium level. This also means that interest rates are low today, at least in part, because they were too low in the past. Low rates beget still lower rates. In this sense, low rates are self-validating. Given signs of the build-up of financial imbalances in several parts of the world, there is a troubling element of déjà vu in all this.
The BIS report raises the uncomfortable question of whether we are riding a merry-go-round in which sustained ultra-low interest rates bring financial weakness in various forms, and then the financial weakness is the justification for continuing ultra-low interest rates.

Thursday, September 17, 2015

Empathy for the Poor: A Meditation with Charles Dickens

Each year, the US Census Bureau publishes a report with percentage of Americans living in households with incomes below the official poverty line. The most recent update is Income and Poverty in the United States: 2014 , by Carmen DeNavas-Walt and Bernadette D. Proctor (September 2015, P60-252). Here, let me offer a few of he headline findings from the US Census Bureau, and then skip to some thoughts inspired by Charles Dickens about how society views the poor.

The US Census Bureau reports that 46.7 million--that is, 14.8% of Americans--were below the US poverty line in 2014, which is not significantly different from 2013.


The thresholds of income for being below the poverty line depend on how many adults and children live in a household. Here are the poverty thresholds from the US Census Bureau.

Finally, the age distribution of poverty has evolved over time. Back in the 1960s, those above age 65 were more likely to fall below the poverty line. Now, it's children under the age of 18 who are most likely to fall below the poverty line. (And remember, because the poverty line doesn't take noncash government support programs into account, the value of Medicare coverage to the elderly isn't part of this poverty rate calculation.)


In years past, I've reviewed some of the arguments and issues about how this poverty line is measured. For example, the official poverty line is based on after-tax income, and so it does not include the value of noncash government programs to assist the poor like Medicaid and Food Stamps. If one calculates a poverty rate based on consumption, rather than on income level, it looks as if the actual poverty line is much closer to zero. But in some ways, discussions of poverty always need to need to start with the attitude that one takes toward the poor.

As a conversation starter on the subject, here's a short essay from Charles Dickens. It was published in a magazine called All the Year Round that Dickens edited during the 1860s. This particular essay, "Temperate Temperance," appeared in the issue of March 18, 1863. The articles in the magazine did not name its authors , but a group of Australian researchers attributed it to Dickens by using "computational stylistics"--which is basically using a computer analysis of the style of the writing and comparing it to manuscripts whose authorship is known to determine the author. The entire essay is short and readable, but here are two quick excerpts that jumped out at me.

Asking the poor to change their habits is asking a very great deal. Here's Dickens:
"Heaven knows, the working classes, and especially the lowest working classes, want a helping hand sorely enough. No one who is at all familiar with a poor neighbourhood can doubt that. But you must help them judiciously. You must look at things with their eyes, a little; you must not always expect them to see with your eyes. The weak point in almost every attempt which has been made to deal with the lower classes is invariably the same — too much is expected of them. You ask them to do, simply the most difficult thing in the world — you ask them to change their habits ... and to abandon habits and make great efforts is hard work even for clever, good, and educated people."
There is a tendency to treat the poor as if the most central part of their identity was a criminal, a substance-abuser, or extreme immaturity. None of these reactions is appropriate or useful. Dickens writes:
There must be none of that Sunday-school mawkishness, which too much pervades our dealings with the lower classes; and we must get it into our heads — which seems harder to do than many people would imagine — that the working man is neither a felon, nor necessarily a drunkard, nor a very little child. ... There is a tendency in the officials who are engaged in institutions organised for the benefit of the poor, to fall into one of two errors; to be rough and brutal, which is the Poor-law Board style; or cheerfully condescending, which is the Charitable Committee style. Both these tones are offensive to the poor, and well they may be. ... Who has not been outraged by observing that cheerfully patronising mode of dealing with poor people which is in vogue at our soup-kitchens and other depôts of alms? There is a particular manner of looking at the soup through a gold double eye-glass, or of tasting it, and saying, " Monstrous good — monstrous good indeed; why, I should like to dine off it myself!" which is more than flesh and blood can bear.
And here's the full 1863 essay.
TEMPERATE TEMPERANCE
WE want to know, and we always have wanted to know, why the English workman is to be patronised? Why are his dwelling-place, his house-keeping arrangements, the organisation of his cellar, and his larder — nay, the occupation of his leisure hours even — why are all these things regarded as the business of everybody except himself? Why is his beer to be a question agitating the minds of society, more than our sherry? Why is his visit to the gallery of the theatre, a more suspicious proceeding than our visit to the stalls? Why is his perusal of his penny newspaper so aggravating to the philanthropical world, that it longs to snatch it out of his hand and substitute a number of the Band of Hope Review?
It is not the endeavour really and honestly to improve the condition of the lower classes which we would discourage, but the way in which that endeavour is made. Heaven knows, the working classes, and especially the lowest working classes, want a helping hand sorely enough. No one who is at all familiar with a poor neighbourhood can doubt that. But you must help them judiciously. You must look at things with their eyes, a little; you must not always expect them to see with your eyes. The weak point in almost every attempt which has been made to deal with the lower classes is invariably the same — too much is expected of them. You ask them to do, simply the most difficult thing in the world — you ask them to change their habits. Your standard is too high. The transition from the Whitechapel cellar to the comfortable rooms in the model-house, is too violent; the habits which the cellar involved would have to be abandoned; a great effort would have to be made; and to abandon habits and make great efforts is hard work even for clever, good, and educated people.
The position of the lowest poor in London and elsewhere, is so terrible, they are so unmanageable, so deprived of energy through vice and low living and bad lodging, and so little ready to second any efforts that are made for their benefit, that those who have dealings with them are continually tempted to abandon their philanthropic endeavours as desperate, and to turn their attention towards another class: those, namely, who are one degree higher in the social scale, and one degree less hopeless.
It is proposed just now, as everybody knows, to establish, in different poor neighbourhoods, certain great dining-halls and kitchens for the use of poor people, on the plan of those establishments which have been highly successful in Glasgow and Manchester. The plan is a good one, and we wish it every success — on certain conditions. The poor man who attends one of these eating-houses must be treated as the rich man is treated who goes to a tavern. The thing must not be made a favour of. The custom of the diner-out is to be solicited as a thing on which the prosperity of the establishment depends. The officials, cooks, and all persons who are paid to be the servants of the man who dines, are to behave respectfully to him, as hired servants should; he is not to be patronised, or ordered about, or read to, or made speeches at, or in any respect used less respectfully than he would be in a beef and pudding shop, or other house of entertainment. Above all, he is to be jolly, he is to enjoy himself, he is to have his beer to drink; while, if he show any sign of being drunk or disorderly, he is to be turned out, just as I should be ejected from a club, or turned out of the Wellington or the Albion Tavern this very day, if I got drunk there.
There must be none of that Sunday-school mawkishness, which too much pervades our dealings with the lower classes; and we must get it into our heads — which seems harder to do than many people would imagine — that the working man is neither a felon, nor necessarily a drunkard, nor a very little child. Our wholesome plan is to get him to co-operate with us. Encourage him to take an interest in the success of the undertaking, and, above all things, be very sure that it pays, and pays well, so that the scheme is worth going into without any philanthropic flourishes at all. He is already flourished to death, and he hates to be flourished to, or flourished about. 
There is a tendency in the officials who are engaged in institutions organised for the benefit of the poor, to fall into one of two errors; to be rough and brutal, which is the Poor-law Board style; or cheerfully condescending, which is the Charitable Committee style. Both these tones are offensive to the poor, and well they may be. The proper tone is that of the tradesman at whose shop the workman deals, who is glad to serve him, and who makes a profit out of his custom. Who has not been outraged by observing that cheerfully patronising mode of dealing with poor people which is in vogue at our soup-kitchens and other depôts of alms? There is a particular manner of looking at the soup through a gold double eye-glass, or of tasting it, and saying, " Monstrous good — monstrous good indeed; why, I should like to dine off it myself!" which is more than flesh and blood can bear.
We must get rid of all idea of enforcing what is miscalled temperance — which is in itself anything but a temperate idea. A man must be allowed to have his beer with his dinner, though he must not be allowed to make a beast of himself. Some account was given not long since, in these pages, of a certain soldiers' institute at Chatham; it was then urged that by all means the soldiers ought to be supplied with beer on the premises, in order that the institution might compete on fair terms with the public-house. It was decided, however, by those in authority, or by some of them, that this beer was not to be. The consequence is, as was predicted, that the undertaking, which had every other element of success, is very far from being in a flourishing condition. And similarly, this excellent idea of dining-rooms for the working classes will also be in danger of failing, if that important ingredient in a poor man's dinner — a mug of beer — is not to be a part of it.
The cause of temperance is not promoted by any intemperate measures. It is intemperate conduct to assert that fermented liquors ought not to be drunk at all, because, when taken in excess, they do harm. Wine, and beer, and spirits, have their place in the world. We should try to convince the working man that he is acting foolishly if he give more importance to drink than it ought to have. But we have no right to inveigh against drink, though we have a distinct right to inveigh against drunkenness. There is no intrinsic harm in beer; far from it; and so, by raving against it, we take up a line of argument from which we may be beaten quite easily by any person who has the simplest power of reasoning. The real temperance cause is injured by intemperate advocacy; and an
argument which we cannot honestly sustain is injurious to the cause it is enlisted to support. Suppose you forbid the introduction of beer into one of these institutions, and you are asked your reason for doing so, what is your answer? That you are afraid of drunkenness. There is some danger in the introduction of gas into a building. You don't exclude it; but you place it under certain restrictions, and use certain precautions to prevent explosions. Why don't you do so with beer?

For those with a taste for this subject, last year when the Census Bureau released its poverty line statistics I discussed a passage from George Orwell's 1937 book, The Road to Wigan Pier, which details the lives of the poor and working poor in northern industrial areas of Britain like Lancashire and Yorkshire during the Depression. Orwell is writing from a leftist and socialist perspective, with deep sympathy for the poor. Bur Orwell is also painfully honest: for example, he laments that the poor make such rotten choices about food--but then he also points out how unsatisfactory it feels to patronizingly tell those with low incomes how to spend what little they have. Indeed, as I pointed out last year, there's some evidence in the behavioral economics literature that poverty can encourage some of the behaviors, like a short-run mentality, which can then tend to perpetuate poverty.

Tuesday, September 15, 2015

Remembering 2008: It Could Have Been Another Depression

Imagine that you take an action to prevent an event from happening, and as it turns out, the event doesn't happen. Did your action prevent the event, or was your action unnecessary--at least to some extent?

For example, the US spends about $100 billion per year in fighting terrorism. It's very difficult to figure out if the anti-terrorism spending was justified, or some of it was over-the-top.  All we know is that we have not had a major terrorist attack on US soil since September 11, 2001. Or imagine that those concerned about climate change were able to enact a comprehensive anti-carbon agenda. Say further that the costs of doing so were high, and that the standard of living both in high-income and low-income countries was lower as a result, but the predicted perils of climate change didn't occur. It would be difficult to figure out if the actions were justified, or excessive. All we would observe is that a potential harm did not occur.

Seven years ago in September 2008, the US economy suffered what I think of as a near-meltdown. Some key events of that month included the Lehman Brothers investment bank going broke; the government-sponsored mortgage enterprises Fannie Mae and Freddie Mac going broke; the insurance company AIG getting an $85 billion credit line; a huge money market fund, the Reserve Primary Fund, announcing that it had lost money, leading to a run on money market funds; and the Troubled Asset Relief Program (TARP) being introduced in Congress (and being enacted in early October).
The policy response in the months that followed included a number of extreme actions: for example, the Federal Reserve holding its target interest rate at near-zero levels for seven years, while buying several trillion dollars of Treasury bonds and mortgage-backed debt; monumentally large budget deficits by the US government; and bailout loans and investments extended to certain banks, insurance companies like AIG, and auto companies like GM and Chrysler.

The claim is that these and other extreme actions were needed to avert what could have turned into another Great Depression. But although the US economy experienced a Great Recession from 2007-2009 and what is sometimes called the "long slump" of sluggish growth that has followed, a Great Depression didn't actually recur. So how can we judge whether the extreme actions were indeed necessary?

Jason Furman, chair of the Council of Economic Advisers, takes a shot at this question in a September 9, 2015 speech, "It Could Have Happened Here:The Policy Response That Helped Prevent a Second Great Depression."  Furman writes:
With the unemployment rate at 5.1 percent it has become easy to forget just how close our economy came to the brink seven years ago. But during the Great Recession, comparisons to the Great Depression were by no means hyperbolic. I remember sitting in my West Wing office in early 2009 looking each day at a chart comparing the U.S. stock market in the wake of the financial crisis to previous corrections. And each day added a new point to the graph heading directly on the same trajectory as 1929 and considerably worse than every other episode. 
Furman offers a series of graphs showing the stock market, household net worth, housing prices, bond yields, unemployment rates, and flows of international trade to back up his argument that for a time in late 2008 and into 2009, the US economy appeared to be on a Great Depression track. But during the Great Depression, unemployment reached 25% and the rate of deflation (that is, negative inflation) was more than 9% in 1931 and 1932, and 5% in 1933. By comparison with that catastrophe, the Great Recession has been mild.

Furman offers an argument that the various monetary, fiscal, and other policies enacted since 2009 are responsible for avoiding a Great Depression. I fear that in some places, his argument comes close to this syllogism: 1) Steps were taken; 2) A Depression didn't recur; 3) The steps worked. As noted above, this case is very difficult to prove. My own sense is that some steps were more defensible than others at the time, and that some steps that made good sense in the few months after September 2008 might not have continued to make sense several years later.

But my point here is not to parse the details of economic policy over the last seven years. Instead, it is to say that I agree with Furman (and many others) on a fundamental point: The US and the world economy was in some danger of a true meltdown in September 2008. Here are a few of the figures I used to make this point in lectures, some of which overlap with Furman's figures. The underlying purpose of these kinds of figures is to show the enormous size and abruptness of the events of 2008 and early 2009--and in that way to make a prima facie case that the US economy was in severe danger at that time.

Let's start with a couple of figures related to real estate. The blue line shows a national index of home prices, and how they rose with time. The red line shows the inflation rate. These two lines are set so as to have a base value of 100 in the year 2000, and then to change relative to that base year. The figure shows that housing prices rose pretty much in line with overall rates of inflation in the 1970s, 1980s, and 1990s. But around 2000, the jump in housing prices relative to inflation rates--followed by the subsequent fall--stands out.


With these changes, the value of household owner's equity in real estate rose from about $6 trillion in 1999, to $13,3 trillion in the first quarter of 2006, and then fell back to about $6 trillion by the first quarter of 2009. The value of household owner's equity in real estate stayed around $6 trillion through 2011, before starting to rise again. My preference is to put these numbers in the context of the broader economy: that is, to divide the total value of household owner's equity in real estate by the size of the GDP. That calculation produces this figure, which shows that relative to GDP, the value of household equity rose well above its usual historical levels during the bubble, then fell below its usual historical levels, and now is back in more-or-less the historical range. But look at that precipitous drop!


The fall in housing prices meant problems for the banking sector. It was clear that many housing loans previously viewed as safe weren't going to be repaid. Moreover, economic prospects looked grim. Banks were terrified to lend. Here's a graph of net lending by the financial sector taken from the CBO's January 2011 Budget and Economic Outlook: Fiscal Years 2011 to 2021 (p. 33). Net lending is new loans minus repayments and write-offs of bad loans. The historical pattern is that during recessionary periods in the past, there was sometimes a quarter or two where lending turned negative for US banks or for money market funds. But for the US financial sector as a whole, net lending was positive every single quarter from 1950 up to 2008, when it veers wildly from more than 10% of GDP on the positive side to a decline of 10% of GDP on the negative side. This enormous change shows an almost paralyzing fear of lending in the US financial sector.


A similar near-vertical decline happens at the international level. Here's a figure showing the net inflow of capital into the US economy since 1995. The US economy had become used to inflows of foreign capital. During the seemingly easy money to be made in the US economy during the go-go days of the housing market bubble, the inflows exceeded $700 billion per quarter for a time in early 2007.  Again, watch the capital inflows plummet and then turn negative into capital outflows. The world was pulling its money out of the staggering US economy, too.


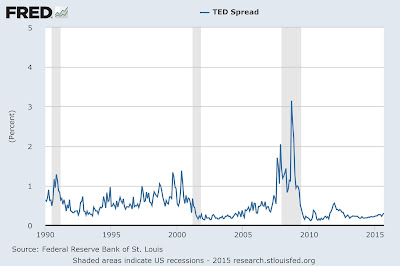
Finally, a standard measure of fear in the banking and financial sector is known as the TED spread. You calculate this measure by subtracting two interest rates. One interest rate is called the London Interbank Offer Rate, or LIBOR for short. It's the interest rate at which big international banks borrow overnight from each other. Because these are big banks and the loans are extremely short-term, such loans are usually viewed as very safe and the LIBOR rate is usually low. The other interest rate is the 3-month Treasury bill rate--that is, the rate paid by the US federal government for short-term borrowing. These two interest rates are usually pretty similar. The LIBOR interest rate is a bit  higher, because borrowing by a bank, even a well-established bank, has larger than US government borrowing. However, the two rates usually move pretty closely.


But in fall 2007, and then again in September 2008, a large gap suddenly emerges between the LIBOR interest rate and the three-month T-bill interest rate. The risks of lending between big banks, even on a very short-term basis, are suddenly looking larger and rising. If you are staring at this graph in September 2008, as it shoots up, it looks frighteningly like it could be heading toward a breakdown of the global financial system, loosely defined as a situation where banks become unwilling to deal with each other without high transactions costs, because all other banks are perceived as too risky.

As I've said several times already, these kinds of graphs don't prove that a Great Depression definitely would have happened in 2009 or 2010 without the government interventions that did occur. When something doesn't happen, you can't prove that it would have happened.  But consider the situation of September 2008 as a matter of probabilities. Say that there was "only" a 10% chance of global financial meltdown, or a 20% or 30% chance. For me, that risk is plenty high enough to justify some extreme policy actions. It's why I'm reluctant to criticize too strongly the decisions made by policy-makers from September 2008 through mid-2009. It's impossible to know how close the US economy came to a true Depression, but it was a genuine and legitimate worry at the time.

Thursday, September 10, 2015

Costs of Regulation: Higher Education Edition

As a social scientist, I'm predisposed to favor collecting and disseminating more information. But a February 2015 Report of the Task Force on Federal Regulation of Higher Education, called Recalibrating Regulation of Colleges and Universities, offers a useful reminder that producing all that information isn't free.

As background, the task force was created by a bipartisan group of US Senators. It was made up mostly of presidents and chancellors and top executives from a range of higher education institutions, including the University of Maryland, Vanderbilt University, Colorado Christian University,University of Colorado, Hiram College, Hartwick College, Sam Houston State University, California Community College, Laureate Online Education, American University, Rasmussen College, North Carolina Agricultural and Technical State University, Tennessee Independent Colleges and Universities Association, University of North Carolina, and Northern Virginia Community College.

As you might expect from such an authorship, the report includes lots of terms like consolidate, promulgate, problematic, and process improvements. But more to my taste, the report also has some intriguing big-picture estimates and vivid examples. For example, one estimate is that costs of compliance with federal rules represent more than 10% of total costs at a major university:
Another far-reaching analysis was launched by Vanderbilt University in 2014. Initial findings reveal that approximately 11 percent, or $150 million, of Vanderbilt’s 2013 expenditures were devoted to compliance with federal mandates. Nearly 70 percent of these costs were absorbed into different offices, affecting a broad swath of faculty, research staff, administrative staff, and trainees in academic departments. Vanderbilt is currently working with other institutions to test its methodology on different campuses.
The report laments that federal regulatory burdens on institutions of higher education keep rising, that the process for judging whether institutions are complying with these burdens is often capricious and costly as well, and that in many cases the rules have little to do with actually educating students. Here's a taste of the discussion:
Two examples highlight the increasing complexity of the Department of Education’s reach. First, in the early 1950s, accrediting agencies qualified for recognition by the U.S. Office of Education by meeting five straightforward criteria. Today, however, statutory requirements fill nine pages of the HEA, and the Department’s application for agencies seeking recognition has expanded to 88 pages. Any agency that seeks initial or renewed recognition must expect to devote several person years to filing the appropriate federal paperwork. Another example is the expansion of data collection mandates imposed on colleges and universities. The Integrated Postsecondary Education Data Survey (IPEDS) was first implemented as a voluntary activity in 1985-86. Today, participation in IPEDS is mandatory and requires completion of nine separate surveys that together exceed 300 pages. ...
Higher education institutions are subject to a massive amount of federal statutory, regulatory, and sub-regulatory requirements, stemming from virtually every federal agency and totaling thousands of pages. Focusing solely on requirements involving the Department of Education, the HEA contains roughly 1,000 pages of statutory language; the associated rules in the Code of Federal Regulations add another 1,000 pages. Institutions are also subject to thousands of pages of additional requirements in the form of sub-regulatory guidance issued by the Department. For example, the Department’s 2013-14 Federal Student Aid Handbook, a guidebook for administering student aid that amplifies and clarifies the formal regulations, is more than 1,050 pages. The Department’s Handbook for Campus Safety and Security Reporting (also known as the “Clery Handbook”) contains approximately 300 pages, and will soon expand significantly in light of new regulations issued in 2014. In 2012 alone, the Department released approximately 270 “Dear Colleague” letters and other electronic announcements—this means that more than one new directive or clarification was issued every working day of the year. ...
Among the many federal rules with which colleges and universities must comply, information disclosure mandates are particularly voluminous. Section 485 of the HEA, which details institutional disclosures on a host of issues, runs some 30 pages of legislative text and includes 22 separate “information dissemination” requirements. ... The Federal Student Aid office at the Department publishes a summary chart of the various consumer information disclosures. Although this chart is designed to provide consumer disclosures “At-a-Glance,” it is currently 31 pages long. Between crime reporting and policy disclosures, the Clery Act and related departmental guidance require more than 90 separate policy statements and disclosures. In sum, the sheer number of regulatory provisions that affects institutions of higher education constitutes a voluminous and expanding burden.

In a number of cases, attempts to define a certain rule never seem to end, but instead only lead to more rules. For example, consider the rules for disclosing whether vocationally-oriented programs lead to "gainful employment":
[W]ith respect to gainful employment, the Department first issued a complex and lengthy set of rules on this topic in 2010. However, following a court challenge that struck down the Department’s proposed metrics for judging gainful employment programs, it began a new negotiated rulemaking session. Final regulations stemming from this second effort were issued in October 2014. The 2014 final rule is almost 950 pages long, including a 610-page preamble and more than 50 tables and charts. In deciding to proceed with a second rulemaking on this topic, the Department was undeterred by both a federal court decision and by the passage of legislation in the House of Representatives blocking further regulation in this area until Congress considered the issue. 
Or consider the Clery Act, which "requires colleges and universities to report the crimes that occurred on campus in an Annual Security Report. They also must report incidents occurring on “noncampus property,” defined as a building or property owned or controlled by an institution and used in direct support of or in relation to the institution’s educational purpose. However, this broad definition has created enormous confusion," as the report spells out:

Guidance from the Department both in the Handbook for Campus Safety and Security Reporting and subsequent directives indicate that colleges and universities must report crimes that happen in any building or property they rent, lease, or have any written agreement to use (including an informal agreement, such as one that might be found in a letter, email, or hotel confirmation). Even if no payment is involved in the transaction, any written agreement regarding the use of space gives an institution “control” of the space for the time period specified in the agreement. The handbook requires colleges and universities to disclose statistics for crimes that occur during the dates and times specified in the agreement, including the specific area of a building used (e.g., the third floor and common areas leading to the spaces used, such as the lobby, hallways, stairwells, and elevators). Department guidance mandates that schools report on study abroad locations when the school rents space for students in a hotel or other facility, and on locations used by an institution’s athletic teams in successive years (e.g., the institution uses the same hotel every year for the field hockey team’s away games). As a consequence, institutions must attempt to collect crime data from dozens, if not hundreds, of locations ... One institution has indicated that it requests data from 69 police departments, covering 348 locations in 13 states and five countries, including police at airports and on military bases. The mandate that colleges and universities must collect data from foreign entities is particularly troublesome. ... In response to one such request, a foreign government accused a U.S. institution of espionage.

The Task Force also notes that certain substantial federal rules don't have much to do with evaluating education, or with health and safety of students, but the rules were instead enacted for other reasons--while requiring colleges to pay the costs.
However, an increasing amount of federal oversight has little to do with these responsibilities and has more to do with pursuing broader governmental goals. To cite several obvious examples, Selective Service registration, detailed voter registration requirements, peer-to-peer file sharing, and foreign gift reporting are unrelated to the central areas of federal concern in higher education. While the policy objectives are worthwhile, the responsibility for pursuing them should not fall to institutions. We believe, for example, that individuals should be held accountable for whether they register with the Selective Service, not the college or university where they happen to be enrolled. Further, while some rules may be tangentially related to higher education, such as disclosing institutional policies on candles in dormitories and student vaccinations, they are not of sufficiently widespread interest to warrant a federal mandate.
The high costs of federal regulation are clearly a real and substantial issue for higher education, contributing to the very high costs of higher education. But don't forget broaden your view and remember that these kinds of government rules about collecting and providing information are legion across the US economy, too. I do love information, as I said at the start. But it's very easy to come up with reasons why other organizations should collect all kinds of information. Such requirements aren't free.


Wednesday, September 9, 2015

Dementia Care: A Shift to Paid Support?

The economic burden of dementia care is already enormous, and will only rise further as the population ages. In "Improving Long-Term Care Dementia: A Policy Blueprint," a report for the Rand Corporation, Regina A. Shih, Thomas W. Concannon, Jodi L. Liu, and Esther M. Friedman consider what might be done to improve care. Let's start with a bit of background (footnotes omitted):
Dementia is a debilitating and progressive condition that affects memory and cognitive functioning, results in behavioral and psychiatric disorders, and leads to decline in the ability to engage in activities of daily living and self-care. In 2010, 14.7 percent of persons older than age 70 in the United States had dementia. With the expected doubling of the number of Americans age 65 or older from 40 million in 2010 to more than 88 million in 2050, the annual number of new dementia cases is also expected to double by 2050, barring any significant medical breakthroughs. Alzheimer’s disease, which accounts for 60 to 80 percent of dementia cases, is the sixth leading cause of death in the United States overall and the fifth leading cause of death for those age 65 and older. Additionally, recent research suggests that deaths attributable to Alzheimer’s disease might be underreported such that it could be the third leading cause of death overall. It is the only cause of death among the top ten in the United States without a way to prevent it, cure it, or even slow its progression.
Dementia is already the medical condition that imposes the highest annual cost in terms of market cost of services provided, ahead of cancer and heart disease. These market costs don't include the costs of care provided by family and friends, which in the case of dementia could double the total costs.

The data in the report suggests that there is going to be a substantial shift in dementia care over the next few decades. The number of people with dementia is going to rise more than the number of potential family caregivers. Thus, it seems likely to me that as a society we are going to shift toward paid caregivers for dementia.

Most of the burden of caring for people with dementia is shouldered by family and friends. More than 15 million Americans currently provide family care to relatives or friends with dementia. These family caregivers typically shoulder a heavy burden: Nearly 40 percent reported quitting jobs or reducing work hours to care for a family member with dementia. Many of these caregivers also experience negative physical and mental health effects. ...
With respect to formal care, about 70–80 percent of those who provide LTSS [long-term services and supports] are direct care workers, including nursing aides, home health aides, and home- or personal-care aides. This workforce benefits substantially from training in how to manage behavioral symptoms related to dementia. Inadequate training for dementia in the direct care workforce has been identified as a main contributor to poor quality of care, abuse, and neglect in nursing homes. Another significant gap in the LTSS workforce stems from the growing imbalance between the demand for—and supply of—qualified paid workers. This shortage results from high turnover and difficulty attracting qualified workers. Shortfalls in this workforce are often filled via the “gray market,” meaning that untrained, low-cost caregivers are hired, leaving older adults vulnerable to poor or unregulated quality of care. ... As one indicator of the greater need for formal care among persons with dementia, 48.5 percent of nursing home residents and 30.1 percent of home health patients in 2012 had dementia. ... The Alzheimer’s Association has estimated that the average per-person Medicaid spending for Medicare beneficiaries age 65 and older with dementia is 19 times higher than the average per-person Medicaid spending for comparable Medicare beneficiaries without dementia. ...
Demographic trends suggest that the current heavy reliance on family caregiving is unsustainable. As the median age of the U.S. population, including baby boomers, trends upward, there will be a growing imbalance between the number of people needing care and family caregivers available to deliver it. To illustrate, the AARP Public Policy Institute estimates that the ratio of caregivers aged 45–64 to each person aged 80 and older who needs LTSS will decline from 7:1 in 2010 to less than 3:1 in 2050. ... In addition, life expectancies have increased so that it is possible for two generations within one family to be living with dementia at the same time.
The report has lots of worthy and sensible recommendations focused on improving the quality of care for dementia: more outreach and education for the public and caregivers on recognizing symptoms of dementia; access to training and perhaps also some financial support for informal caregivers; better training, pay and coordination for formal caregivers; expanding home and community-based services where possible, and coordinating these with each other and with institutional care as needed; and more research into possibilities for prevention and treatment.

But this report ducks the hard question of costs. The report has some short comments about encouraging more long-term care insurance, whether through linkages to current health insurance, or through public/private partnerships of some kind, or through a national single-payer system. But the hard fact here is that the costs of dementia care--again, which is already the single most expensive medical condition--are going to grow very rapidly in the next few decades. Many elderly persons and going to face crushing financial costs, and their families are going to face costs of both money and time. I suspect that the demands for government financial and regulatory interventions in the area of long-term care for those with dementia are going to become very powerful. It's high time to start thinking about what policy options make more sense that others.

Tuesday, September 8, 2015

Snapshots of Foreign Direct Investment Flows

The canonical source for data on flows of foreign direct investment are the reports from the United Nations Conference on Trade and Development, more commonly known as UNCTAD. It's World Investment Report 2015 provides a discussion of trends up through last year.

To interpret these patterns, it's important to remember how foreign direct investment, or FDI, differs from "portfolio investment." Portfolio investment involves foreign investment that do not involve any kind of management voice. Thus, buying debt issued in another country is counted as portfolio investment, as is buying a mutual fund of stocks of firms from another country. By contrast, UNCTAD defines foreign direct investment in this way:
FDI refers to an investment made to acquire lasting interest in enterprises operating outside of the economy of the investor. Further, in cases of FDI, the investor´s purpose is to gain an effective voice in the management of the enterprise. ... Some degree of equity ownership is almost always considered to be associated with an effective voice in the management of an enterprise; the BPM5 [Balance of Payments Manual: Fifth Edition] suggests a threshold of 10 per cent of equity ownership to qualify an investor as a foreign direct investor.
Thus, FDI matters not just because of the financial size of the flows, but also because it often involves a transfers of managerial or technological expertise, or a commercial buying-or-selling connection. FDI can often be part of global value chain connections across the world economy.

FDI inflows to developed economies have been quite volatile over the past two decades. In contrast, inflows to developing economies have risen much more steadily--and indeed, inflows of FDI to developing countries were more than half of global FDI inflows in 2014.

What are the economies receiving the lion's share of these FDI inflows? For those who think of China's economy as largely closed to outside investment, it's interesting that China and Hong Kong are at the top for size of FDI inflows in 2014. The US, the UK, and Canada also rank highly, in part because of how these economies often see FDI investments back and forth among their borders.


What about outflows of FDI? Here, the story is that the share of FDI outflows from developing economies has been rising, both as an overall amount and as a proportion of the total, and now constitutes about one-third of all FDI outflows.

What countries mainly account for FDI outflows? It's perhaps no surprise to see the US, China, and Hong Kong near the top of the list. However, developed economies like Japan, Germany, Canada, and France play a substantial role in outflows of FDI, too.