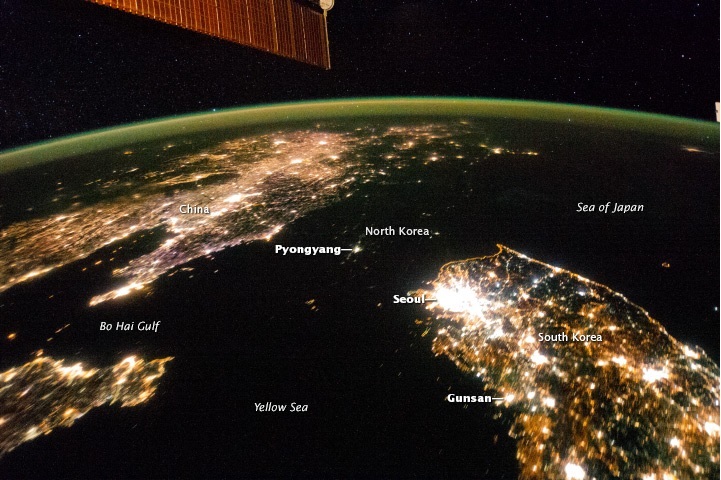
The possibilities of using imagery from the sky for illustrating economic differences has been apparent for some years. Two of the most prominent examples involve national borders: South and North Korea at night, and Haiti and the Dominican Republic in the daylight.
Here's a NASA photograph from 2014 of North and South Korea. For those of you whose Asian geography is a little shaky, these two Koreas countries sit on a peninsula, which is attached to China. In the bottom right of the picture is South Korea. The giant city of Seoul is the brightest light. while smaller cities like Gunsan show up as smaller areas of light. In the upper right portion of the photo is China. The dark area between the two--the land mass between the Yellow Sea and the Sea of Japan--is North Korea, whose capital city of Pyongyang appears as a very small illuminated dot. This picture is clearly telling something about electricity availability and consumption, and also about broader standard of living, in North Korea.
Here's some NASA imagery of the border between Haiti and the Dominican Republic, which share the island of Hispaniola. The Haiti side is deforested, almost denuded; the Dominican Republic side is not. The causes of deforestation are typically a combination very poor people looking for any firewood to burn and overgrazing of livestock. Again, this image tells you something about standard of living and goverance in two neighboring countries.

"Much of the publicly available satellite imagery used by economists provides readings for each of the hundreds of billions of 30-meter-by-30-meter grid cells of land surface on Earth. Many economic decisions (particularly land use decisions such as zoning, building types, or crop choice) are made at approximately this same level of spatial resolution. But since 1999, private companies have offered submeter imagery and, following a 2014 US government ruling, American companies are able to sell imagery at resolutions below 0.5 meters to nongovernment customers for the first time. This is important because even when a coarser unit of analysis is appropriate, 900 1-meter pixels provide far more information available for signal extraction than a single 30-meter pixel covering the same area."Satellite imagery is of course not primarily about pretty photographs, but can gather a range of images across the spectrum. Machine learning and artificial intelligence can be used to categorize this data. Advances in computing power and clever algorithms for dealing with "gridded" data are making it possible to process all this information and to analyze it. The results provide a window on economic activity that is outside the traditional economic data.
For example, in a lot of places the story from "night lights" may tell you as much about GDP or economic growth as any official government statistics. They write:
"In an annual panel of countries from 1992 to 2008, as well as the corresponding long difference, these authors estimate a lights-GDP elasticity of 0.28 to 0.32, with no evidence of nonlinearity or asymmetry between increases and decreases in lights. In the long difference, the lights-GDP relationship has a correlation coefficient of 0.53. Under a range of assumptions about measurement error of GDP in countries with good data, they estimate a structural elasticity of lights growth with respect to GDP growth of between 1.0 and 1.7."
In some cases, satellite imaged may offer a less-biased source of information. If you want to know about deforestation in Indonesia or Brazil, for example, satellite images may tell you more than government data reported by local politicians. If you want to know about the level of particulate air pollution, satellite images may be more trustworthy than government reporting.
If you want to know about how many buildings are in the mega-slums of certain cities in the developing world, looking at satellite images may beat government data. If you want to know about recent building, you can compare satellite images over time, or one study looked at the reflectivity of roofs--because more recent buildings will tend to have roofs that reflect more light. Here's an image from their paper of roofs in a city in Nairobi:

If you want to know about how drought affects armed conflict, satellite images may be the best data you can get. If you want to know about how local topography and weather affects the spreading of cities, or the location of dams, or the possibilities for altering crop production patterns, satellite data can be enormously useful.
If you want to know about poverty in developing countries, a recent paper in Science shows how to measure poverty with images of things like roads, water, and buildings that can be converted into estimates and maps of household consumption and assets for low-income areas.
Of course, traditional economic data is not going away, and many studies with satellite data used the new data together with traditional data. But the satellite data is getting better and more available at a rapid clip. Among the more recent examples are studies that use the data to "count crowds of people and cars at events such as protests, political rallies, or peak shopping periods ... Similarly, traffic volumes could be measured from snapshots of car densities." It's a new research frontier.