Thursday, April 30, 2020

US Population Growth at Historic Lows

The 2010s are the slowest decade for population growth in US history, slower even than the 1930s. And it looks as if the next few decades will be even slower.  William Frey offers an historical perspective in "Demography as Destiny" (Milken Institute Review, Second Quarter 2020, pp. 56-63).
For a forward-looking projection, Jonathan Vespa, Lauren Medina, and David M. Armstrong have written "Demographic Turning Points for the United States: Population Projections for 2020 to 2060" (US Census Bureau, Issued March 2018, revised February 2020). The US population growth rate in the decades of the 2010s was 7.1%, as shown in the graph above. The Census predictions are for US population growth of 6.7% in the 2020s, 5.2% in the 2030s, and 4.1% in the decade of the 2040s. They write (references to figures omitted): 
The year 2030 marks a demographic turning point for the United States. Beginning that year, all baby boomers will be older than 65. This will expand the size of the older population so that one in every five Americans is projected to be retirement age. Later that decade, by 2034, we project that older adults will outnumber children for the first time in U.S. history. The year 2030 marks another demographic first for the United States. Beginning that year, because of population aging, immigration is projected to overtake natural increase (the excess of births over deaths) as the primary driver of population growth for the country. As the population ages, the number of deaths is projected to rise substantially, which will slow the country’s natural growth. As a result, net international migration is projected to overtake natural increase, even as levels of migration are projected to remain relatively flat. These three demographic milestones are expected to make the 2030s a transformative decade for the U.S. population. 

But barring such an event, it's safe to say that the US economy is headed for uncharted demographic waters, which in turn may shift economic patterns. Is it just a coincidence that when population growth rates started slowing down after the 1960s, so did rates of US economic growth? And that the spurt of US economic growth in the 1990s coincided with an upward bump in the population growth rate? 

For example, higher rates of population growth in the past often meant an expanding market for goods like houses and cars. Conversely, it seems plausible that as population growth rates fall, and the proportion of elderly rises, the house-building industry will become a smaller share of the economy. However, one can imagine scenarios where people use more living space, or perhaps it becomes more common to own a faraway property that can be rented out much of the year, where construction continues at a similar pace. A slowing rate of population growth, especially in working-age adults, should in theory help the position of labor in the US economy. But of course, one can imagine scenarios where many people decide to work at least part-time until later ages. 

It's not foreordained that a slowdown in population growth rates will cause per capita growth to fall. But combined with an aging population, it will surely cause dramatic shifts in economic patterns and sources of growth over time. 


Tuesday, April 28, 2020

1957: When Machines that Think, Learn, and Create Arrived

Herbert Simon and Allen Newell were pioneers in artificial intelligence: that is, they were among the first to think about the issues involved in designing computers that were not just extremely fast at doing the calculations for well-structured problems, but in designing computers that could learn from their own mistakes and teach themselves to do better. Simon and Newell shared the Turing prize, sometimes referred to as thfe "Nobel prize in computing" in 1975, and Simon won the Nobel prize in economics in 1978.

Back in 1957, Simon and Newell made some strong claims about the near-term future of these new steps in computing technology. In a speech co-authored by both, but delivered by Simon, he said:
[T]he simplest way I can summarize the situation is to say that there are now in the world machines that think, that learn, and that create. Moreover, their ability to do these things is going to increase rapidly until in a visible future--the range of problems they can handle will be coextensive with the range to which the human mind has been applied.
The lecture was published in Operations Research, January-February 1958, under the title "Heuristic Problem Solving: The Next Advance Operations Research" (pp. 1-10).  Re-reading the lecture today, one is struck by the extreme changes that these extremely well-informed authors expected to occur within a horizon of about 10 years. However, about 60 years later, despite extraordinary changes in computing technology, software, and information technology more broadly, we are still some distance from the future that Simon and Newell predicted. Here's an additional flavor of the Simon and Newell argument from 1957.

Here is their admission that up to 1957, computing power and operations research had focused mainly on well-structured problems:
In short, well-structured problems are those that can be formulated explicitly and quantitatively, and that can then be solved by known and feasible computational techniques. ... Problems are ill-structured when they are not well-structured. In some cases, for example, the essential variables are not numerical at all, but symbolic or verbal. An executive who is drafting a sick-leave policy is searching for words, not numbers. Second, there are many important situations in everyday life where the objective function, the goal, is vague and nonquantitative. How, for example, do we evaluate the quality of an educational system or the effectiveness of a public relations department?' Third, there are many practical problems--it would be accurate to say 'most practical problems'--for which computational algorithms simply are not available.
If we face the facts of organizational life, we are forced to admit that the majority of decisions that executives face every day and certainly a majority of the very most important decisions lie much closer to the ill-structured than to the well-structured end of the spectrum. And yet, operations research and management science, for all their solid contributions to management, have not yet made much headway in the area of ill-structured problems. These are still almost exclusively the province of the experienced manager with his 'judgment and intuition.' The basic decisions about the design of organization structures are still made by judgment rather than science; business policy at top-management levels is still more often a matter of hunch than of calculation. Operations research has had more to do with the factory manager and the production-scheduling clerk than it has with the vice-president and the Board of Directors.
But by 1957, the ability to solve ill-structured problems had nearly arrived, they wrote:
Even while operations research is solving well-structured problems, fundamental research is dissolving the mystery of how humans solve ill-structured problems. Moreover, we have begun to learn how to use computers to solve these problems, where we do not have systematic and efficient computational algorithms. And we now know, at least in a limited area, not only how to program computers to perform such problem-solving activities successfully; we know also how to program computers to learn to do these things.
In short, we now have the elements of a theory of heuristic (as contrasted with algorithmic) problem solving; and we can use this theory both to understand human heuristic processes and to simulate such processes with digital computers. Intuition, insight, and learning are no longer exclusive possessions of humans: any large high-speed computer can be programmed to exhibit them also.
I cannot give here the detailed evidence on which these assertions--and very strong assertions they are--are based. I must warn you that examples of successful computer programs for heuristic problem solving are still very few, One pioneering effort was a program written by O.G. Selfridge and G. P. Dinneen that permitted a computer to learn to distinguish between figures representing the letter 0 and figures representing A presented to it 'visually.' The program that has been described most completely in the literature gives a computer the ability to discover proofs for mathematical theorems--not to verify proofs, it should be noted, for a simple algorithm could be devised for that, but to perform the 'creative' and 'intuitive' activities of a scientist seeking the proof of a theorem. The program is also being used to predict the behavior of humans when solving such problems. This program is the product of work carried on jointly at the Carnegie Institute of Technology and the Rand Corporation, by Allen Newell, J. C. Shaw, and myself. 
A number of investigations in the same general direction-involving such human activities as language translation, chess playing, engineering design, musical composition, and pattern recognition are under way at other research centers. At least one computer now designs small standard electric motors (from customer specifications to the final design) for a manufacturing concern, one plays a pretty fair game of checkers, and several others know the rudiments of chess. The ILLIAC, at the University of Illinois, composes music, using I believe, the counterpoint of Palestrina; and I am told by a competent judge that the resulting product is aesthetically interesting.
So where would what we now call "artificial intelligence" be in 10 years?
On the basis of these developments, and the speed with which research in this field is progressing, I am willing to make the following predictions, to be realized within the next ten years: 
1. That within ten years a digital computer will be the world's chess champion, unless the rules bar it from competition.
2. That within ten years a digital computer will discover and prove an important new mathematical theorem.
3. That within ten years a digital computer will write music that will be accepted by critics as possessing considerable aesthetic value.
4. That within ten years most theories in psychology will take the form of computer programs, or of qualitative statements.
It is not my aim to surprise or shock you if indeed that were possible in an age of nuclear fission and prospective interplanetary travel. But the simplest way I can summarize the situation is to say that there are now in the world machines that think, that learn, and that create. Moreover, their ability to do these things is going to increase rapidly until in a visible future the range of problems they can handle will be coextensive with the range to which the human mind has been applied.
I love the casual mention--in 1957!--that humans are already in the age of nuclear fission and prospective interplanetary travel. Do we still live in the age of nuclear fission and prospective interplanetary travel? Or did we leave it behind somewhere along the way and move to another age?

It's not that these the predictions by Simon and Newell are necessarily incorrect. But many of tehse problems are evidently harder than they thought. For example, computers are now stronger chess players than humans, but it took until 1997--with vastly more powerful computers after many doublings of computing power via Moore's law, before IBM's Deep Blue beat Garry Kasparov in a six-game match. Just recently, computer programs have developed that can meet a much tougher conceptual challenge--consistently drawing, betting, and bluffing to beat a group of table of five top-level human players at no-limit Texas hold 'em poker

Of course, overoptimism about artificial intelligence back in 1957 does not prove that similar optimism at present would be without foundation. But it does suggest that those with the highest levels of imagination and expertise in the field may be so excited about its advances that they have at tendency to understate its challenges. After all, here in 2020, 63 years after Simon and Newell's speech, most of what we call "artificial intelligence" is really better-described as "machine learning"--that is, the computer can look at data and train itself to make more accurate predictions.  But we remain a considerable distance from the endpoint described by Simon, that "the range of problems they [machines] can handle will be coextensive with the range to which the human mind has been applied."

Monday, April 27, 2020

Homelessness, Temperatures, Shelter Rate, Bed Rate

How does the homelessness situation vary across states? Brent D. Mast offers some basic facts in "Measuring Homelessness and Resources to Combat Homelessness with PIT and HIC Data" (Cityscape, vol 22, no. 1, published by US Department of Housing and Urban Development, pp. 215-225).

The article offers useful quick overview and critique of the PIT and HIC data. The Point-in-Time (PIT) data is a national survey about the number of homeless conducted each year during the last 10 days in January. It is widely believed to understate the total number of homeless--a group it is of course difficult to count--but if the degree of understatement is similar from year to year, it can still offer a useful measure. The Housing Inventory Count (HIC) data is an "annual inventory of the beds, units, and programs" to serve the homeless.

I unabashedly admit that part of what caught my eye in Mast's article were his innovative figures for displaying this data. For example, the first column of figures here shows the temperature in January (when the PIT survey is done) for each state. The states are in groups of four. There's a tiny map of the US just to left, and the color of the four states illustrated on the first tiny map match the four colors of the point. Thus, the red dot in the top cluster of four states is Alaska, the red dot in the next cluster of four states is Wisconsin, and so on.

As the figure illustrates, the correlation between January temperature (neatly organized from top to bottom) and level of homelessness (much more scattered, in the far-right column) isn't very large. Yes, down at the bottom of the table there are states with moderate January temps that have high homelessness, like California, Nevada, Washington, and Oregon. But there are also states with moderate January temps that have lower levels of homelessness, like Florida, Arizona, Lousiana, and Texas. Conversely, there are states with colder-weather January temps like New York, Massachusetts, and Alaska but fairly high homelessness rates.

The middle column shows what share of the homeless are in some kind of shelter. Here, the western coast states of California, Oregon, and Nevada stand out for relatively low rates. Other states with colder Januaries but high rates of homelessness, like New York, Massachusetts, and Alaska, have a much higher share of the homeless in shelters. As Mast points out: "This inverse relationship could reflect less necessity for providers to shelter homeless populations in warmer winter climates, or a decreased preference of homeless people to seek winter shelter in warmer states."

The next figure shows the ratio of beds to the total homeless population. Again, the first column ranks the states by average January temperature. Don't be too concerned that the "bed ratio" exceeds 100% for some states. Remember that this method of counting the homeless--done once a year-- probably understates the total, and so some states are presumably planning for the actual number of homeless who show up on the worst nights.
In general, states with colder Januaries do tend to have a higher ratio of beds-per-homeless. However, this figure shows that the three states with very low shelter rates for the homeless--California, Oregon, and Nevada--are also the three states with very low rates of beds-for-the-homeless relative to the number of homeless. This pattern tends to suggest that the lack of beds may help to explain the low proportion of homeless people in shelter in these states. As Mast gently puts it: "The positive relationship between the proportion sheltered and the bed ratio reflects the fact that one might expect a greater proportion of homeless persons to be sheltered when more beds are available relative to the homeless population."

Friday, April 24, 2020

Some Thought on US Pharmaceutical Prices and Markets

There's a broadly shared idea of how US pharmaceutical markets ought to work, I think. Innovative companies invest large amounts in trying to develop new drugs. Sometimes they succeed, and when they do, the company can then earn high profits for a time. But eventually, the new products will go off patent, and inexpensive generic equivalents will be produced.

Describing the basic story in that way also helps to organize the common complaints about what is seems to be wrong. During the time period when new drugs are under patent, it seems as if their prices rise so quickly and to such high levels that it feels exploitative. Companies focus on taking actions to put off the time when competition from generic drugs can enter the market. Meanwhile, we find ourselves in the position of desperately wanting many companies to make large efforts to develop the new drugs/vaccines we sorely need to address COVID-19, and we know that only a few will ultimately succeed. However, a number of politicians feel compelled to proclaim that if and when such successes occur,  those companies should stand ready to provide these newly invented and effective drugs and vaccines at the lowest possible cost and not expect to make much profit in doing so. We are simultaneously discovering that we are highly dependent on a limited number of foreign manufacturers for our supply of workhorse generic drugs, and the Food and Drug Administration has announced that the US healthcare system faces shortages of about 100 drugs.

In short, the problem of the US pharmaceutical industry go far beyond the standard complaint about high prices. To help disentangle these issues, the Journal of the American Medical Association has a group of research and viewpoint/editorial article in the issue of March 3, 2020. Here, I'll just list some themes from these articles.

1) How much are drug prices rising? 

If you look just at branded medications, the prices are up substantially. As Chaarushena Deb and Gregory Curfman write in their essay: "Relentless Prescription Drug Price Increases": 
The pharmaceutical industry just announced prescription drug price increases for 2020. According to the health care research firm 3 Axis Advisors, prices were increased for nearly 500 drugs, with an average price increase of 5.17%. To mitigate public criticism, most of the price increases were kept below 10%. The list price of the world’s bestselling drug, adalimumab (Humira), was increased by AbbVie by 7.4% for 2020, which adds to a 19.1% increase in list price for years 2018 and 2019.
For economists, of course, there's always an "on the other hand." If you combine prices for both branded and generic prescription drugs, and take into account how cheaper generics are displacing branded drugs for certain uses, the overall price level of prescription drugs in the US actually fell last year according to the Consumer Price Index. 

In addition, as Kenneth C. Frazier points out in his essay, "Affording Medicines for Today’s Patients and Sustaining Innovation for Tomorrow," net drug prices (after manufacturer discounts) have been stable since 2015; if you take new drugs into account, the net drug prices have been falling since 2015. But as Frazier points out, the "net" drug price isn't the same as what patients actually pay.  
Manufacturer discounts from list prices are generally not passed on to patients, and many patients are exposed to the full list price of drugs before they reach their deductibles, out-of-pocket spending caps (if they have one), or both. In fact, about 50% of the total amount spent on branded prescription drugs is retained by payers, hospitals, distributors, and others in the supply chain, not the manufacturer.
Thus, the problem of patients facing high drug prices isn't all about what the manufacturer is charging: it's also about the add-on costs from the rest of the supply chain.

2) How high are profits for the US pharmaceutical industry? 

David M. Cutler asks "Are Pharmaceutical Companies Earning Too Much?" As he points out, one of the research studies in the issue "showed that from 2000 to 2018, the median net income margin in the pharmaceutical industry was 13.8% annually, compared with 7.7% in the S&P 500 sample." Another of the studies in the issue suggest that it costs an average of nearly $1 billion in research and development expenditures to bring a new drug to market (a number which includes false starts and failed efforts in the total costs).

On the other hand, as Cutler also points out:
Like several other industries (eg, software and motion picture production), the pharmaceutical industry has very high fixed cost and very low marginal cost. It takes substantial investment to discover a drug or develop a complex computer code, but the cost of producing an extra pill or allowing an extra download is minimal. The way that firms recoup these fixed costs is by charging above cost for the product once it is made. If these upfront costs are not accounted for, the return on the marketed good will look very high.
In addition, these high profits are focused on the big and successful drug companies: "A good number of recent innovations have come from the startup industry, not established pharmaceutical firms, although major pharmaceutical firms are involved in clinical testing and sales." In other words, it's not fair to judge the profitability of the overall drug industry based only on the big successes; one would also need to take into account the losses at all the companies that tried and failed, too.  

It's also worth noting that a research study in this issue finds that in recent years, drug company profits haven't looked so gaudy. As Frazier points out in his essay: 
Likewise, Ledley et al report that over the past 5 years, between 2014-2018, pharmaceutical net income was markedly lower than in earlier years, and there was no significant difference between the net income margin of pharmaceutical companies compared with other S&P 500 companies during this period. 
3) How do pharmaceutical firms use the patent system to keep prices high for brand-name drugs?

In their essay on "Relentless Prescription Drug Price Increases," Chaarushena Deb and Gregory Curfman point out some of the ways that firms earning high profits from patent-protected brand-name drugs. For example, one approach is called pay for delay: "Such tactics involve payments from brand-name companies to generic companies to keep lower-cost generic drugs off the market, and both brand-name and generic companies profit from these arrangements. These arrangements are commonplace, and with the elimination of market competition, brand-name companies are at liberty to keep their prices high—as high as the market will bear." The Supreme Court ruled back in 2013 that pay-for-delay can be challenged in court as potentially anticompetitive, but there is no guarantee that the antitrust prosecutors will win such lawsuits. 

Another possibility is for a company to create a "patent thicket" of many overlapping patents in a way that makes it especially risky for any new entrant. Deb and Curfman write:
In response to these price hikes for Humira, AbbVie has recently been the subject of a series of groundbreaking classaction lawsuits. Insurance payers and workers’ unions allege that AbbVie created a “patent thicket” around the monoclonal antibody therapy, thereby acting in bad faith to quash competition from Humira biosimilars. The original Humira patent expired in 2016, but AbbVie has been able to stave off biosimilar market entry by filing more than 100 follow-on patents that extend AbbVie’smonopoly beyond 2030. It is not uncommon for drugs to be protected by multiple patents, but the Humira patent thicket is extreme and allows AbbVie to aggressively extend its high monopoly pricing. A second claim in the lawsuits against AbbVie is that the company allegedly used “pay-for-delay” tactics to negotiate later market entry dates with biosimilar competitors. Pay-for-delay agreements in the pharmaceutical industry have been controversial for years, but the notion of a “patent thicket” greatly exacerbates the issue because the normal route for generics and biosimilars to enter the market is through patent litigation. ... AbbVie contended it would continue to sue biosimilar manufacturers for infringement using its full complement of patents, pushing market entry dates well into the 2030s, leading the biosimilar companies to simply give up and settle the litigation. These settlements will likely allow AbbVie to continue instituting price increases for Humira.

4) What about drugs where the US has shortages? 

Inmaculada Hernandez, Tina Batra Hershey, and Julie M. Donohue write: "Drug Shortages in the United States Are Some Prices Too Low?" They note that the Food and Drug Administration has regular reports listing drugs with a shortage--apparently because there isn't enough incentive for companies to enter the market or to invest in manufacturing. They write: 
Drug shortages disproportionately affect generic, injectable medications, which have been marketed for decades and have lower prices even when compared with other generic products. These shortages affect essential drugs (injectable antibiotics, such as vancomycin and cefazolin; chemotherapeutic agents, such as vincristine and doxorubicin; and anesthetics, such as lidocaine and bupivacaine) and therefore have major public health consequences, including delays in or omission of doses; use of less effective treatments; increased morbidity; and even death. Assessing the causes of and potential solutions to drug shortages is timely because the number of drugs in active shortage has increased recently, from 60 per week in 2016 to more than 100 in 2018.
Sometimes the shortage occurs because the sale and price of the drug have been falling, and producers exit the market. But they also dig into the dynamics of markets for generic drugs, which account for two-thirds of the shortages. They point out that production of these drugs often involves a "sponsor" for the generic drug, which then has agreements with an independent supplier to produce the active ingredients and with a contract manufacturing organization to produce the actual drug. They write: 
At nearly every point in this system, the market has become more concentrated, meaning a small number of companies account for a large share of the market, and concentration is at the root of shortages. ... Drug shortages are more likely to occur in markets with only 1 to 3 generic sponsors. Second, because of consolidation of suppliers, competing generic sponsors often rely on a single active ingredient supplier. Third, it is increasingly common for a single contract manufacturer to produce the final dosage forms for all generic sponsors marketing a given product. Moreover, 90% of active ingredients and 60% of dosage forms dispensed in the United States are manufactured overseas, complicating FDA monitoring efforts. Market concentration is the underlying reason why markets are so slow in responding to shortages.When production is halted for quality control problems (eg, the sterile injectables produced by the manufacturing facility are nonsterile or contain metal particulates), there is no alternative facility available.
Then on the purchasing side, 
"Health systems and pharmacies, which administer or dispense drugs to patients, often purchase drugs through intermediaries, such as wholesalers and group purchasing organizations (GPOs). GPOs are highly concentrated; the top 4 now account for 90% of the market. The market power of GPOs has reduced prices for health systems but, according to the FDA, has also contributed to a “race to the bottom,” ie, offering the drug at the lowest price possible, which has decreased generic sponsors’ profitability, especially in the case of injectables, which are costly to manufacture. Importantly, because generic drugs are bioequivalent and exchangeable, there is no mechanism in the purchasing system to reward high-quality production, even though FDA asserts differences in the quality of manufacturing practices exist and are inextricably linked to shortages. Concentration among intermediaries in the drug purchasing system is a likely factor in driving the prices of some generics so low that generic sponsors do not see them as profitable.
As a result of these market dynamics, a number of these workhorse generic drugs either experience shortages on a regular basis, or may have only one supplier. There have been several cases where a supplier of a generic drug noticed that there was no competition, and then raised prices substantially. 

Taking all of this together, one can begin to imagine a policy agenda for the US pharmaceutical industry that is just a wee bit more sophisticated than simple price controls on drugs or punitive taxes on drug companies. 

1) We want to continue invest billions of dollars in new drugs. Some of the funding can come government, perhaps directed though both higher education and private-sector settings. But some will also come from profits previously earned by drug companies. 

2) The antitrust authorities have some tools to put downward pressure on prices of brand-name drugs, by energetically challenging pay-for-delay, patent thickets, and other questionable approaches. 

3) We need to encourage competition in the market for generic drugs, to assure a steady supply of high-quality drugs. This involves encouraging firms that make active ingredients, contract manufacturing firms, and the "sponsor" firms that get the regulatory approval and do the marketing to for these drugs. Greater competition should help to avoid shortages. 

4) Some drugs can have such high costs, and such modest benefits for health, that it's questionable whether insurance should cover them. For example, certain anti-cancer drugs probably fall into this category. In this situation, we want to encourage continued research which may eventually produce a less expensive drug with better health effects, and so some patients should have access to the drug as part of such studies. But for some drugs, a super-high price in exchange for extending life expectancy by only a month or two is way of saying that they aren't yet ready for the mass market. Of course, many other drugs are a fantastic investment on cost-benefit grounds. Given the extreme economic costs for dealing with the COVID-19 pandemic, finding cost-effective tests, treatments, or vaccines seems as if it should be a fairly low bar to cross. 

Wednesday, April 22, 2020

Product Longevity and Planned Obsolecence

Do profit-making firms plan to produce products that will be come obsolete sooner than necessary, so that they can keep sales high over time? And would it be better for both consumers and the environment if they stopped doing so? J. Marcus, Georg Zachman, Stephen Gardner, Simone Tagliapietra, and Elissavet Lykogianni investigate these questions in "Promoting product longevity," subtitled "How can the EU product safety and compliance framework help promote product durability and tackle planned obsolescence, foster the production of more sustainable products, and achieve more transparent supply chains for consumers (March 2020, European Parliament, Policy Department for Economic, Scientific and Quality of Life Policies Directorate-General for Internal Policies).

As the report points out:
Concerns with needlessly short product lifetimes became prominent with the publication of Vance Packard’s The Waste Makers in 1960. This instant US best-seller argued that companies produced goods with product lifetimes far shorter than that which they were realistically able to achieve because to do otherwise would reduce their ability to sell new or replacement products to consumers.
In The Waste Makers, Packard identified three main reasons for consumers to discard products: obsolescence of function, quality or desirability. Cooper (2004) expands on this model by distinguishing among (1) psychological obsolescence, which arises when we are no longer attracted to products or satisfied by them; (2) economic obsolescence, which occurs when there are financial factors that cause products to be considered no longer worth keeping; and (3) technological obsolescence, which is caused when the functional qualities of existing products are inferior to newer models.
This description helps to clarify why "planned obsolescence" is hard to study. For example, if many people prefer to get new clothes in new styles on a semi-regular basis, rather than wearing nearly- indestructible overalls for year after year, this "psychological obsolescence" is perhaps more about consumers than any clever strategy by firms. When auto-makers put out new models of cars, it doesn't prevent owners of older models from continuing to drive. As of mid-2019, average age of vehicle on the road in the US was an all-time high of 11.8 years.

Similar issues arise with products where technology is changing over time. For example, many people prefer to have a smartphone or computer that is not too old, because the capabilities keep changing. If new appliances or cars are much more energy-efficient, then switching over could be good for the environment. Many consumers, if faced with a choice between paying less now for a product with a shorter life or paying more for a product with a longer life (or greater energy efficiency), will choose the cheaper up-front option. Again, perhaps cheaper products with shorter product lifespans are not so much "planned" obsolescence, but just giving consumers what they prefer.

Thus, although there is a nagging feeling that planned obsolescence is common, actual levidence is hard to come by. The Marcus et al. report notes: "The literature on planned obsolescence focuses on suppliers who intentionally supply products with a short lifetime in order to sell replacements to consumers. The degree to which this is actually the case is largely unknown – surprisingly little is concretely known about producer preferences in terms of product lifetime."

I'm aware of one well-documented historical case where producers in an industry came together and agreed to produce light bulbs that would wear out sooner than needed, which I wrote about in "The Light-Bulb Cartel and Planned Obsolescence" (October 9, 2014).

There are certainly other cases that seem suspicious. For example, new editions of college textbooks come out every few years. Textbook companies readily admit that they want students to buy new books, not used ones, and new editions of textbooks are one way of doing that. In economics, at least, there is the excuse that the economy changes over time and the examples should be updated. But in many fields, there's certainly room for suspicion about whether the updates to textbooks, and the extent of those updates, is more about helping students get an up-to-date education or more about boosting sales.

Many of the current concerns about planned obsolescence are about our electronic gizmos. Yes, they need to be updated over time. But do they need to be updated so often? And why is it so hard and/or expensive to get seemingly minor and predictable issues fixed, like a cracked screen or a worn-out battery? As the report notes:
Smartphones and tablets should typically be able to operate for at least four to five years, perhaps more, but many are replaced within two years (which historically was roughly the lifetime of the battery). Some users always want to have the latest technology, but there is good reason to believe that a great many of these mobile devices are replaced (1) because the battery has died, and cannot be replaced by the user; or (2) because the screen has cracked, and cannot be replaced by the user, or (3) because the manufacturer no longer is willing or able to support the software. Recent Eurobarometer survey results (Kantar, 2020) show that 69 % of consumers in the EU-27 want their mobile phones and tablets to last five years or more ...  They also indicate that 68 % of EU-27 consumers most recently scrapped a smartphone, tablet or laptop for at least one of three reasons: (1) they broke their previous device; (2) the performance of the old device had significantly deteriorated; or (3) certain applications or software stopped working on their old device. It is clear that a great many EU consumers would like to be able to get these devices repaired, but face challenges in doing so .... 
In one case that has gotten some press coverage, the New York Times recently reported: "Apple agreed to pay up to $500 million to settle a lawsuit that accused the company of intentionally slowing down certain iPhones years after they were released." The settlement has yet to be approved by a judge and of course, language in the settlement says that it is not an admission of fault of any kind. But it raises one's eyebrows.

But again, the underlying issue is that design tradeoffs exist. For example, when consumers wanted smartphones that were slimmer and sleeker, and made of metal and glass rather than plastic, it became harder to include a replaceable battery--and a place to open the insides of the phone was also a conduit for moisture and dust. So high-end Android phones stopped having removable batteries.

Having the government try to second-guess and mandate design specs for rapidly evolving high-tech products would be a mug's game. Product longevity is just one of many product characteristics, and it's easy to think of potential tradeoffs that customers might prefer. But it also seems quite possible to me that product longevity is one of those things that consumers may tend to undervalue when purchasing a product, and then later wish they had given it more weight.

In that spirit, one can imagine some intermediate steps. The Marcus et al. report has some discussion of issues like the "right to repair," where consumers might at least have a more clear sense of the characteristics of tech products over time. For example, the reports argues for "(1) needs for minimum product lifetimes, (2) needs to inform prospective customers about the expected lifetime of a product in order to facilitate informed choice, and (3) the promotion of modularity to facilitate ease of replacement by the user of defunct components."

Monday, April 20, 2020

Health Care Headed for One-Fifth of US Economy

I view myself as a fairly jaded consumer of statistics on rising health care costs, but the most recent 10-year projections from the US Centers for Medicare and Medicaid Services widened my eyes. They appear in "National Health Expenditure Projections, 2019–28: Expected Rebound In Prices Drives Rising Spending Growth," by Sean P. Keehan, Gigi A. Cuckler, John A. Poisal, Andrea M. Sisko, Sheila D. Smith, Andrew J. Madison, Kathryn E. Rennie, Jacqueline A. Fiore, and James C. Hardesty, appearing in Health Affairs (April 2020, pp. 704-714, not freely available online).The team writes:
National health spending is projected to increase 5.4 percent per year, on average, for 2019– 28, compared to a growth rate of 4.5 percent over the past three years (2016–18). The acceleration is largely due to expected faster growth in prices for medical goods and services (2.4 percent for 2019–28, compared to 1.3 percent for 2016–18). Growth in gross domestic product (GDP) during the projection period is expected to average 4.3 percent. Because national health spending growth is expected to increase 1.1 percentage points faster, on average, than growth in GDP over the projection period, the health share of GDP is expected to rise from 17.7 percent in 2018 to 19.7 percent in 2028 ...
A few thoughts here:

1) Total US health care spending was 5.0% of GDP in 1960, 8.9% of GDP in 1980, 13.4% of GDP in 2000, 17.7% of GDP in 2018, and now headed for 19.7% of GDP.

2)  I'm not in the business of predicting long-run effects of COVID-19, but it seems unlikely to me that the result will be a smaller rise in health care spending.

3) At this point, it's fairly clear  that the Patient Protection and Accessible Care Act of 2010 didn't have much lasting effect on holding down health care costs.

4) Just for perspective, remember that the US already leads the world in health care spending by a wide margin. This figure shows OECD data on health care spending for 2018 as a share of GDP compared with a selection of countries, with the bar for the US at the far left. The red bar is the average for the 36 OECD countries.

This figure shows per capita health care spending across a selection of countries, with the bar for the US again at the far left. Again, the red bar is the average for the 36 OECD countries.
5) It's not rocket science to figure out some ways to at least hold down the rise in US health care spending. Some of the policies would focus on non-medical interventions, like exercise and diet. Some would focus on helping patients to manage chronic conditions, so that they are less likely to turn into hyper-expensive episodes of hospitalization. There are mainstream estimates that perhaps 25% of health care spending is wasted.

6) There is some evidence that Americans are beginning to put the costs of health care as the top issue of concern for them in US health care policy. The reasons have all been said before, but they bear repeating. When companies compensate employees, the more they spend on employee health insurance, the less they have to spend on take-home pay. A substantial part of government support for the poor is in the form of health insurance (over $8,000 per Medicaid enrollee), not money they can spend on other needs. Health care expenses are a main driver of tight and inflexible government budgets at the state level, and of long-term rising budget deficits at the federal level. Americans are paying a lot more for health care than other countries, but not obtaining better health outcomes than other countries.

None of this is new. But as we head for a US economy that is one-fifth health care, the path we are on is perhaps worth renewed consideration.

Sunday, April 19, 2020

ILO: COVID-19 Lockdowns and the Global Labor Force

Amidst our concerns about jobs in the local or national labor market, spare a thought for the effects of COVID-19 lockdowns on the global labor force. In many lower-income countries, the burden of government rules that have the effect of shutting down businesses will fall on workers who have little or no access to a government funded social safety net. The International Labour Organization offers an overview in its ILO Monitor, on the theme " COVID-19 and the world of work" (April 7, 2020,  Second edition, Updated estimates and analysis).

As the ILO notes, "Full or partial lockdown measures are now affecting almost 2.7 billion workers, representing around 81 per cent of the world’s workforce."

The ILO focuses on those who work informally in the world economy.
Around 2 billion people work informally, most of them in emerging and developing countries. The informal economy contributes to jobs, incomes and livelihoods, and in many low- and middle-income countries it plays a major economic role. However, informal economy workers lack the basic protection that formal jobs usually provide, including social protection coverage. They are also disadvantaged in access to health-care services and have no income replacement if they stop working in case of sickness. Informal workers in urban areas also tend to work in economic sectors that not only carry a high risk of virus infection but are also directly impacted by lockdown measures; this concerns waste recyclers, street vendors and food servers, construction workers, transport workers and domestic workers.

COVID-19 is already affecting tens of millions of informal workers. In India, Nigeria and Brazil, the number of workers in the informal economy affected by the lockdown and other containment measures is substantial (figure 3). In India, with a share of almost 90 per cent of people working in the informal economy, about 400 million workers in the informal economy are at risk of falling deeper into poverty during the crisis. Current lockdown measures in India, which are at the high end of the University of Oxford’s COVID-19 Government Response Stringency Index, have impacted these workers significantly, forcing many of them to return to rural areas.

Countries experiencing fragility, protracted conflict, recurrent natural disasters or forced displacement will face a multiple burden due to the pandemic. They are less equipped to prepare for and respond to COVID-19 as access to basic services, especially health and sanitation, is limited; decent work, social protection and safety at work are not a given; their institutions are weak; and social dialogue is impaired or absent.
Here's a figure showing informal work and stringency of lockdown rules by country. The ILO report notes: "The horizontal, x-axis of this chart displays University of Oxford’s COVID-19 Government Response Stringency Index. The vertical, y-axis shows informal employment as a share of total employment in the respective country, based on internal ILO calculations. As a third dimension, the respective size of each bubble shows the relative size of total informal employment in each country, which is calculated by multiplying the percentage of informal employment (i.e. the value shown on the y-axis) by total employment as per ILOSTAT’s modelled estimates for 2020."

The short takeaway here is that being put out of work by anti-COVID-19 government policies is harsh everywhere, but it is especially harsh without a government safety net. Sheltering in place and social distancing become even more difficult when economic necessity forces people to migrate back to their families in rural areas. In addition, future researchers seeking to evaluate the effects of social distancing and lockdown policies around the world will surely be comparing examples of countries with less or more stringent policies, like Indonesia and India.

Friday, April 17, 2020

WTO: Projections for World Trade in 2020

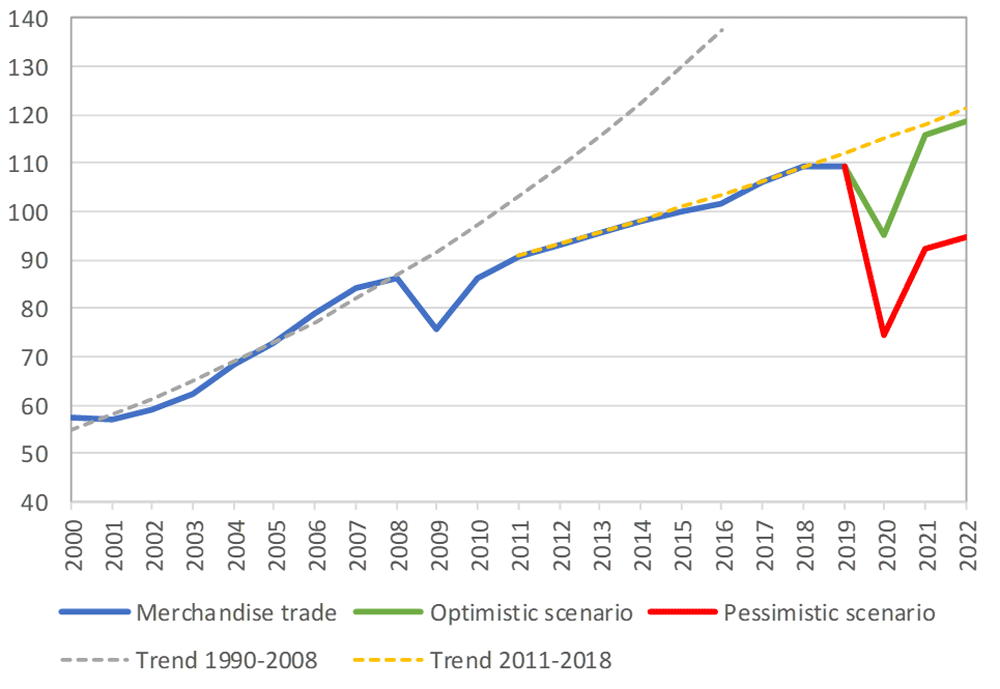
For those who see international trade as a destructive force, the dismal economic news of 2020 comes with as silver lining: as the World Trade Organization puts it, "Trade set to plunge as COVID-19 pandemic upends global economy" (April 8, 2020). The WTO predicts: "World merchandise trade is set to plummet by between 13 and 32% in 2020 due to the COVID-19 pandemic."

The predicted slowdown in trade for 2020 is certainly no surprise, but the WTO report provided some context of patterns of trade since 2000 that seemed worth passing along.

One is that global trade slowed down after about 2008. I suspect that much of this change reflects patterns from China, where exports were growing much faster than GDP from 2001 up to about 2007, but since then have growth more slowly than GDP. The blue dashed lie shows the trendline of global trade if predicting based on 2000-2008. The yellow dashed line shows the flatter trendline  predicting based on on the years 2011-2018. The red and green lines show a range of trade projections for 2020 through 2022. Again, for those who see international trade as a destructive force, the slowdown after about 2008 and the sharp drop expected for 2020 should presumably be worth celebrating.


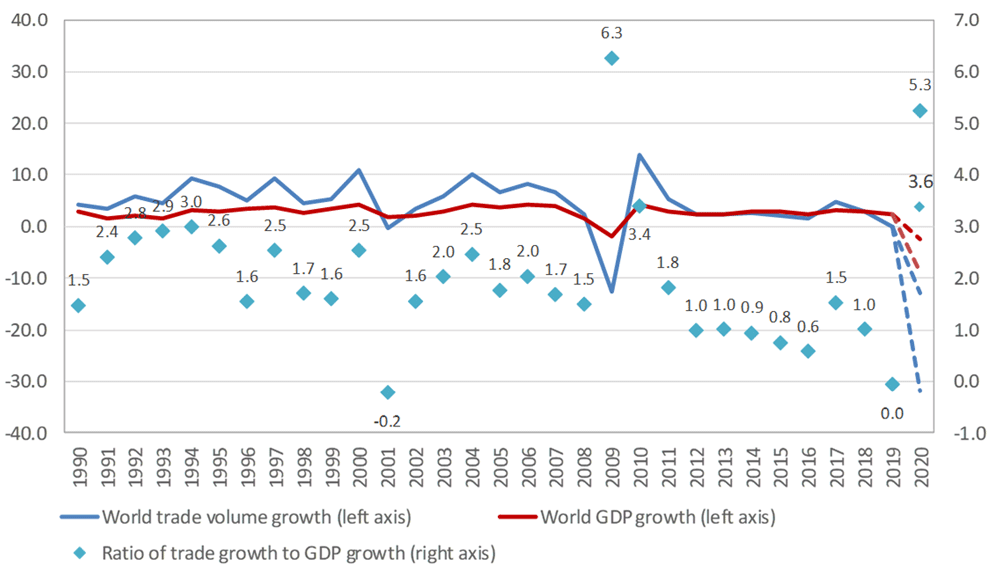
There's a classic argument among economists as to whether trade should be viewed as a cause of economic growth, or whether trade is just a by-product of economic growth (see "Trade: Engine or Handmaiden of Growth?",  January 23, 2017).  I won't revisit those arguments here, but instead just show the pattern. The red line shows the annual rate of world GDP growth; the blue line shows growth in the volume of world trade. The blue diamonds show the ratio between trade growth and world GDP growth in each year.


Through the 1990s and into the 2000s, it was common for the growth rate of trade to be higher than the growth rate of world GDP, so the ratios on the left-hand side of the figure are typically bigger than 1, and sometimes bigger than two. But since about 2011, world GDP has commonly grown at the same speed as trade or somewhat slower, so ratios of 1.0 or less are more common. In 2019, trade growth was about zero, so the ratio was also about zero. For 2020, the ratio will presumably turn negative, because the rate of growth for trade will be considerably more negative than the (also negative) rate of growth for world GDP.

In particular, the WTO forecasts big falls in two subsets of international trade in 2020: the trade linked to global supply chains, and in services trade. The WTO writes:
Value chain disruption was already an issue when COVID‑19 was mostly confined to China. It remains a salient factor now that the disease has become more widespread. Trade is likely to fall more steeply in sectors characterized by complex value chain linkages, particularly in electronics and automotive products. According to the OECD Trade In Value Added (TiVa) database, the share of foreign value added in electronics exports was around 10% for the United States, 25% for China, more than 30% for Korea, greater than 40% for Singapore and more than 50% for Mexico, Malaysia and Vietnam. ...
Services trade may be the component of world trade most directly affected by COVID-19 through the imposition of transport and travel restrictions and the closure of many retail and hospitality establishments. Services are not included in the WTO's merchandise trade forecast, but most trade in goods would be impossible without them (e.g. transport). Unlike goods, there are no inventories of services to be drawn down today and restocked at a later stage. As a result, declines in services trade during the pandemic may be lost forever. Services are also interconnected, with air transport enabling an ecosystem of other cultural, sporting and recreational activities. However, some services may benefit from the crisis. This is true of information technology services, demand for which has boomed as companies try to enable employees to work from home and people socialise remotely.

I see a certain amount of casual jibber-jabber from both ends of the political spectrum about how at least this recession gives the US a chance to separate itself from the rest of the global economy. The disruptions and costs inherent in making such a change should not be taken lightly.

Thursday, April 16, 2020

Academia and the Pandemic: A Love/Hate Letter

As someone who has been running an academic journal for 34 years and who has college-age children, I've got a ringside seat for watching how higher education has been reacting to the COVID-19 pandemic. I'm having a love/hate reaction.
_______

Consider the rapid and near-universal move to online higher education. I've seen up close what this transition required of faculty who were reconstructing courses on the fly. Most faculty put considerable time into planning their regular courses in advance, because during the term, time is taken up with actual teaching and other responsibilities.  But professors put in substantial amounts of time and energy  to make the change to an online format, even though  many of them would strongly prefer not to teach that way. Students had to make a fierce transition as well: changes in how classes met, changes in how information was transmitted, difficulties in coordinating study groups, and often a shift in the kinds of assignments being given. Many students also had to deal with these changes while also shifting their patterns of living or commuting.  I love the earnestness and energy of the large effort made to keep classes going.

I also hate how quickly and easily colleges and universities switched to online education. These institutions spend considerable time and energy preaching to students and alumni about the virtues of the in-person education they usually deliver: for example, the value of in-person discussions with other students both in classrooms and around campus, the ease of access to professors and faculty, the importance of access to a broad array of activities, clubs, and cultural options, and so on. Academic departments emphasize the that oh-so-important junior seminar, or  that capstone laboratory science project for the senior major, or the upgrade to college-level writing skills in a first-year seminar.

But all of those interactions that sounded so important--and indeed, were a main part of the reason for attending college in the first place--were jettisoned within a couple of weeks, and quickly replaced with online classes. I'm not aware of a single college or university which announced: "We can't deliver the education we promised. We feel terribly about that. But we can't do it. We'll try to figure out how to give you some partial credit for what you've done. We'll see you next fall, or whenever we can meet in person again." Pretty much every institution of higher education was apparently comfortable in saying: "Not ideal, but we can just sub in an online course constructed in the last few days, and maybe switch over to pass/fail grading, to make sure you get your college credits." Some schools that operate on a quarter system (Stanford is a prominent example) will be running an entire on-line term.

You might respond: Well, what else could they do? After all, they couldn't just cut off the term in the middle, right? Well, it would have been a logistical nightmare, of course. And there would have been enormous pressure to refund large chunks of tuition payments. But imagine if the pandemic had arrived 30 years ago, pre-internet, when the only alternative would have been long-distance learning delivered via cable TV and physical mailboxes. In that situation, the academic term would just have had to end, right? And alternatives would then have needed to be worked out.

I have an uncomfortable sense that when the twin specters of students not being on-track for an on-time graduation and the possibility of tuition refunds started hovering over the conversation, all those elements of in-person  higher education about which college faculty and presidents so often wax rhapsodic (especially when asking alumni for donation) became expendable very quickly. And now that the traditionally in-person institutions of higher education have all agreed to dance with the genie of online education (and to charge full tuition for doing so), explaining why that genie should go back in the bottle may be harder than they think.
___________

As another example, the pandemic as a subject has rapidly attracted the attention of many professors across an array of hard sciences, social sciences, and humanities. I genuinely love the eagerness of so many researchers to step up and tackle a new subject, and to try to make whatever contribution they can to addressing some part of the problem. One of the joys of academic life is to ask a faculty member: "What are you working on now?" Then watch their eyes light up.

One undervalued aspect of higher education, it seems to me, is that there is a large group of experts in reserve with the flexibility to mobilize themselves toward society's immediate problems. Indeed, when I think about exploring the existing options for dealing with the pandemic and finding new ones, my confidence is almost entirely with semi-organized welter of the research community--both academic and within companies--rather than with government officials talking big and threatening to take over or, heaven help us all, announcing a new commission.

I also hate the willingness of so many researchers to believe that in a month or two, they can become instant experts on difficult questions. Over the decades, I've seen this phenomenon of instant experts emerge a number of times. For example, in the early 1990s the instant experts suddenly knew all about the USSR and how it should reform itself. In 2008, many of the same instant experts supposedly knew all about the details of the US financial system, everything from housing mortgages to reverse repurchase agreements. Now, the instant experts have strong beliefs based on about 60 days of learning about the strengths and weaknesses of epidemiology studies, about supply chains and manufacturing practices for ventilators and masks, and about the operations of open air seafood markets and virology laboratories in Wuhan, China.

Just to be clear, I'm all for people as involved and thoughtful citizens trying to get better informed on lots of topics; indeed, I spend large chunks of my waking hours trying to do that. What bothers me about the instant experts is the lack of respect for those who have spent decades already learning about the subject where the instant experts are just now parachuting in, and the lack of humility from the instant experts about what they can contribute. It feels to me as if some academics have a psychological need, when a big issue arises, to run up the head of a the parade and declare that they are one of the "leaders."

So yes, if you are a researcher from whatever discipline who sees a chance to make a contribution to how society understands and addresses COVID-19, by all means go for it. But in many cases, it will be a better use of the time and expertise of researchers if they keep on with what they were already doing. After all, there are are other potentially infectious diseases lurking out there, along with all the other issues that seemed pretty important way back in early January 2020. Sometimes, the best social contribution you can make is to keep doing an A-level job of what you were already doing--and be ready for when that expertise is needed--instead of doing a C-level job at chasing the latest hot topic.
______________

Lots of colleges and universities have been reacting to shutdown of their campuses and the advent of online classes with stirring emails delivered in the "we are all in this together" spirit. I genuinely love this spirit. Many colleges and universities have tried as best they could, with energy and even a bit oif flair, to preserve a sense of continuity and community. Many of them sent home as many students as they could, but have also stepped up to provide shelter, food, and a safe living space for students who for whatever reason didn't have another place to go. As in many situations of stress, people are being generous is making allowances for each other, and in supporting each other.

But I also hate this talk of  how all of us at a certain college or university are all in it together. We're not. For some of us, like permanent faculty and staff,  this is one crazy semester in a decades-long career. However, we have job security and are very likely to keep on getting our full paychecks throughout 2020.

On the other side, lots of adjunct and temporary faculty are suddenly facing professional lives that are even more insecure. Many contract or temporary employees around colleges and universities have either lost their jobs already, or will do so soon. Many parents of students who are footing most of the bill for tuition, room, and board will not be getting steady paychecks. Instead, the parents are now paying tuition for what is often a highly diluted educational experience, and facing the uncertainty of whether they will be able to afford for their child to return to college in the fall.

For four-year undergraduate students, this crazy semester is one-eighth of their college career. For graduating seniors, and for those in one-year or two-year programs, the loss of this term will be the defining fact of their academic experience.  About 30% of four-year college undergraduates normally drop out before their sophomore year; I wonder how many more will be dropping out this year. Students have taken out loans to pay the tuition for courses that ended up being on-line. Graduating students will need to figure out how to repay their loans as they enter what looks like a truly crappy labor market.

The burdens of the pandemic are quite unequally distributed, both in academia and through the rest of the economy.
___________________

There are arguably some times and places where if you don't have a clear-cut alternative to suggest, maybe it's time to shut up. The pandemic situation is without recent precedent, and academia (like everywhere else) is adjusting on the fly. I do not have alternatives to offer, But in academia's admirable surge of can-do spirit, this curmudgeon finds himself wanting to acknowledge and remember the tradeoffs and losses, too.

Wednesday, April 15, 2020

From the IMF: A Baseline Prediction for the Economy in 2020

How bad will the global and the US economy be in 2020? The IMF offers one well-informed perspective in the April 2020 World Economic Outlook, in a chapter called "The Great Lockdown."

Economic forecasts are always uncertain, but some are more uncertain than others, and trying to suss out 2020 is more uncertain than most. The IMF notes:
There is extreme uncertainty around the global growth forecast because the economic fallout depends on uncertain factors that interact in ways hard to predict. These include, for example, the pathway of the pandemic, the progress in finding a vaccine and therapies, the intensity and efficacy of containment efforts, the extent of supply disruptions and productivity losses, the repercussions of the dramatic tightening in global financial market conditions, shifts in spending patterns, behavioral changes (such as people avoiding shopping malls and public transportation), confidence effects, and volatile commodity prices.
Here, I'll just summarize the IMF "baseline" prediction. And yes, it could be better or worse than this which is what a "baseline" prediction means.
In the baseline scenario, the pandemic is assumed to fade in the second half of 2020, allowing for a gradual lifting of containment measures. Duration of shutdown. Considering the spread of the virus to most countries as of the end of March 2020, the global growth forecast assumes that all countries experience disruptions to economic activity due to some combination of the above-mentioned factors. The disruptions are assumed to be concentrated mostly in the second quarter of 2020 for almost all countries except China (where it is in the first quarter), with a gradual recovery thereafter as it takes some time for production to ramp up after the shock. Countries experiencing severe epidemics are assumed to lose about 8 percent of working days in 2020 over the duration of containment efforts and subsequent gradual loosening of restrictions. Other countries are also assumed to experience disruptions to economic activity related to containment measures and social distancing, which, on average, are assumed to entail a loss of about 5 percent of working days in 2020 over
the period of shutdown and gradual reopening. These losses are compounded by those generated by tighter global financial conditions, weaker external demand, and terms-of-trade losses ... 
Here's the global pattern, with the blue line (left axis) showing annual changes in global per capita GDP and the red line (right axis) showing the share of countries that will have negative growth in 2020. One quick summary would be that the drop in GDP per capita may be larger than the Great Recession, but it may also be over more quickly.

What about for the US economy? The IMF figures show US growth of 2.3% in 2019, a projection of a fall of 5.9% in 2020, and then growth of 4.7% in 2021. This is a slightly smaller decline and slightly bigger bounce-back than predicted for the European Union or for Canada. But it's very severe. For comparison, the US GDP declined by 2.5% in 2009, in the heart of the Great Recession. To put it another way, the IMF baseline suggests that it will take until 2022 for the US economy to get back to its size in 2019.

The IMF report has lots more detail, as well as admonitions about how economic policies can help to soften the blow. But a key factor any economic predictions is how persistent the pandemic turns out to be--and neither the IMF nor economists in general have any special insight on that key parameter.

Tuesday, April 14, 2020

A COVID-19 Two-Pronged Choice: Production Possiblity Frontiers

In an unsettled and uncertain time, Joshua Gans and MIT Press are trying an intriguing experiment: A complete draft of a new book by Gans, Economics in the Age of COVID-19, is freely available on-line. The draft is going through the standard process of getting comments from outside experts, but up until May 15, you can also read the draft for free and send along your own comments if you wish. The plan seems to be that after May 15, an updated  version of the book taking the comments from outside experts into account will become available for sale, and at some point after that, a final, final version will become available that takes the broader array of public comments into account.

Even when completed, the book will clearly be a first draft of history. But for those of us looking to get up to speed on the considerable amount that has already been thought and written about the economics of the crisis,  Joshua has already collected, organized, pre-digested, and exposited a large share of what's out there. In the future, when people are looking back to see what was known and argued when the pandemic was hitting, this book will be a natural starting point.

Here, I'll perhaps do the book a mild disservice by focusing on how Gans uses a familiar tool from intro econ, the production possibilities frontier, to describe the difficulties of making choices curing a pandemic. I should emphasize that this section is not typical of the style of exposition for the book as a whole. Joshua calls it a "Technical Interlude," and writes: "Readers who do not enjoy graphs are free to skip directly to Chapter 2 without missing any crucial information. For economists and other graph lovers, this section will go into more detail of the hollowing out and drift effects so critical to the economic conclusion that health should come before wealth." But for econ teachers wanting a way to bring the pandemic into their classroom (so to speak ...), this part of the discussion offers a way to do so.

Start with this figure showing a tradeoff between the economy and health. The outer line is a standard production possibilities frontier. This diagram should be interpreted as the tradeoff at a point in time. At a point in time, it would be possible to, say, shut down factories and thus to improve air quality, in a way that would reduce the size of the economy but improve health. The blue dot shows the poitn chosen by society. This diagram should be interpreted very broadly, so that "economy" means all of the benefits generated by the economy, not just a simple measure of GDP.
<p>Figure 1-3: Pandemic Production Possibilities Sets</p><p>a (left) Previous Levels Possible</p><p>b (right) Dark Recession</p>
What happens when a pandemic hits? Focus on the left-hand side panel first. Gans argues that the pandemic will mean that the possibilities for both economic output and for health contract. The previous combination of economy and health chosen by society--the blue dot--is no longer feasible. Instead, we have to think about whether we want to absorb the negative impact of the pandemic more through a reduction in the economy, or more through a reduction in health, or with some combination of the two. On the left-hand side of the diagram, point E shows a choice of keeping the economy where it was before, and having all the costs of the pandemic happen via less health. Point H shows a choice of keeping health where it was before, and having all the costs of of the pandemic happen via a reduction in the economy.

The shape of the red line curves has an inward curve, what Gans calls a "hollowing out." What does that shape represent?  Gans writes:
That arises out of the nature of a pandemic. To consider this, suppose that we started from our original level of the economy (at a point like E, the black dot). Then, if we want more health during a pandemic, we need to give up a lot of the economy to get it. This is the social distancing argument — we need a lot of social distancing in order to halt the spread of infectious disease and a little bit won’t have much effect. The same logic applies if we start from our original level of health (at a point like H, the green dot). In that situation, if we look to give up a little health for a better economy we find that we cannot do that. Even to achieve a level of health remotely close to what we previously had, we have to employ lots of social distancing which means that the only way to get a better economy is to give up a ton of health. (Notice that the less virulent is the infection, the smaller the bite is likely to be.) The point is that if we take the epidemiologists seriously then our usual marginal thinking about trade-offs does not work
To put it another way, the shape of the red line emphasizes that trying to muddle through a pandemic with a slightly lower level of health and a slightly reduced economy isn't going to work well. If a society decides that it will choose half-way job of social distancing, it will experience both a big drop in health (because half-way social distancing isn't all that effective) and also a big drop in the economy (because half-way social distancing is still quite costly). A pandemic thus present a kind of either/or choice: choose health or economy, protect one of them, and accept the corresponding costs.

What Gans calls the "drift" makes this lesson even more clear. Imagine that society chooses point E, to protect the economy. As the pandemic advances over time and the health costs become more severe, the economy is going to decline further (as shown by the lower level of point E in the right-hand side of the figure). Also, if society tried to defend the same level of the economy, and thus the pandemic keeps spreading, trying to keep the level of public health more-or-less the same is no longer a workable option. If society wants to protect public health in a pandemic, it needs to act briskly, because the option of protecting public health won't be possible after the pandemic spreads.

Gans presents a series of pandemic PPFs, showing that they are flexible tool for thinking about a range of issues, like how an increased availability of testing would improve the tradeoffs. Intro econ teachers take note!

For the rest of us, this framework helps to explain issues like why the social distancing rules were put in place so abruptly, why trying to take a half-way approach to social distancing would have probably imposed lots of economic costs with few health gains, and why choosing to prioritize health helps to avoid the "drift" that would otherwise occur as the pandemic evolved.

Friday, April 10, 2020

How the US Economy Pays Low and Earns High

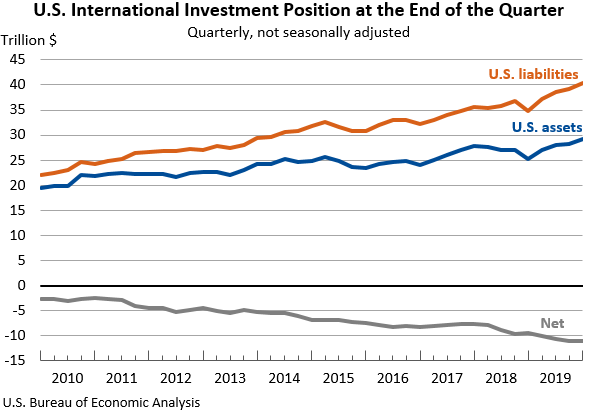
Here's an odd fact: Even though the total assets of US investors abroad is smaller than the total assets of foreign investors in the US economy, the total returns earned by US investors abroad has historically been larger than what is earned by foreign investors in the US economy. How does that happen?

As a starting point, here's the data on "International Investment Position" from the Bureau of Economic Analysis. As you can see, US assets abroad are rising, reaching $29.3 trillion at the end of 2019. But US liabilities--that is, ownership of US assets by foreign investors--is substantially larger at $40.3 trillion at the end of 2019.

U.S. International Investment Position at the End of the Quarter

Alexander Monge-Naranjo, in "The United States as a Global Financial Intermediary and Insurer" (Economic Synopses: Federal Reserve Bank of St.  Louis, 2020, No. 2) delves into the return on these international investments.  He calculates that from 1952-2015, the average annual return on assets that US investors was 5.2%, while the average annual return on assets held by foreign investors in the US economy was 2.5%.

Why does this difference exist, and how can it persist? As Monge-Naranjo argues, the typical pattern is that US investors in other economies are relatively more likely to invest in higher-risk asset--like investments in companies. Conversely, foreign investors in the US economy are relatively more likely to put their money into a safer asset, like US Treasury debt. In this sense, the patterns of international investment in and out of the US economy look like an insurance arrangement for the rest of the world--that is, investors in the rest of the world are trading off lower returns when times are good for safer and steadier returns when times are bad.

Or to put it another way, the US economy from this perspective resembles an investment fund which raises funds by issuing lower-cost debt and then makes money by investing in higher-risk companies.
This situation is not especially troubling. The US economy is the world's main producer of internationally-recognized safe assets like US Treasury debt; indeed, in bad economic times investors around the world are more likely to stock up on safe assets. In addition, the US financial, legal, and regulatory infrastructure is a huge advantage for US investors, helping to give them the confidence to make higher-risk investments in other countries. Of course, if US Treasury debt stopped looking like a safe asset, and better alternatives bloomed around the rest of the world, the current arrangement would be unsustainable--but in that situation, the US economy would be experiencing a lot of other problems, too.

Bottom line: If you dig down into the "International Transactions" accounts from the Bureau of Economic Analysis, you find that in 2019, the "Primary Income Receipts" for the US economy on foreign investments abroad were $1,123 billion in 2019, while the "Primary Income Payments" flowing from the US economy to foreign investors was $866 billion.

Thursday, April 9, 2020

Interview with Colin Camerer on Behavioral Economics

Merle van den Akker has an "Interview with Colin Camerer" at her Money on the Mind website (April 6, 2020). Here are some of Camerer's answers. 

What does a young behavioral economist who is starting graduate school need to know? 
First, you need to know the “rules” of economics—the basic canon and methods—very well. (That was a big advantage for me at Chicago in graduate school, it is a crucible for learning to “think like an economist”.) To break the rules you need to know the rules.

Second, in my opinion, if you want to succeed in behavioral economics it is a big help to be very fluent in an adjacent social science. A lot of behavioral economics is in the business of importing ideas and translating them, redesigning and “selling” them inside economics. So you need to become bilingual and know what psychology, or neuroscience, media studies, or whatever, is solid, and has a long good empirical pedigree. Figuring that out can be difficult.

Third, nowadays you really should be able to do lab (and online) experiments, know about quasi-experimental designs (IV, diff-in-diff, regression discontinuity) and know some machine learning. It is often said that most of the methods you will use in your long research career are those you learned in graduate school. It is like packing for a long, long trip to a place where there are no stores in case you forgot to pack anything. Fill that backpack with methods.
What are some promising frontier areas for behavioral economics? 
Behavioral economics has been slow to embrace machine learning (for reasons discussed in the next section— it got on the BEAM reading list very late), which is unfortunate. As a result, a lot of the exciting work in behavioral science is being done in computational social science by sociologists, cognitive science, cultural anthropologists, etc. ...
It would be good to see more behavioral insights using systematic work on emotion, attention, memory, design, haptics, social influence, etc. Personalization is also important because one-size-fits-all interventions are so wasteful; a chunk of people won’t budge, a chunk budge easily, and then there is a middle group who need just the right nudge. But personalization requires thinking about personality, character skills, etc.—an area that behavioral economics willfully neglected for a long time (because we were busy doing more foundational things). The general success of behavioral economics, in my historical accounting, came from importing basic concepts and methods from psychology and putting them in the right place ... But doing this well requires really understanding the psychology on its own terms. In the early days that was not so challenging because Slovic, Lichtenstein, Fischhoff, Loewenstein, Kahneman and Tversky, Einhorn and Hogarth (and many others) basically did the careful filtering for those of us who were not as psychology-trained. But nowadays if you want to understand concepts like habits, salience, attention, emotion, evolution, and use them to do behavioral economics you better do a lot of reading or co-produce data and co-author with a collaborator who knows a ton.
Underinvestment in Neuroeconomics
Neuroeconomics is the opposite of the 5-10 year fad phenomenon. It is thriving but very few behavioral economists are involved. It is almost like a sports league that got together and voted that a certain type of ball or clothing material should be outlawed because it is not “cricket”. It is a special case of the plain fact that the elite economics departments do not care at all about whether the behavior that people are assumed in models to be capable of are biologically implemented.

I am a little surprised there have not been more talented economics students taking up neuroeconomics since the upside is so huge. It seems related to the fact that the economics profession, particularly in the US, is much, much more status- and ranking-obsessed than any other academic field I know, and there is a lot of tribalism. Ambitious students who care about status and future job placement are petrified of doing anything too risky like neuroeconomics because they wouldn’t get jobs in HRM top-tier US economics departments (which is probably true). Their advisors often explicitly warn them away from new ideas too, because they care about their students’ placements in a similar way. There is so much low-hanging fruit in neuroeconomics.
There's much more in the interview. In addition, if you want to gain a nodding acquaintance with many of the key players in behavioral economics in both  business, there are more than 30 other interviews at the website, including with Kelly Peters, Biju Dominic, Joshua Greene, Evelyn Gosnell, George Loewenstein, and others.

Wednesday, April 8, 2020

Some Coronavirus Pandemic Readings

Like many readers of this blog, I suppose, I'm spending chunks of time reading about aspects of the coronavirus pandemic. I post here about some of what I run across. Examples include: 
However, many of the readings I find don't seem like useful fodder for the kinds of posts I try to do. Here are five examples that I tweeted about in the last few days

1) Although it's not a great comfort just now, it's perhaps worth remembering that dealing with pandemics has been a common human experience through the millennia. For an interview that moves back and forth from historical examples to our current experience, I recommend: "“Pandemic! What Do and Don’t We Know? Robert P. George in Conversation with Nicholas A. Christakis” (this edited version of the interview was published April 7, the original one-hour interview from March 30 is available here). For example, Christakis notes: 
It is a very standard thing to implement social distancing. Thucydides describes it in the plague that afflicted Athens in 430 BC. It’s not rocket science. There are two kinds of ways that we can respond to pandemics. One is so-called pharmaceutical interventions, drugs and vaccines, for which we don’t have any for this condition, although we hope to have some in the future. The other is so- called non-pharmaceutical interventions, of which there are two types: individual stuff—like washing your hands, self-isolating, not touching your nose and face—and collective interventions—like school closures or the governor banning public gatherings. All of these have been around forever. You can look at medieval woodcuts of how the people in European cities coped with pandemics and see them spaced out in the public squares. This is a fundamental human experience that we’re having. It’s been described for long periods of time. It’s just we’re not used to having it.

2) A pandemic forces society to strike a balance between public health and economic factors. It seems to me that some period of sheltering-in-place is a reasonable way to strike that balance, but for how long and under what rules are topics on which reasonable opinions can differ. Sergio Correia, Stephan Luck, and Emil Verner provide a readable overview of their just-published working paper in "Fight the Pandemic, Save the Economy: Lessons from the 1918 Flu" (Liberty Street Economics website, Federal Reserve Bank of New York, March 27, 2020). They look at geographical patterns of the 1918 flu, along with geographical patterns of steps like "closures of schools, theaters, and churches, bans on public gatherings and funerals, quarantines of suspected cases, and restrictions on business hours." Unsurprisingly, they find that steps which shut down public spaces and business were associated with drops in economic activity. But perhaps surprisingly, they also found "that cities that intervened earlier and more aggressively experienced a relative increase in real economic activity after the pandemic subsided."
3) For a number of people, one "lesson" they seem to be taking away from the pandemic is that a competitive market economy doesn't do a good job in addressing events like a pandemic, and greater government intervention is needed. The first claim (about shortcomings of markets) is fair enough, but the second claim (about the merits of greater government intervention) is in this case an unproven article of faith. Here's an article from the New York Times on how the US government started planning 13 years ago to build up a stockpile of ventilators. As of late 2019, the government had succeeded in approving which ventilator the contractor would deliver--but none had actually been delivered yet. 

4) Will experimental patterns tried out during the shelter-in-place period become longer-term habits? For example, will online education see a lasting surge? (After all, if it's good enough to get academic credit for degrees at Harvard, Stanford, and everywhere else, why not make it as standard practice?)
Katherine Guyot and Isabel V. Sawhill make the prediction that "Telecommuting will likely continue long after the pandemic" (Brookings Institution, April 6, 2020).  They make a strong case, but I confess that I'm skeptical. My sense is that telecommuting is a two-edged sword: workers like having the option when it's convenient for them, but they dislike the feeling that their work-life is bleeding into the rest of their life and that they are perpetually on call for their employers. 

5) Yes, many people went on an odd toilet-paper buying spree. But in talking about this market, there's more to the story. Toilet paper is really two markets--home and commercial--and substitution between them isn't easy. With people sheltering at home, they objectively were planning to use more toilet paper than if they were spending hours each day at office or school. The quantity demanded for home toilet paper is usually quite predictable and steady, and the supply chain was thus quite unprepared for a rise in demand. Will Oremus tells the story in "What Everyone’s Getting Wrong About the Toilet Paper Shortage" (Marker Medium, April 2, 2020).