It's perhaps worth noting up front that crime itself is not included in GDP. If someone steals from me, there is an involuntary and illegal redistribution, but GDP measures what is produced. Both public and private expenditures related to discouraging or punishing crime are already included in GDP. This is of course one of the many reasons why GDP should not be treated as a measure of social welfare: that is, social welfare would clearly be improved if crime was lower and money spent on discouraging and punishing crime could instead flow to something that provides positive pleasures and benefits.
Thus, adding illegal activities to GDP requires adding the actual production of goods and services which are illegal. Soloveichik focuses on "three categories of illegal activity: drugs, prostitution, and gambling."
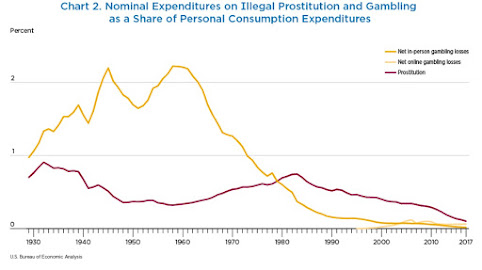
These three categories are not equal in their recent economic impact. Consumer spending on illegal drugs was $153 billion in 2017, compared to $4 billion on illegal prostitution and $11 billion on illegal gambling in the same year. Furthermore, tracking illegal drugs raises the average real GDP growth rate between 2010 and2017 by 0.05 percentage point per year and raises the average private-sector productivity growth rate between 2010 and 2016 by 0.11 percentage point per year. In contrast, neither tracking illegal prostitution nor tracking illegal gambling has much influence on recent growth rates.To me, the most interesting part of the essay is about some historical patterns of spending on illegal activities and drug prices. For example, here's a figure showing spending on illegal drugs over time. The line to the far right shows spending on alcohol during prohibition. The very high level of spending in the 1980s is especially striking, remembering that you need to add the different categories of illegal drugs to get the total.
Soloveichik writes:
Chart 1 shows that the expenditure shares for all three broad categories of illegal drugs grew rapidly after 1965 and peaked around 1980. In total, this analysis calculates that illegal drugs accounted for more than 5 percent of total personal consumption expenditures in 1980. This high expenditure share is consistent with contemporaneous news articles and may explain why BEA chose to study the underground economy in the early 1980s (Carson 1984a, 1984b). Chart 1 also shows that illegal alcohol during Prohibition accounted for almost as large a share of consumer spending as illegal drugs in 1980 and changed faster. Measured nominal growth in 1934, the first year after Prohibition ended, is badly overestimated when illegal alcohol is excluded from consumer spending.Here's a similar graph for total spending on illegal prostitution and gambling services. Spending on gambling was especially high up until about the 1960s, when first legal state lotteries and then casinos arrived.
It may seem counterintuitive that the US can be suffering through an opioid epidemic in the last couple of decades, but still have what looks like relatively low spending on illegal drugs. But remember that the start of the opioid epidemic up to about 2010 largely involved legally sold prescription drugs (as discussed here and here)--which would have been included in GDP. Total spending is a combination of quantity purchased and price. In addition, price must be adjusted for quality. Thus, what the data shows is that we are living in a time of cheap and powerful heroin and fentanyl. As Soloveichik writes:
Opioid potency has rapidly increased due to the recent practice of mixing fentanyl, an extremely powerful opioid, with heroin. Marijuana potency has gradually increased due to new plant varieties that contain higher concentrations of the main psychoactivechemical in marijuana, tetrahydrocannabinol (THC).With those patterns taken into account, here's a figure showing estimated drug prices over time, relative to the prices for legal consumption goods. Drug prices for opioids and stimulants fell sharply in the 1980s, which makes the rise in nominal expenditures on drugs shown above even more striking, and have more-or-less stayed at the lower level since then.
Soloveichik write: "Readers should also note that illegal drugs are a large enough spending category to influence aggregate inflation. Between 1980 and 1990, average personal consumption expenditures price growth falls by 0.7 percentage point per year when illegal activity is tracked in the NIPAs."
If you are interested in data sources for these illegal goods and services and what assumptions are needed to estimate prices and output levels, this article is good place to start.


