For example, here's a figure showing what taxes are the main sources of federal income over time from Erica York. She writes: "Before 1941, excise taxes, such as gas and tobacco taxes, were the largest source of revenue for the federal government, comprising nearly one-third of government revenue in 1940. Excise taxes were followed by payroll taxes and then corporate income taxes. Today, payroll taxes remain the second largest source of revenue. However, other sources have shifted in relative importance. Specifically, individual income taxes have become a central pillar of the federal revenue system, now comprising nearly half of all revenue. Following an opposite trend, corporate income and excise taxes have decreased relative to other sources."

Indeed, for all the huffing and puffing over income taxes, it's worth remembering that 67.8% of US taxpayers in 2019 will pay more in federal payroll taxes (which fund Social Security, Medicare, and disability insurance) than in federal income taxes. Robert Bellefiore offers this figure, drawn from a Joint Committee on Taxation study, showing that this pattern holds on average for all income groups under $200,000.

Arguments over taxes often make fairness claims about the share of taxes paid by various income groups. Whatever one's ultimate conclusions about what should happen, it's useful to start from teh basis of what is actually happening.
It's common to hear a complaint that those with high incomes are evading federal taxes. Some do, of course. It's a big country. If a very rich person puts all their money into tax-exempt bonds, with the associated lower interest rates for being tax-free, they won't pay taxes on that income. But on average, those with higher incomes do pay a much larger share of taxes. Robert Bellefiore offers a couple of illustrative graphs. The first figure focuses only on federal income taxes.

The second figure includes the share of all federal taxes: that is, income, payroll, corporate (as attributed to individuals who benefit from corporate profits), excise taxes on gasoline, tobacco, and alcohol, and so on. Again, those with higher income levels pay a larger share of total federal taxes.
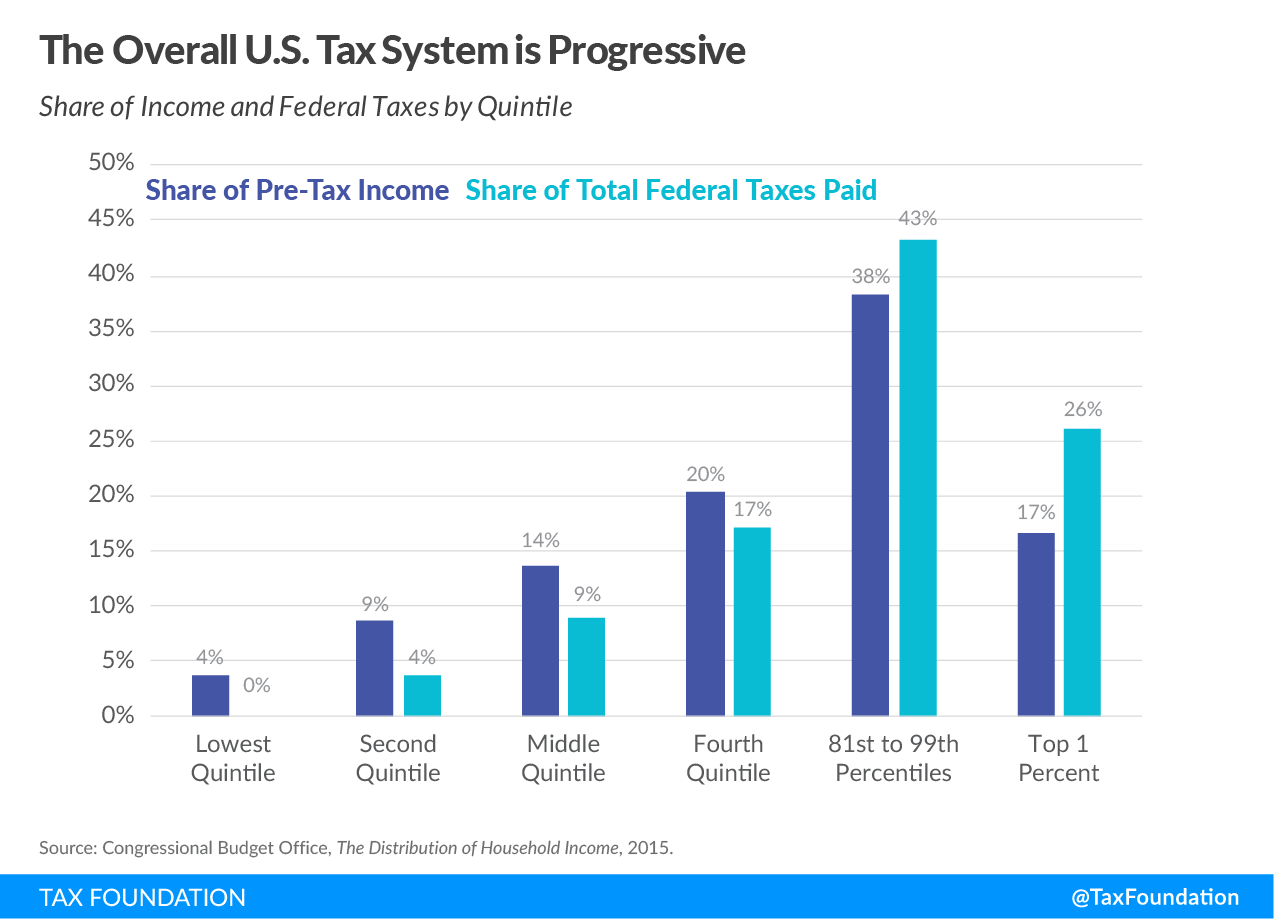
One can of course still argue that the share of taxes paid by those with high incomes should be larger. But again, arguing that those with high incomes don't already pay a larger share of federal taxes is not a true statement.
What about taxes paid at the very tip-top of the income distribution? Erica York offers this figure on the average tax rates paid by the top 0.1%. To be clear, the "average" rate rate is the actual share of income paid in taxes, which is different from the "marginal" tax rate charged on the highest $1 of income earned. Back in the 1950s, the highest marginal income tax rates sometimes reached 90%. The fact that the average tax rate is so much lower tells you that those very high marginal tax rates were largely for show, in the sense that they didn't actually apply to very much income. York writes: "The graph below illustrates the average tax rates that the top 0.1 percent of Americans faced over the last century, based on research from Thomas Piketty, Emmanuel Saez, and Gabriel Zucman. The blue line includes the impact of all federal, state, and local taxes on individual income, payroll taxes, estates, corporate profits, properties, and sales. The purple line shows income taxes only, including federal, state, and local." The overall pattern is while effective tax rates on the top 0.1% were higher in the 1950s, they haven't shown much long-term trend one way or the other in the last half-century or so.

When listening to arguments over tax policy, it's common to hear complaints about whether deductions should be limited for purposes like mortgage interest, state and local taxes, or charitable contribution. It's useful to remember that those deductions don't apply to most taxpayers. Erica York explains: "In 2016, barely a quarter of households with adjusted gross income (AGI) between $40,000 and $50,000 claimed itemized deductions when filing their taxes. In contrast, more than 90 percent of households making $200,000 and above itemized their deductions." One effect of the 2017 tax reform law is that the number of taxpayers who find it useful to itemize deductions will drop by as much as 60%.

The share of total federal taxes paid by those with high incomes has been rising over time. Part of that change is because the share of those who owe zero in federal income tax has been rising over time. Robert Bellefiore provides a graph. One main reason for the rise share of taxpayers who owe zero is the expansion of refundable tax credits aimed at those with lower income, including the Earned Income Tax Credit and the Child Credit. You can also see the share of those with zero income taxes owed rises in the Great Recession.

In a different post, Robert Bellefiore offers a chart showing the overall effects of federal tax and transfer policy on the share of income received by different groups. He writes: "The lowest quintile’s income nearly doubles, while the second and middle quintiles experience relatively smaller increases in income. The fourth quintile’s income share remains constant, and only the highest quintile has a lower share of income after taxes and transfers. The top 1 percent’s share of income, for example, falls from 16.6 percent to 13.2 percent."

Again, one can argue that the amount of redistribution should be larger. But it would be untrue to argue that a significant amount of redistribution--like doubling the after-taxes-and-transfers share of the lowest quintile--doesn't already happen.
It's common to hear a complaint that those with high incomes are evading federal taxes. Some do, of course. It's a big country. If a very rich person puts all their money into tax-exempt bonds, with the associated lower interest rates for being tax-free, they won't pay taxes on that income. But on average, those with higher incomes do pay a much larger share of taxes. Robert Bellefiore offers a couple of illustrative graphs. The first figure focuses only on federal income taxes.
The second figure includes the share of all federal taxes: that is, income, payroll, corporate (as attributed to individuals who benefit from corporate profits), excise taxes on gasoline, tobacco, and alcohol, and so on. Again, those with higher income levels pay a larger share of total federal taxes.
One can of course still argue that the share of taxes paid by those with high incomes should be larger. But again, arguing that those with high incomes don't already pay a larger share of federal taxes is not a true statement.
What about taxes paid at the very tip-top of the income distribution? Erica York offers this figure on the average tax rates paid by the top 0.1%. To be clear, the "average" rate rate is the actual share of income paid in taxes, which is different from the "marginal" tax rate charged on the highest $1 of income earned. Back in the 1950s, the highest marginal income tax rates sometimes reached 90%. The fact that the average tax rate is so much lower tells you that those very high marginal tax rates were largely for show, in the sense that they didn't actually apply to very much income. York writes: "The graph below illustrates the average tax rates that the top 0.1 percent of Americans faced over the last century, based on research from Thomas Piketty, Emmanuel Saez, and Gabriel Zucman. The blue line includes the impact of all federal, state, and local taxes on individual income, payroll taxes, estates, corporate profits, properties, and sales. The purple line shows income taxes only, including federal, state, and local." The overall pattern is while effective tax rates on the top 0.1% were higher in the 1950s, they haven't shown much long-term trend one way or the other in the last half-century or so.
When listening to arguments over tax policy, it's common to hear complaints about whether deductions should be limited for purposes like mortgage interest, state and local taxes, or charitable contribution. It's useful to remember that those deductions don't apply to most taxpayers. Erica York explains: "In 2016, barely a quarter of households with adjusted gross income (AGI) between $40,000 and $50,000 claimed itemized deductions when filing their taxes. In contrast, more than 90 percent of households making $200,000 and above itemized their deductions." One effect of the 2017 tax reform law is that the number of taxpayers who find it useful to itemize deductions will drop by as much as 60%.
The share of total federal taxes paid by those with high incomes has been rising over time. Part of that change is because the share of those who owe zero in federal income tax has been rising over time. Robert Bellefiore provides a graph. One main reason for the rise share of taxpayers who owe zero is the expansion of refundable tax credits aimed at those with lower income, including the Earned Income Tax Credit and the Child Credit. You can also see the share of those with zero income taxes owed rises in the Great Recession.
In a different post, Robert Bellefiore offers a chart showing the overall effects of federal tax and transfer policy on the share of income received by different groups. He writes: "The lowest quintile’s income nearly doubles, while the second and middle quintiles experience relatively smaller increases in income. The fourth quintile’s income share remains constant, and only the highest quintile has a lower share of income after taxes and transfers. The top 1 percent’s share of income, for example, falls from 16.6 percent to 13.2 percent."
Again, one can argue that the amount of redistribution should be larger. But it would be untrue to argue that a significant amount of redistribution--like doubling the after-taxes-and-transfers share of the lowest quintile--doesn't already happen.