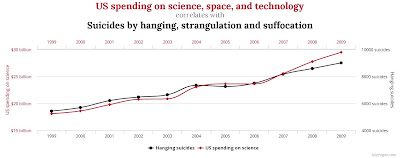
Here are some examples from Tyler Vigen's website, drawn from his 2015 book Spurious Correlations.


Eye-balling these kinds of figures gives you a sense of why these correlations arise. For example, if you have both a right-hand and a left-hand axis, you can set the scales on those figures so that draw the figure so that the starting points and the ending points of the two lines are close to each other--and then the intermediate lines will look fairly common as well. If comparing to data on a certain statistic in a certain state (divorces in Maine, fishing accidents in Kentucky), your statistical antennae should be warning you that by the time you look through a large group of family or health statistics for each of 50 states, there's a reasonable chance of finding whatever pattern you are looking for just by random chance. If you limit the search to relatively short stretches of data like a decade or so, and plug in your computer to sort through the possibilities, finding meaningless correlations isn't going to be hard.


Eye-balling these kinds of figures gives you a sense of why these correlations arise. For example, if you have both a right-hand and a left-hand axis, you can set the scales on those figures so that draw the figure so that the starting points and the ending points of the two lines are close to each other--and then the intermediate lines will look fairly common as well. If comparing to data on a certain statistic in a certain state (divorces in Maine, fishing accidents in Kentucky), your statistical antennae should be warning you that by the time you look through a large group of family or health statistics for each of 50 states, there's a reasonable chance of finding whatever pattern you are looking for just by random chance. If you limit the search to relatively short stretches of data like a decade or so, and plug in your computer to sort through the possibilities, finding meaningless correlations isn't going to be hard.
Of course, at the more serious level of academic research, these types of issues can still arise. Imagine that a researcher is trying to look at the effects of a particular large-scale program. The researcher has lots of data to divide people up into groups: by age, work status, family status, geographic location, education, health, race/ethnicity, gender, religion, and more. The researcher also has lots of possible outcomes for these people: income, marriage or divorce, childbearing, health, employment, retirement, and others. If a researcher looks at all the possible subcategories, it will inevitably be true that this program will seem to have major effects in a certain group: for example, the program may be correlated with a big change in the divorce behavior of white people in the 35-54 age bracket with low levels of religious observance in the state of New York. But if you (or your computer program) scanned through literally thousands of subgroups and possible effects to find this specific correlation, it's fair to assume that the correlation is just as meaningless as any of the examples presented by Vigen.
Classes in statistics emphasize that "correlation doesn't mean causation." The lesson here is even stronger. Correlation doesn't necessarily mean anything at all.