Here's are the occupations of who was in the top 1% of the income distribution, in the tax return data, in 1979 and in 2005. What occupations have a smaller share of the top 1? The share of the top 1% who get their income as "Executives, managers and supervisors (non-finance)" has dropped 5.3 percentage points. The breakdown at the bottom of the table suggests that much of this fall is due to the subcategory of "Executive, non-finance, salaried." The share of the top 1% in the medical profession falls by 1.7 percentage points. The share of the top 1% who are "Farmers & ranchers" falls by 1.5 percentage points.
What occupations comprise a larger share of the top 1%? The share of the top 1% whose occupation is classified as "Financial professions, including management" rises by 5.5 percentage points. The share in "Real Estate" rises by 1.8 percentage points--although surely this gain would be smaller if calculated on data after the drop in housing prices. The share who are lawyers rises by 1 percentage point.

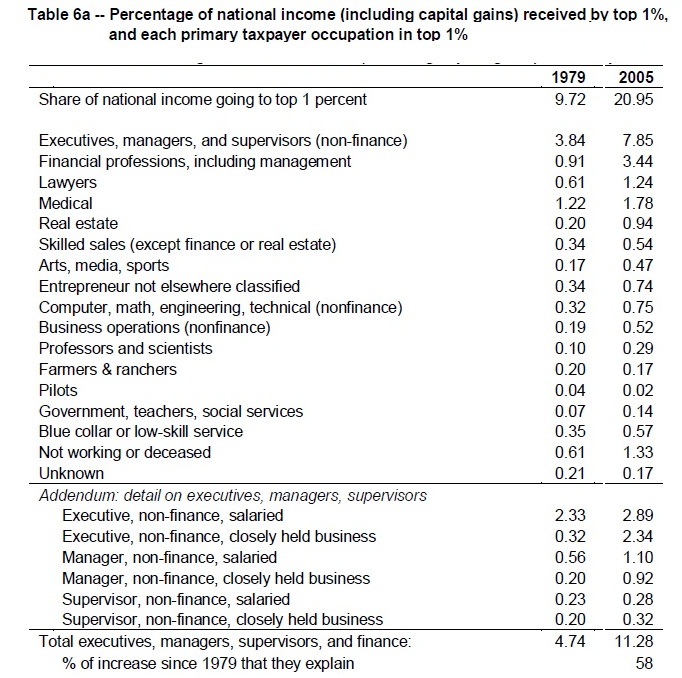
Here's the share of GDP received as income by those in each occupation in the top 1%, again comparing 1979 and 2005. The top line shows that the share of income going to the to 1% roughly doubled over this time. Thus, the interesting question here is whether in some occupations the rise in income was substantially more or less than a doubling. For example, the share of income going to the top 1% in the "Financial Professions, including management" more than tripled, as did the share of income going to those "Real Estate." The share of income going to "Business operations (nonfinance)" and to "Professors and scientists" almost tripled. On the other side, the share of income in the top 1% going to "Medical" rose by "only" about 50%, and the share of income in the top 1% going to "Farmers & ranchers" declined.
Finally, here's a striking figure that compares income growth from 1979 to 2005 for the top 0.1% to income growth for those in the bottom half of the top 1%: that is, those from the 99th percentile to those in the 99.5th percentile. The bottom line shows that on average, the growth rate of real income (in this case, excluding capital gains) was 2.4 times as fast for the top 0.1% as it was for those in the 99-99.5 percentiles. For certain occupations like "Executive, non-finance" and "Supervisor, non-finance," the multiple is much higher. The overall pattern here is that while slogans often refer to the top 1%, for most occupations, referring to the top 0.1% might be a more accurate description of where the largest income gains have been occurring.
